
Specifications


EAW Smaart 6 Operation Manual Applications
73
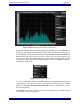
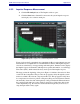
Figure 4-2 Default RTA spectrum display (1/12th-octave)
Experiment with the settings that affect the appearance and behavior of the RTA display.
Frequency scale has the most immediately visible effect. Select the following options
from the Scale list to the right of the main plot: Log, Lin, Oct, 1/3, 1/6, 1/12, 1/24. The
Oct and fractional options result in an Octave or fractional octave band display, repre-
sented as a bar chart. The Lin and Log options are narrowband displays that show the
raw frequency data points from the underlying FFT, in linear or logarithmic frequency
distributions, respectively.
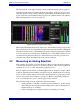
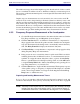
Figure 4-3 Spectrum parameters
Averaging varies the time behavior of the RTA display, presenting either the instantaneous
signal behavior or its long-term spectral content. Select the following options from the
Avg list: 1, 2, 4, 8, 16, 32, 64, 128, Slow, Fast, Inf. Press V on the keyboard to reseed
the averaging buffers.
The Weight setting applies a frequency-dependent weighting curve to the RTA display
(see Weighting Curves on page 65).