
Specifications


EAW Smaart 6 Operation Manual Applications
76
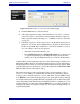
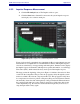
Figure 4-6 Signal Generation screen control (left) and dialog (right)
5. Click the Start button to start the analyzer.
6. Adjust input signal levels using external hardware level controls or software
sound card controls so the reference and measurement channels are approxi-
mately equal and remain in the range –9 to –12 dBFS (see Smaart 6 Signal I/O
on page 14).
7. If the EQ is bypassed or all its controls are set to 0 dB and the input levels for
Smaart are set correctly, the live Magnitude trace should be an approximately
flat line at about 0 dB. If it is a little above or below the 0 dB line, you can do
one of two things to line it up more precisely:
• Adjust the measurement channel’s gain.
• Press Cmd/Ctrl+Up Arrow or Cmd/Ctrl+Down Arrow on your keyboard
or open the Legend dialog for the Magnitude display and use the Y+/-
spinner to move the Live Magnitude trace up or down in 1-dB increments.
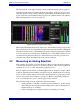
Adjusting filters on the equalizer should now result in visible changes to Smaart’s live
Magnitude and Phase displays. If equalizer attenuation appears as a peak on the display,
the input signals are reversed. To reverse the signals and obtain the proper display, either
swap the input cables (recommended) or reverse the assignments for Meas In and Ref
In in the Audio I/O tab of the Options dialog.
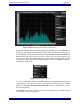
The default frequency resolution for Frequency Response measurements is Fixed
Points per Octave (FPPO), a logarithmically spaced frequency distribution with 24
points per octave except the lowest two octaves, which share 24 points. FPPO is listed
as an FFT Size option in the Frequency Response tab of the Options dialog, although
it is actually achieved using multiple FFT sizes and sampling rates at different frequency
ranges. Experiment with different fixed-width FFT parameters, sampling rates, and
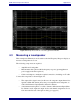
excitation signals to see their effect. Click the Phase button to see phase (in addition to
magnitude) as a function of frequency. Figure 4-7 shows a phase and magnitude plot of
a parametric EQ filter.