
Specifications


EAW Smaart 6 Operation Manual Applications
79
4.3.2 Impulse Response Measurement
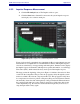
1. Click the IR Analysis button. The Impulse window opens.
2. Click the Start button. SmaartLive measures the system impulse response
and displays it as a time domain plot.
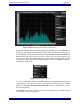
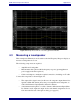
Figure 4-9 Impulse response of a small loudspeaker in a room
Figure 4-9 shows the Log magnitude view (magnitude in dB) of a typical impulse response
measurement of a loudspeaker in a room with reflective surfaces. The impulse response
view shows a time history of energy arriving at the microphone. Smaart 6 can also display
the impulse response in linear units, which preserves polarity information, or as an Energy-
Time Curve (ETC), which extracts the decay envelope from the impulse response.
The large peak at the beginning of the plot in Figure 4-9 indicates the arrival of direct
sound from the loudspeaker. This provides the propagation delay through the system
under test, which is the relevant component in this case. This propagation delay must
be compensated for when we perform a Frequency Response measurement. Smaart
automatically detects the time and magnitude of this peak when the IR measurement
has completed and marks its location with a Locked Cursor. If the delay time found
seems implausibly long, the reference and measurement inputs may be reversed, so
swap the input cables and try again.
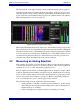
Direct Sound
Early Reflections
Reverberant
Decay
Noise
Floor