
Instruction Manual
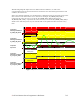

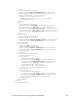
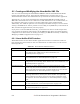

The following diagram depicts the four different alarm conditions, as well as the
corresponding hysteresis levels that must be reached to clear the alarms generated for each
condition, in a line chart.
Please note that the diagram uses enumerations to label the hysteresis levels the input value
must reach for each alarm status to be cleared. For example, AL_HIGH_LMT_CLR_2
represents the value necessary to clear the AL_HIGH_LMT_ALM_2 alarm status.
AL_HIGH_LMT_CLR_1 represents the value necessary to clear the AL_HIGH_LMT_ALM_1
alarm status. The data points in your network will not be updated to these statuses at any
time.
AL_HIGH_LMT_ALM_2
CompValue +
UCPThighLimit2Offset=
AL_HIGH_LMT_ALM2
CompValue +
UCPThighLimit2Offset
- SCPThystHigh2
AL_HIGH_LMT_CLR_2 **
AL_HIGH_LMT_ALM_1
CompValue +
UCPThighLimit1Offset=
AL_HIGH_LMT_ALM1
CompValue +
UCPThighLimit1Offset
- SCPThystHigh1
AL_NO_CONDITION
AL_HIGH_LMT_CLR_1 **
CompValue
AL_LOW_LMT_CLR_1 **
Input Value
CompValue –
UCPTlowLimit1Offset
+SCPThystLow1
AL_LOW_LMT_ALM_1
CompValue -
UCPTlowLimit1Offset=
AL_LOW_LMT_ALM1
AL_LOW_LMT_CLR_2 **
CompValue –
UCPTlowLimit2Offset
+SCPThystLow2
CompValue -
UCPTLowLimit2Offset=
AL_LOW_LMT_ALM2
AL_LOW_LMT_ALM_2
Figure 1 Hysteresis Levels and Offset Limits
i.LON 100 Internet Server Programmer’s Reference 7-15