
User's Manual

Acclarix LX9 Series Diagnostic Ultrasound System User Manual Imaging
- 73 -
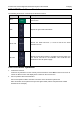
Map
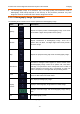
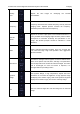
The Gray Map adjusts the post processing map used on the
Contrast image. In general, higher map numbers correspond to
more contrast in the image.
Cine Speed
Adjusts the speed of playing cine loop.
Time
Intensity
Curve
Activates Time Intensity Curve displays. See section 5.11.3 for
details.
Exit
Exits Contrast Imaging mode.
Table 5-13 Touch Screen Controls of Contrast Imaging
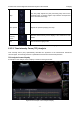
5.12.3. Time Intensity Curve (TIC) Analysis
Time Intensity Curve (TIC) quantitatively describes the dynamics of the intravascular ultrasound
contrast agent, and thereby provides a quantitative assessment of blood flow perfusion.
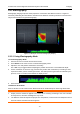
TIC Analysis Screen Display
A example of TIC analysis screen display is shown as the figure below:
Figure 5-10 Example of TIC Analysis Display