
User's Manual

Acclarix LX9 Series Diagnostic Ultrasound System User Manual Imaging
- 75 -
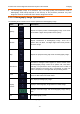
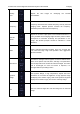
Exit
Exits TIC Analysis.
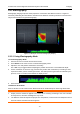
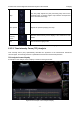
Basic TIC Analysis procedures
1. Perform the scanning and inject Contrast agent.
2. Freeze the image or select a range of images for analysis.
Or, Select a desired cine loop from the stored images.
3. Press TIC touch button to activate time intensity curve analysis.
4. Place ROIs (region of interest) on one of these images, and time intensity curves are displayed
below the image area.
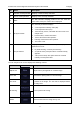
Up to 7 ROIs with different colors can be created on the image. Each ROI corresponds to one TIC
displayed in the chart below the image area. The colors of ROI and its TIC are consistent. Two
tools can be used to place ROIs: Ellipse and Trace. Press Ellipse or Trace on the touch screen,
and follow the instructions displayed on the screen to determine the shape of the ROI.
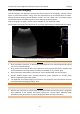
5. Selecting one TIC for analysis.
To select one TIC: press the <Cursor> key on the control panel, move the cursor onto one TIC,
and then press Set key. The currently selected TIC is indicated by "Active" below the TIC chart.
When one TIC is selected, rolling the trackball will move the frame marker and can view the
intensity and time at the frame marker position. Pressing Set key can play the cineloop.
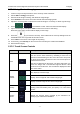
6. If necessary, perform curve fitting.
7. Analyze of the parameters of the curve.
8. Press <Freeze> key or Exit key to exit TIC analysis.