FastBreak Version 6.x Edge Ware, Inc. www.edge-ware.
Disclaimer and License Agreement The information that FastBreak and FastBreak Pro provide is only part of the information needed for a good investment program. Consult your investment representative before buying or selling any fund or stock. Read the prospectus to determine whether an investment meets your objectives. EDGE WARE, INC. DOES NOT RECOMMEND SPECIFIC INVESTMENTS SUITABLE FOR YOUR PERSONAL OBJECTIVES BUT IS LIMITED TO PROVIDING INFORMATION FROM THE BEST AVAILABLE SOURCES.
Table of Contents 1.0 Preface .......................................................................... 4 2.0 Introduction .................................................................. 5 3.0 Upgrade Notes .............................................................. 6 4.0 FastBreak Trading System.......................................... 13 5.0 Technical Support and Upgrades................................ 16 6.0 Installing FastBreak.................................................... 18 7.
1.0 Preface Note: A PDF copy of this manual is on your installation disk. We recommend you put a copy on your computer so you will always have a copy available. This manual supports both Standard FastBreak and FastBreak Pro. FastBreak Pro users will see additional icons on the icon tool bar and two extra pull down menus. The additional FastBreak Pro screens, and optimizer functionality activated by these icons, are covered in the second manual that comes with the FastBreak Pro software.
2.0 Introduction An early version of FastBreak was reviewed in the July 1999 issue of Technical Analysis of STOCKS & COMMODITIES, the premier technical analysis investment magazine. Their review, in part, said, “This is easily the most elaborate fund switching software we’ve run across, and it’d be worth the time to check it out.” The latest version of FastBreak you have in your hands is far more advanced than the version reviewed.
3.0 Upgrade Notes Maintaining Existing FastBreak Trading Strategies If you have existing FastBreak strategies that you like we recommend that you keep the old version of FastBreak on your computer until you have verified that the strategies produce the same results with the new version. Prior to installing the new version of FastBreak go to the folder where the existing version is located, typically ftbreak (ftbreakp for Pro users), and find the file ftbreak.exe (ftbreakp.exe for Pro users).
without the benefit of tight stops. FastBreak now allows you to import the equity curve (FNU file) from this existing system and combine it with a complementary system that reduces the overall MDD when the two systems are traded together. This functionality can also be used to combine FastBreak trading systems that complement non-FastBreak trading systems. Bug Fix and Better Error Checking on Early Start Date V6.5 fixes a problem when the Correlation Check option is used.
Changes in Version 6.2 This section will cover enhancements in FastBreak Version 6.2 and is of interest to users of previous versions of Standard FastBreak. Note: For users of previous versions of FastBreak Pro see the Upgrade Notes in the supplemental FastBreak Pro manual. Version 6.2 (V6.2) is the first release version of V6.X. It has exactly the same functionality of beta V6.1. V6.1 of Standard FastBreak was a beta version that could be run by users of V5.
This section will cover enhancements in FastBreak Version 5 and is of interest to users of previous versions of Standard FastBreak. Note: For users of previous versions of FastBreak Pro see the Upgrade Notes in the supplemental FastBreak Pro manual. You may ask how Version 5 of Standard FastBreak is different from previous versions and if you should reread the manual. The answer is that the changes are extensive and we suggest you read the entire manual to understand the enhancements.
Rank using Sharpe Ratio. This option will tend to purchase high Sharp Ratio funds and produce strategies that have a high Sharp Ratio equity curve. Removed the Long Rank + Short Rank momentum ranking option. This option had the tendency to give ambiguous ranking order because the value produced was an integer (whole) number and more than one fund could have the same value. Removed the Families/Individual option on the Funds/Index tab. This option was never very useful.
o Adjust the Beta Buy filter value based on market conditions or external file input. o Adjust the EMA Buy filter value based on market conditions or external file input Beta buy filter can now be a non-correlated beta as an option. Beta is the ratio of the volatility of a fund divided by the volatility of an index (typically the S&P 500), multiplied by a correlation value between the fund and the index. If a fund has a low correlation to the index it can have a low beta but be a very volatile fund.
ommend you keep the old version of FastBreak on your computer until you verify your systems haven’t changed. Here are just a few reasons why strategies my give different results with the new version: In previous versions of Standard FastBreak if a stop was hit, but the fund hitting the stop was still the top ranked fund, the detail file would show the fund being sold and then repurchased. New logic always checks to determine if the fund being purchased was the one just sold.
4.0 FastBreak Trading System FastBreak uses a trading system method that buys mutual funds showing strong relative trends in price and sells funds that are showing poor relative trends in price. You may hear traders refer to this type of trading system using many names: market sector upgrading, momentum investing, trend following, fund ranking, and relative strength trading. We will take a quick look at each of these concepts, because there are small differences, and explain how FastBreak works.
of a fund to an index and buys the fund that is showing the strongest strength compared to the index. Ranking strategies compare the price action of a fund to a group or “family” of other funds. The fund showing the greatest percentage change in price is purchased. There are obvious similarities in all these systems. FastBreak uses the Ranking method to select the funds to buy and sell.
7 FBIOX Fidelity Sel Biotechnology/042 8 FSCPX Fidelity Sel Consumer Prod/517 9 FSCSX Fidelity Sel Software-Comp/028 10 FSVLX Fidelity Sel Home Finance/098 11 FSHCX Fidelity Sel Medical/505 12 FSCGX Fidelity Sel Indus Equip/510 13 FDFAX Fidelity Sel Food & Agric/009 14 FSPHX Fidelity Sel Health Care/063 15 FSPCX Fidelity Sel Insurance/045 16 FSDCX Fidelity Sel Develop Comm/518 17 FSPFX Fidelity Sel Paper & Forest/50 18 FSDAX Fidelity Sel Defens & Aero/067 19 FSCHX Fidelity Sel Chemicals/069 20 FSDPX Fidelit
5.0 Technical Support and Upgrades Note: Do not call Investors FastTrack for technical support. Do not use the 800 order line number for technical support. This is a commercial order line that only takes orders and they are not equipped to answer any questions. Any messages left with the order line will not be returned. Please read this entire manual and check the FAQ chapter before contacting support. We have tried to make this software and documentation as user-friendly as possible.
Upgrades We provide minor upgrades to FastBreak on our web site, and if you encounter an error, we suggest you download the latest version of the software because this will often solve the problem. The Edge Ware Internet Web site (www.edge-ware.com) always has the latest version for download along with release notes. FastBreak is constantly improving, and we try very hard to get those improvements in the hands of our users as fast as possible.
6.0 Installing FastBreak Note: If you computer doesn’t have a CD drive you can still install FastBreak. If you can get access to a computer with a CD drive then copy all the installation files on the CD to a memory card. Load the files on the new computer into a temporary folder. C To install FastBreak: Note: Windows 7 Installation Note – During installation on a computer with Windows 7 you may get an error during installation (the error may mention mcf40.
4) The second screen you will see is: The setup program is asking the name of the drive and directory where FastBreak is to be installed. The default is C:\FTBREAK (FTBREAKP for Pro), and we suggest that you use the default directory name. If the default is acceptable click on the button that resembles a computer.
Reinstalling FastBreak Note: Windows 7 Installation Note – During installation on a computer with Windows 7 you may get an error during installation (the error may mention mcf40.dll) If this occurs, click Ignore and the installation will complete properly. Reinstalling FastBreak is our number one tech support problem. Users crash hard drives, buy new computers, new laptops, etc. You MUST use the installation CD to reinstall.
7.0 FastBreak Options and Functions FastBreak is run from the Windows environment, and your installation should have created an icon when you click on the Windows Start button and go to Programs. If you want to put an icon on your Windows desktop find the ftbreak.exe (ftbreakp.exe for Pro) and put a shortcut to this file on your desktop. Refer to your Windows manual for guidance on how to do this. Click the icon as you would to launch any application.
When FastBreak is launched, it will read all the family names in your FastTrack directories (Ft\Ftdef, Ft\Userdef, and Ft\Ft4win\Sftdef), including user created families, and load all the fund names including your FNU files. If FastBreak hits an error during the loading of your FNU files this indicates you have a corrupt FNU file. You will need to move all your FNU files from your FastTrack (FT) folder to a temporary location. Now, try to restart FastBreak.
characters such as ~,@ etc. You can also use the slider bar to the right of the family names to find the family of interest. Once the family is located, use the cursor and left mouse button to click the family. It will highlight as in the above screen. Note: The highlighted family will NOT appear in the box where you started to type the name. Note: FastBreak will read all your FNU files. When these files are made part of your trading family, FastBreak will include them in the trading strategy.
If using money market in a ranking strategy, this menu item will allow you set a minimum holding period for the money market fund before it can be sold. Many users like to set this to a short value because money market funds usually do not have a minimum hold period or short term trading fees. If you use a substitute fund in place of a money market fund, remember that FastBreak does not apply any short term trading fees to the money market. Note: The period is in calendar days not market days.
Strategy Tab Next, click on the Strategy Tab to bring up the following screen: This is the most complicated menu screen in FastBreak. This tab sets up the majority of the trading strategy parameters. Buy and Sell Strategy This may be the most difficult part of FastBreak to understand. The “Buy and sell strategy” menu is a pull down menu. Click the down arrow button just to the right of the box below the line that reads “Buy and sell strategy” to see all the trading options available.
Buy and sell using rank - This is the most often used strategy. A simple FastTrack type ranking is made on the funds in the selected family. The ranking produces a list of funds in order of decreasing gain over some specified time period. This is equivalent to using the blue pole and rank function in FastTrack. FastBreak will “buy” a fund if it is the top ranked fund and will “sell” a held fund if it drops out of the top part of the family of funds during a ranking.
ago. The long period NAV ratio is: 18.00/17.45=1.0315, and the short period NAV ratio is: 18.00/17.75=1.014. Multiplying these two ratios together: 1.0315 X 1.014= 1.046. This is done for each fund, and the multiplied ratio results are used to do a ranking with the fund having the largest value as the #1 fund. When this option is selected four new boxes appear on the screen, Min Long, Max Long, Min Short, and Max Short. This allows a range of long and short combinations to be tested.
Buy and Sell using Sharpe Ratio – This option ranks funds based on short term Sharpe Ratio. Sharpe Ratio is a common measure of reward and risk. See FastTrack Help for a description of Sharpe Ratio. Buy Slope Type/Sell Slope Type This button selection menu is used to select the type of slope to use when using a curve fit strategy. Linear, Power (shown as Non-linear) or Quadratic curve fits can be used.
The Harnsberger Option invokes a strategy developed in cooperation with Fritz Harnsberger, a money manager in Santa Barbara (see Resource chapter). Mr. Harnsberger noted that the standard FastBreak ranking system is a “sell based” system in that it will not buy a new fund until a currently held fund drops in relative strength and generates a sell. Often there may be a fund or funds that are doing extremely well on the buy ranking but can’t be purchased until a fund is sold.
Breakout Optimization Method (BOOM) This is a very powerful proprietary option available only in FastBreak. The exact process of how the option works is not fully disclosed at this time because of the proprietary nature. BOOM often allows a strategy to purchase a fund much earlier in an up-trend breakout than would be captured by standard ranking methods. Note: The BOOM option will not work with all ranking strategies. See the table at the end of this chapter.
Typical FastBreak trading systems usually buy maximum price strength/momentum. Trading systems can take a different approach and successfully take advantage of buying temporary price weakness or selling into short term price strength. RAT is an option to take advantage of these temporary moves. The assumption is that the move is temporary and the price will revert to trend. Note: Please see Appendix for a much fuller explanation of how RAT works along with graphical examples.
These values are similar to Buy min and Buy max except they set the range for all sell ranking periods to be tried. If Buy min = 2, Buy max = 50, Sell Delta = 1, Sell min = 2, Sell max = 50 and Sell Delta = 1, FastBreak will loop through 2401 test cases (49X49). As noted above, if “Set sell rank = buy rank” is checked, these three parameters are not used and FastBreak will gray them out. Note: These ranking periods are “market days” and not calendar days. You must understand the difference.
Min Period, Max Period, Delta, and SMA Period Min EMA, Max EMA, Delta Note: These parameters are only visible if Buy and Sell using General Anchored Momentum has been selected. See Appendix A for a complete discussion of this strategy. Min and Max Period describe the range of look-back periods to test. Delta is the size of the increments to use in the testing range. SMA Period is the Simple Moving Average Period used to smooth the price data centered on the look back period.
Buy Min, Buy Max, Buy Delta, Alpha index Sell Min, Sell Max, Sell Delta Note: These parameters are only visible if Buy and Sell using Alpha has been selected. See Appendix A for a complete discussion of this strategy. Min and Max Buy Period describe the range of look-back periods to calculate alpha for buying a fund. Delta is the size of the increment to use in the testing range. Min and Max Sell Period describe the range of the look-back period to calculate alpha for selling a fund.
This screen option allows you to select the Short Term Redemption Fee (STRF) minimum holding period. If the funds in your family apply a redemption fee if the fund is traded within a minimum number of days, then use this option. For example, the Fidelity Select funds have a 0.75% fee if traded within 30 days. Short loss This is the percent cost if a fund is sold before it is held the “STRF Min hold” number of days. For example, some funds have a transaction fee of 0.75% if held less than 30 days.
while it is in position 1-14 (Top 50%) in the rank list. If the fund falls in the range of 15 – 28, it will be sold. If the trading family contains 30 funds, but only 24 are available early in the testing period, Top% is applied to 24 during that early time period. See FastBreak Calculation Details chapter for additional information. # funds This is simply the number of funds the investor wants to hold at any given time.
Checking this box will open a file selection menu, and a standard FastTrack signal file can be selected. The signal files are usually in a separate subdirectory in the FastTrack directory. This signal file requires a “buy” before any fund, except money market, can be purchased. When a signal file gives a “sell” funds will be sold ignoring all other rules including the Min hold rule. All positions will be put into the selected money market fund.
Balance Multiple Funds This menu item allows the user to “Balance” the money among accounts if multiple funds are being held. See the chapter on FastBreak Calculation Details for a detailed explanation of this feature. It is very important to understand this item if a fund other than an actual money market fund is selected as the “Money Market Fund.” Note: The balance option will not work if using a signal file and a market risk greater than zero.
Dynamic Adjustment of Ranking Periods and Top% This option allows adjusting some parameters as market conditions change. For example, you may propose that ranking parameters should be longer when the general market is trending up, and shorter parameters used when the market is moving sideways or moving down. The way the option works is to apply the Adjust Factor when the Adjust Index breaks (moves lower) than its Exponential Moving Average (EMA) specified by the Adjust EMA Days.
Summary of Option Combinations The following table summarizes which options (POP, BOOM, and BOSS) are available with which ranking strategies. For example, all three are available for simple ranking. Note: BOSS is a stop option that will be covered in the Stop section of the manual. Note: BOOM will only work with Linear form when using Slope ranking.
Stop Loss Tab Click on the Stop Loss Tab to see the following screen: A stop loss is used to close or “stop” out of a fund position because of a stop parameter violation. FastBreak allows selection from many different stop loss functions or combinations of functions. If the fund has been held less than “STRF Min hold” when the stop generates a sell the “Short loss” value will be subtracted from the strategy returns. You can enter stop loss functions for two separate time intervals.
Trailing Loss % This is the maximum draw down an investor is willing to accept on any trade. The loss is calculated based on maximum NAV after a fund purchase. For example, if the user sets this value to 12%, and a fund is purchased for a NAV of $8.00 and later rises to a maximum value of $13.00, the fund will be sold if the NAV drops below $11.44 ($13.00$11.44)/$13.00 = 12%).
Parabolic See Appendix A for an explanation of this stop function. FastBreak allows the user to set the Start, Maximum, and delta value (shown as Acceleration on the screen) for the parabolic Acceleration Factor. Note: When this option is selected, a fund trading below its parabolic will not be purchased even though it may be ranked very high in the trading family. This is done because it would instantly be sold the next day. Kase Dev See Appendix A for an explanation of this stop function.
that the Period be set to at least thirty trading days to calculate a standard deviation that is statistically significant. Exponential Moving Average This stop will sell a fund when it drops below its exponential moving average (EMA) that is calculated over a user defined “Period”. For example, if a period of fifty (trading) days is used, the fund will be sold when the NAV drops below the fifty day EMA. For a definition of EMA see FastTrack Help.
This option will sell a fund that drops below a user defined minimum annualized rate of return percentage over some user defined number of market days. For example, a user may not be interested in holding a fund that has an annualized rate of return that is less than a money market. Note: When this option is selected, a fund trading at or below the specified ROR will not be purchased even though it may be ranked very high in the trading family. This is done because it would instantly be sold the next day.
This is the Trendline Stop option. It will sell a fund when the fund trades below its trendline. See the Appendix A for details of how FastBreak calculates trendlines. The Size text box is used to control the significance of the price dips used to draw the trendline. If a small value is used then smaller price dips will be considered significant and shorter term trendlines will be drawn.
Buy Filter Tab This tab contains filters that can be applied to a fund prior to purchase. As FastBreak considers a fund for purchase, the fund will need to pass any filters activated on this tab. These filters are not to be confused with the similar stops. The filters are only considered during the fund purchase process. In the Stop Loss tab, a fund will be checked against the stop during the purchase phase and each day the fund is held.
Beta Buy Filter This option will prevent purchase of a fund that has a beta greater than specified by the filter. The index used to calculate beta is specified on the Funds/Index Tab. This option has at least two uses. One, it can be used to build trading systems that have low volatility. The second use is to build trading systems that perform better in volatile or down markets.
This option will prevent the purchase of a fund that is not increasing in price at an annualized rate defined by the user. In the above example, if the user does not want to purchase a fund that isn’t increasing at an annualized rate of at least 8% over the past 50 market days (Mkt Days), this option will prevent buying a fund. A reason for using this option is that the user may prefer to go into a money market that has an equivalent annualized rate of return without the associated market risk.
EMA Crossover Buy This option is very similar to the Exponential Moving Average Buy Filter except the fund NAV is smoothed with a Short EMA value, and this Short EMA must be trading above the Long EMA to be available for purchase. Trendline Buy Filter This is the Trendline Buy Filter option. It will only purchase a fund when the fund trades above its trendline. See the Appendix A for details of how FastBreak calculates trendlines.
Adjust EMA Buy Filter This option is very similar to the Adjust Beta Buy Filter option. The intent is to adjust the EMA Buy Filter value based on an index crossing below its EMA value. The factor can be greater or less than 1. Combine/Complementary Systems Note: This function shouldn’t be considered a Buy Filter. It was placed on this screen simply because there was room available.
You can use one or two existing systems. Just check the box next to the System Name text box to tell FastBreak Pro which system(s) to use. The Summary tab will show the combined performance for the three systems in the weights specified. The Switches per Year is a special case. FastBreak Pro has no knowledge of the number of switches per year for existing systems (ETF14 and ETF 17 in our example) so the Summary tab will only show the switches for the DFT system you are executing.
Output Files Tab Select the Output Files Tab to bring up the following screen: This screen allows the user to select a variety of outputs. Summary file The Summary file is the name of the file where FastBreak stores the trading strategy output. FastBreak always produces a Summary file. The user can define a path and name for this file by clicking the small box to the left of the file path. A panel will appear allowing entry of a Drive, file name and path.
name and path. A description of the Detail file contents will be described later. Note: It is suggested that the detail file be created only when a single strategy is run; otherwise, FastBreak will run slower and a very large file will be created. Make Signal File Checking this box will create a market timing signal file in the FastTrack signal file format. See the FastTrack manual for complete information on signal files. The signal file can be read by FastBreak and FastTrack.
Summary Grid Tab The Summary Grid will appear while FastBreak is executing.
The file contains the results from each test case. Note: When running a single trading strategy, only one row will appear on this screen.
existing file from the listing. Select OK, then click on the Summary Grid Tab. This will load the existing file data. Detail Grid Tab Selecting the Detail Grid Tab will show the following screen only if a Detail file was selected in the Output Grid Tab (Note: you must have executed a strategy to create a detail file prior to trying to view the Detail Grid): This file contains details on each trade made during execution of a strategy.
The WHY column contains the reason the trade was made.
knows the earliest you can sell is next Monday and it gives credit for three days. It does not keep track of market holidays.
This part of the Detail file shows statistics on each fund that was traded in the strategy. Funds in the trading family not traded are not included.
File menu . The File pull down menu is used to open and save default files, print summary and detail files, and set preferences file. The exit menu item is used to exit from FastBreak. Selecting the Save Defaults menu item opens the following screen: This allows you to save all your trading strategy file settings into a file with a name and path of your choice. The Save Default menu item saves the settings in the file name you have previously created.
This example indicates that no specific set of defaults will load when FastBreak is launched. If you push the small button, a default file selection menu will be launched. It will list all your saved Default (*.dft) files. You can select a file from this list and it will appear in the above blank box. The next time FastBreak is launched, the settings in this file will be loaded. Note: This feature is often overlooked.
This menu allows the user to sort the Summary Grid information in ascending or descending order by many of the fields in the Summary Grid. For example, the user may want to sort all the test cases by descending annual gain or ascending maximum draw down. Use the pull down arrow menu to select the field to use for sorting.
8.0 FastBreak Examples This chapter will run through two typical FastBreak studies, running the program, looking at the output files and looking at the FNU file in FastTrack. Note: Your results may be somewhat different because of changes in the trading family since the manual was written. Note: If you need to terminate a FastBreak run, use the Cancel button at the bottom of the Summary Grid screen. There will be a delay as FastBreak finishes the current test case.
11. “Delay” of 1 day 12. “Short loss” any value will work (Without setting a stop, or using a signal file, Short loss will not be used) 13. Check the “Set sell rank = buy rank” 14. “Start date” of 01/01/1989 (notice that FastBreak will change to 01/03/1989, the next available trading day) 15. “End date” of 12/31/1995 (notice that this date is changed to 01/02/1996, the next available trading day) 16. “Buy min” of 2 days 17. “Buy max” of 50 days 18. “Delta buy” of 1 day 19.
3. Notice that a 26 day ranking produced good results. This will be used for the next run. Note: Your results may be different due to changes in the Select family since this example was created. 4. Jump back to the Strategy Tab Second Run This run will be for a specific test case. From the first run, it was found that a 23 day ranking period looked good. This case will be evaluated in detail by changing only a few menu items from the first run. 1. Set “Min buy” and “Max buy” to 23 days 2.
9.0 Analyzing FastBreak Output FastBreak summary files can be analyzed in spread sheets (or in a companion product from Edge Ware called FastGraph) and this is where the real power of FastBreak can be realized. This example will compare the effect of changing a single parameter on return results of a trading strategy. Make sure you change the summary file name when making the two runs. Start by making two FastBreak runs, one of them can be the first example from the previous chapter.
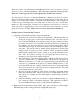
then selecting the sort command. The effect is to put the cases in order of decreasing results. Do this for both summary files. Annual Gain, % Now, re-chart the data, but only for the best 30 test cases, and the following chart will be created: Annual Gain (best 30 cases) 45 43 41 39 37 35 33 31 29 27 25 0 1 fund 5 10 2 funds 15 20 25 30 Test Case, best-worst Now it becomes clear that holding one fund usually has better performance than holding two funds, on the order of 2-3% per year.
The difference between the curve fit lines is 2-5 % for the better performing test cases. The trader would need to determine if 2-3% per year of performance is worth reducing maximum draw down by 2-5% Finally, what are the best parameters to use for buy and sell ranking? The values that gave the best annual return may not be the best choice because that combination may have bad characteristics, i.e., high draw down, too many switches per year, etc.
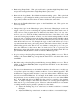
are run, only chart the top 5%-20% of the top best test cases by charting sell ranking and buy ranking (or AccuTrack parameter 1 and parameter 2) to determine if clusters of points are formed: Best 10% of Test Cases Sell Ranking Period, Days 50 45 40 35 30 25 20 15 10 10 15 20 25 30 35 40 45 50 Buy Ranking Period, Days Clusters of points are centered about a band from 14/40 through 25/40 day ranking periods as well as a smaller cluster at 19/35 day ranking periods.
This chart was made using FastGraph. The way to interpret the chart is darker regions have better performance than lighter regions. The chart is color on the monitor and much more informative. This chart confirms the previous chart because there are dark contour regions in the area where the points clustered in the above spreadsheet example. Although the answer is the same as the previous X, Y scatter chart, it is much easier to interpret.
10.0 Building Market Timing Signals FastBreak can be used to develop market timing signal files. These signal files are in the standard FastTrack DOS format, i.e., a buy “B” or sell “S” followed by a date. See FastTrack Help for additional details. The files look like the following and are usually found in the FastTrack Sig folder: B,09/01/1988 S,06/19/1989 B,06/27/1989 S,12/11/1989 B,05/15/1990 The best way to explain how a signal file is generated is to use an example.
If you compare the signal file results with the Detail file results you will observe. Each time FastBreak sells the money market fund a Buy, i.e., “B” in the signal file, is generated. Each time FastBreak moves from one of the indexes back to money market a Sell, i.e., “S” is generated. If one index is sold and the other index purchased, no signal is generated. In other words, the FastBreak signal file stays on a Buy as long as you are in one of the fund family positions.
11.0 FastBreak Calculation Details Here are some details on the way FastBreak analyzes a trading strategy that may not be obvious; but the user needs to be aware of these details. Account Balancing This option tries to mimic the way many investors would balance their fund accounts. If the trading strategy holds more than one fund, FastBreak tries to “balance” the value of the fund accounts if the Balance option is selected on the Strategy screen.
case it checks the second ranked fund, etc. However, if the top ranked fund is money market it can be bought again. This is considered a defensive position because money market funds can move to the top of the ranking when the entire market is in a major decline. Impact of Fund Distributions The user needs to be aware of the impact of fund distributions on FastBreak. There is usually at least a one day delay in adjusting the FastTrack data base for distributions.
was not a frequent occurrence. However, it did happen enough that we changed the logic in FastBreak to prevent it from happening. If a stop is hit, FastBreak does a check to determine if the same fund would be repurchased. If this is the case, FastBreak does not take the trade. This makes the software run a little slower, but we feel it is a better representation of how a user would actually trade the system. It also has the added benefit of not charging any redemption fees on the false trades.
Building Market Timing Signals If you have an overall strategy with an MDD of say, 15%, then don’t make the market signal too efficient. For example, when building the market timing signal use a goal of perhaps 20-25% for the signal MDD. Then, when you use the resulting signal to build the actual trading system, use the 15% MDD goal. The reason for this is that if the signal is too efficient; no stops will be necessary in the actual trading strategy.
12.0 Suggestions on Improving Trading Strategies See the Resources Chapter for a list of resources that may help you in developing your trading strategies. Precious metal funds do not normally work very well with ranking strategies. This has been noted by other studies, and you may want to consider removing these funds from your trading strategy. Some funds have similar objectives - energy vs. energy services, energy vs. natural gas, technology vs. electronics.
13.0 Trading using FastBreak Once you have determined your trading strategy and which parameters to use, you can store them using the Save Default As command from the file menu under the File pull down menu or the icon on the Tool Bar This menu item was discussed earlier. Note: Be certain your strategy dft file builds a Detail file in the Output tab. Each day you run FastBreak look at the Detail Grid Tab. This file will flag a fund to be sold with an “*” and indicate the fund to roll the proceeds into.
14.0 Batch System Processing If you have several trading systems to be evaluated each day, you can now build a “batch” file that will load, run, and save the results of all your systems. It will open a page in Microsoft Notepad that you can print. Use the Batch pull down menu: The menu choices are Run, Create, and Update. You must first create the batch file using the Create option.
screen will open that allows you to give a name to the Notepad text file. Note: If you check the Include Detail option, the batch run will put the last ten lines from the Detail file into the Notepad file. For this to happen, you will need to make certain your strategy creates a Detail file during strategy execution, i.e., you must have a detail file created on the Output tab.
15.0 Frequently Asked Questions Q) I crashed my hard drive (got a new computer, new laptop etc.) and I need to reinstall FastBreak Pro. A) This is our most common tech support call. You MUST use the installation CD to reinstall. We have had a number of users just try to copy files to the new computer or hard drive. This will not work.
A) When FastBreak is launched, it will read all the family names in your FastTrack directories (Ft\Ftdef, Ft\Userdef, and Ft\Ft4win\Sftdef), including user created families, and load all the fund names, including your FNU files. If FastBreak hits an error during the loading of your FNU files, this indicates you have a corrupt FNU file. You will need to move all your FNU files from your FastTrack (FT) folder to a temporary location. Now, try to restart FastBreak.
in NAV that may indicate a distribution. If there is, then you may want to wait a few days until FastTrack adds the distribution to the database. Q) Today in the Detail file I see a situation where position #1 of my strategy sold a fund and position #3 sold its position and purchased the fund sold by position #1. Why? A) This explanation for this situation can be found in Chapter 11.0 FastBreak Calculation Details under the section Clarification on using Stops and Signal Files.
A) We added this functionality at the suggestion of a user and have no experience with how effective this strategy works. This option may be worth further consideration with the FastTrack stock data base.
16.0 Resources We have sample trading systems on our web site www.edge-ware.com. We also write a yearly commentary on how different trading systems performed. You may get ideas from reading these commentaries or avoid some of the mistakes we have made over the years. These commentaries are available on our website. We use www.ft-talk.com as a place to post new information and discussion. This subscription site is popular with Investment FastTrack users.
Appendix A - Technical Discussion Curve Fitting FastBreak uses three different types of curve fits: Least Squares Linear, Power (called non-linear on menu), and Quadratic. Linear is the most common curve fit and has the form: y = a1x + a0 Where: x : is the independent variable (in our case, days) y : is the dependent variable (in our case the normalized NAV) a : is a constant The slope is the rate of change of y with respect to x.
Now, using the slope of each equation at trading day 12 the following chart is made: Slope at Day 12 1.05 Quadratic NAV 1.04 1.03 Power 1.02 1.01 1.00 0 2 4 6 Trading Days 8 10 12 The Linear curve fit has not changed because it is a constant value for all values of x. The slope of the Quadratic equation has gone negative while the Power equation is still positive but less so than the Linear fit.
Ulcer Performance Index The Ulcer Performance Index is defined in Martin & McCann’s book The Investor’s Guide to Fidelity Mutual Funds. The Ulcer Performance Index, UPI, is a measure of risk adjusted return. It is a measure of the investment performance over money market returns compared to the amount of risk. In general, the higher the value of UPI the better the strategy. UPI = ANN - 5.4 UI Where: ANN = The compound annual return of a fund or strategy over a test period. 5.
When using the parabolic stop, FastBreak will not purchase a fund if it is trading below its parabolic because the fund would be stopped out the following day. Graphically, the mutual fund NAV and corresponding parabolic value look as follows: Parabolic 60 50 NAV, $ 40 30 20 10 0 0 NAV 100 200 300 400 500 Trading Days Parabolic Kase Dev-Stop The Dev-Stop system was developed by Cynthia Kase and is explained in her book Trading with the Odds.
looking at three days of closing prices. For example, today’s true range would be the high of the last three days minus the low of the last three days. The ATR and SD of the true ranges is calculated over a user defined number of market days. Kase has recommended 30 market days, but the user can specify any number of market days.
becomes very deep. It was felt that this steady buying may also apply to mutual funds that are invested in a “high demand” group of stocks. A methodology was developed that would apply a penalty to funds based on the number and depth of their drawdowns from their recent highs. Another way of looking at the methodology is to favor upside volatility, but penalize downside volatility.
Commodities magazine. FastBreak incorporates two versions of AM - General Anchored Momentum (GAM), and Most Anchored Momentum (MAM). GAM divides a smoothed recent price by a smoothed price from some number of lookback days (ranking period). The recent price is smoothed by an Exponential Moving Average (EMA). The price from the look-back period is smoothed by a Simple Moving Average (SMA) centered the price on the look-back number of days.
period. The current NAV is smoothed by an EMA specified by the user. The ratio of the two moving averages is used to calculate a ratio used to make a relative strength ranking just like GAM. Alpha Ranking Several users have asked for an option to trade funds based on “alpha” ranking. Most investors are familiar with the “beta” parameter that measures fund volatility when compared to an index. A common example of high beta funds is Rydex Nova. This fund has a beta of 1.
Notice there is a very obvious relationship between return and beta. The thin line is a trend line of all the data points. You will notice that there is considerable “scatter” in the data. For example, at a beta value of approximately 1.2, the annual performance for individual funds can vary from 19% to over 27%. Alpha ranking has the intent of trying to purchase the fund with superior performance at a given level of beta.
“force” the line to other expectations. A mathematical algorithm is not subject to such expectations, but at the same time cannot “see” other potential complications and complexities. NOTE: The algorithm to determine trendlines is very computer time intensive. If you are using a very large trading family you will notice a long delay to evaluate the strategy. Although the basic idea of trendlines is rather simple, implementation and especially automated implementation, can be come rather complex.
The trendline algorithm in FastBreak makes a determination if the low price point dip (in an upward trend) is significant and should be considered as a trendline anchor point. The exact method used to make this determination is proprietary. It is also quite technical and the vast majority of users would not be interested in a multiple page explanation filled with equations. Another aspect of trendlines is that they can be drawn for the short term or the long term.
Investment objectives will help define how trendlines are drawn. For example, if a primary objective is to avoid large equity draw-downs then trendlines that capture smaller price moves and avoid significant sell offs will be a reasonable choice. However, it is often the case that to maximize return at the expense of large draw-downs requires trendlines that capture larger price moves and are drawn using more significant price low points. The algorithm used in FastBreak allows either choice to be made.
To activate the trendline Buy filter the above option is on the Buy Filter Tab. Activation of this option will prevent purchase of any issue that is trading below its trendline. As with the Trendline Stop, the Size box controls the type of trendline used. Reasonable values to use are 0 to 15. Data Required to Determine a Trendline It can take a considerable amount of historical data to determine the first trendline.
RAT (Return Advance to Trend) Typical FastBreak trading systems usually buy maximum price strength/momentum. Trading systems can take a different approach and successfully take advantage of buying temporary price weakness or selling into short term price strength. RAT is an option to take advantage of these temporary moves. As an example, in the following chart the stock has made a move above the price trend. The assumption is that the move is temporary and the price will revert to the trend.
In this case the temporary move is a positive because if the price returns to the previous trend there is addition profit to be made. The RAT algorithm will enhance this stock’s ranking by the degree the price is below the trend. You may notice a significant increase in trades when using RAT. One explanation is that the moves away from the trend are short term in nature and a system that trades more frequently can take better advantage of the return to the trend.
ing; however, we must first determine if this is in fact a new, better (steeper) upward trend or just a temporary price aberration. FastBreak performs two checks to make a determination on the trend. First, you will see that BAT has three parameter text boxes similar to BOOM. The nature of these parameters is very similar to the BOOM parameters, and as with the BOOM algorithm they are propriety. Suffice to say, the parameters are used to make a statistical determination if the breakout is real.
Putting it all together BOOM, BAT, and RAT can all be used together. Here are the steps: 1. If BAT option checked, then determine if a new, stronger, uptrend breakout has occurred. a. If a new trend isn’t found then the slope will default to a simple linear slope ranking b. If a new trend hasn’t been found and Use RAT except BAT is checked then RAT will be applied to adjust the slope value (either up or down) according to how much the latest price is above or below the new trend. c.