
User Manual

30
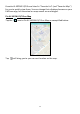
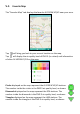
V-3 All Map
The “All Map” tab displays all the AI-1001W V2/V3 near your area.
Tap will bring you back to your current location on the map.
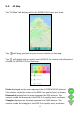
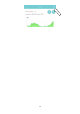
Tap will display the air quality level of PM2.5 (in a chart) and information
of other AI-1001W V2/V3 on the map:
Circles displayed on the map represent the AI-1001W V2/V3 stations.
The number inside the circles is the PM2.5 air quality level, as shown:
Diamonds displayed on the map represent the EPA stations. The
number inside the diamonds is the PM2.5 air quality level, as shown:
Triangles displayed on the map represent the LASS stations. The
number inside the triangles is the PM2.5 air quality level, as shown: