MCE User’s Guide Version 1.
MCE User’s Guide Copyright and Warranty © 2000-2004 Kimmo Uutela. All rights reserved. The author makes no warranty of any kind with regard to this material or the software. This document contains proprietary information, which is protected by copyright. No part of this document may be copied or changed without the prior consent of the author. The information contained in this document is subject to change without notice.
MCE User’s Guide Contents 1 Introduction . . . . . . . . . . . . . . . . . . . . . . . . . . . . . . . . . . . . . . . . . . . . . . . . . . . . . . . 1 1.1 1.2 1.3 1.4 1.5 2 Getting Started . . . . . . . . . . . . . . . . . . . . . . . . . . . . . . . . . . . . . . . . . . . . . . . . . . . . . 3 2.1 2.2 3 Analyzing data . . . . . . . . . . . . . . . . . . . . . . . . . . . . . . . . . . . . . . . . . . . . . 3 Quitting the program. . . . . . . . . . . . . . . . . . . . . . . . . . . . . . . . . . .
MCE User’s Guide 11.2 Creating movies . . . . . . . . . . . . . . . . . . . . . . . . . . . . . . . . . . . . . . . . . . . 20 12 MCE windows and dialogs . . . . . . . . . . . . . . . . . . . . . . . . . . . . . . . . . . . . . . . . . . 21 12.1 12.2 12.3 12.4 12.5 12.6 12.7 12.8 12.9 12.10 12.11 12.12 12.13 12.14 12.15 Window menus. . . . . . . . . . . . . . . . . . . . . . . . . . . . . . . . . . . . . . . . . . . . Main window . . . . . . . . . . . . . . . . . . . . . . . . . . . . . . . . . . . . .
MCE User’s Guide Introduction 1 Introduction This manual describes the use of MCE program to analyze magnetoencephalographic (MEG) measurements using L1 minimum norm estimates1,2 (L1 MNE). 1.1 Hazard Information This manual contains important hazard information which must be read, understood and observed by all users, For your convenience all warnings that appear in the manual are presented below.
Introduction MCE User’s Guide 1.2 Version This manual refers to program version 1.3 patch level 18 and later. 1.3 What’s new? • Default directory menu • Export figure menu • Batch calculation error log display • Slowed down animation • Calculation can be cancelled • Showing selected ROI in arrow display • Show subject ID & file name in different figures • Added several warnings to the manual 1.
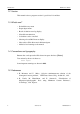
MCE User’s Guide Getting Started 2 Getting Started To start the program, double click the MCE icon in the Neuromag folder of the Application manager. An iconified Matlab console appears on the desktop; do not close it! Also the main window shown in Figure 1 opens. If you are using a previously calculated response, you should now load an old calculation (p. 12). Otherwise, you should select a data file using the [File] button and select the head model (p. 8).
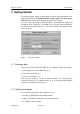
Selecting the data file and pre-processing MCE User’s Guide 3 Selecting the data file and pre-processing Select the MEG data file by pressing the [File] button of main window (p. 22). Select the data file from the dialog. If the file has several data sets, a selection dialog pops up and you can select the correct data set. When the you have selected the data, the pre-processing dialog (see Figure 2) will open. Figure 2 The pre-processing dialog 3.
MCE User’s Guide Figure 3 Selecting the data file and pre-processing Effect of the baselines 3.2 Decreasing the computing time and file sizes If you do not calculate estimates at all the time points, you can decrease the computing time and save disk space. If you low-pass filter the data, the data will be smoother and it is unnecessary to calculate the estimate at each time point.
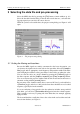
Selecting the data file and pre-processing MCE User’s Guide Figure 4 If too strong down-sampling is applied, the aliasing is reflected in the preview window with the folding frequency response. Decrease the filter cutoff frequency or decimation. 3.3 Bad channels and projections If some of the channels are flat or bad, you must set the [Bad channels] toggle and write the channel names to the corresponding text field. The format can be “MEG 1112 1113 ...” or “MEG 1112 MEG 1113 ...
MCE User’s Guide Selecting the data file and pre-processing In practice, you should first specify the baseline period and then press the [Automatic] button, and then add bad channels that are not included. Because the selection of the bad channels slightly affects the projections and the projections affect the selection of the noisy channels, resetting the projections repeatedly may result in different channels being marked bad at the second time, if their noise levels are near the limits.
Selecting the head model MCE User’s Guide 4 Selecting the head model You can select the head model by pressing the [Head model] button in the Main window (p. 22). The head model consists of two parts: the boundary element model (BEM) (p. 8) describes the shape of the brain and the point set (p. 9) describes the parameters needed in the calculation. First, the BEM model selection window opens up. 4.
MCE User’s Guide Selecting the head model 4.2 Point set selection Figure 6 Point set selection dialog The point set includes the brain locations that are used as a source space in the calculations and the parameters of the conductor model used in the forward calculations. Each point set is related with a certain BEM model (p. 8) and a certain subject. From the Point set dialog you can select an existing set from the list and accept it by pressing the [OK] button.
Selecting the head model Table 1 MCE User’s Guide Properties of the point sets Origin: xyz Sphere model origin (in mm; head coordinates) Lattice The density of the points in the point set (in mm) Min dist The minimum distance to the sphere model origin (in mm). Points deeper than this are excluded from the point set. Very deep source points may lead to numerical instability in the calculations. Comment The comment seen in the list Points The number of possible source points 4.
MCE User’s Guide Calculating the estimates 5 Calculating the estimates Before viewing the results you have to calculate the current estimates for the epoch. You should have already selected the MEG data, pre-processed it, and selected the head model (see chapters “Selecting the data file and pre-processing” on page 4 and “Selecting the head model” on page 8).
Loading a calculated estimate MCE User’s Guide 6 Loading a calculated estimate If you have previously calculated (p. 11) an estimate and saved it to a disk file, you can load it by pressing the [Full] button in the Main window (p. 22) to open the full calculation dialog (p. 27). If you have selected the right fif-file and have previously saved the corresponding estimate with the default name, the default values in the dialog should be set to load the estimate.
MCE User’s Guide Selecting the time 7 Selecting the time You can select a single time point in three ways: • By entering the time (in ms) in the [Time] field in the Main window (p. 22). • By using the slider in the Main window (p. 22). • By pressing the left mouse button in the Amplitude window (p. 31), if a batch calculation is loaded. However, because the single estimates are usually noisy, it is usually more fruitful to view the average activity within a time range.
Region of interest MCE User’s Guide 8 Region of interest You can estimate the activity in certain brain area as a function of time by defining a region of interest (ROI). ROI is actually a weighting function that is used to calculate the sum amplitude from the estimate. 8.1 What is ROI? The smoothed weighting is a function of position r, having form f (r) = e T –r W r but you don't need to be interested in matrix calculation to understand how the ROIs work. The ROI window (p.
MCE User’s Guide Region of interest 8.3 Selecting a ROI You can select a ROI from the Color display (p. 29). Select a range of nodes with the right mouse button. The program will find the active source points that are contributing to the selected activity and calculate the ROI center and extent. The orientation of the ROI will be the mean orientation of selected currents. After selecting a new ROI, activity weighted with it is shown in the ROI window (p.
Predicting MEG waveforms MCE User’s Guide 9 Predicting MEG waveforms Figure 7 Predicted fields shown with XPlotter. The original measurement is shown with yellow lines and the waveforms predicted with the activity of the selected ROI is shown with red lines. To find out, what part of the measured data is explained with the activity in the selected ROI, you can press the [Show predicted fields] command in the [Options] menu of the Amplitude window (p. 31).
MCE User’s Guide Printing 10 Printing You can print the displays or save them as images by using the printing dialog, or with UNIX command /neuro/mce/bin/xgifdump 10.1 Printing from the dialog Figure 8 The printing dialog The [Print] command in the File menu (p. 21) opens the printing dialog. Select the correct paper type and orientation, select the correct printer by typing -Pprintername -dpsc2 in the [Device option] field and press the [Print] button. 10.
Printing MCE User’s Guide The EPS formats suit well the Arrow (p. 30), Amplitude (p. 31), and Region of interest (p. 34) windows. In the conversion of the color displays (Color display (p. 29), Color scale (p. 33)) some errors may occur; the JPEG or PNG formats are more suitable for them. 10.3 Saving with xgifdump command The images can be saved in GIF format by giving the command /neuro/mce/bin/xgifdump in an UNIX terminal window.
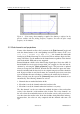
MCE User’s Guide Creating HTML documents and MPEG movies 11 Creating HTML documents and MPEG movies 11.1 Creating HTML documents Figure 9 An example of a created HTML document You can create HTML documents with the HTML document creation dialog (p. 38). The document will include projected, color coded views of the estimate from selected orientations and different time periods.
Creating HTML documents and MPEG movies Table 2 movies MCE User’s Guide Default viewing orientations for created HTML documents MPEG Orientation Horizontal rotation Elevation left -90 0 right 90 0 back 0 0 top 0 90 bottom 0 -90 front 180 0 upleft -90 30 upright 90 30 leftback -45 30 rightback 45 30 11.2 Creating movies You can create MPEG movies with the Movie creation dialog (p. 39).
MCE User’s Guide MCE windows and dialogs 12 MCE windows and dialogs 12.1 Window menus Figure 10 Menus of the Main Window (p. 22) File Create HTML ... Opens the HTML creation dialog (p. 38) Create movie ... Opens the HTML creation dialog (p. 39) Print... Opens the print dialog (see Printing (p.
MCE windows and dialogs MCE User’s Guide 12.2 Main window Figure 11 The main window The main window is opened when the program starts, and closing it quits the program. Table 3 Controls in the Main window [File] Select the name of the fif-file containing the response. Shows the name of the selected file. If a batch calculation is loaded, has the text (full) behind the file name. [Head model] Select the head model (p. 8). Shows the currently selected BEM (p. 8) and point set (p. 9).
MCE User’s Guide MCE windows and dialogs Figure 12 Minimum norm estimate options dialog The [Regularization] slider and text field select and show the number of singular values of the data used in the estimate. If the noise level in the measurement is low, increase the value to correctly estimate more complex source distributions. If the noise level is high, decrease its effect by decreasing the value. The default value (30) is usually reasonable for averaged evoked responses.
MCE windows and dialogs MCE User’s Guide Figure 13 The pre-processing dialog The left side of the window shows controls that you can use to pre-process the data. With the filter frame you can low-pass filter the data, with the baseline frame you can compensate for the DC level and slow drifts. With the projection frame you can down-sample the data and select the interesting period for the calculation. and set bad channels and noise projection.
MCE User’s Guide Table 4 NM20600A-A MCE windows and dialogs Controls in the Pre-processing dialog Filter frame The [Lowpass filter] toggle selects the filter. You can select the cutoff frequency or transition width with the corresponding text fields or sliders.The values are in Hz. Use the [Freq. response] and [Impulse response] buttons to see the effect of the filter.
MCE windows and dialogs MCE User’s Guide 12.4 MEG data dialog The MEG data dialog is opened with the [Show all] button of the Pre-processing dialog (p. 23). It shows waveforms of all the channels overlaid based location. Left-clicking zooms in the image, right-clicking shows the maximum amplitude and channel in the selected time and location. The commands in the [Options] menu (p. 26) can be used to set the scale and layout.
MCE User’s Guide MCE windows and dialogs 12.5 Full calculation dialog Figure 14 The full calculation dialog The full calculation dialog is opened by pressing the [Full] button in the Main window (p. 22). This window is used to calculate (p. 11) or load (p. 12) the minimum norm estimates of a whole response. The calculation of a new estimate will take will take some time, typically a second or two for each time point in the response.
MCE windows and dialogs MCE User’s Guide 12.6 Batch jobs window Figure 15 The batch jobs window This window controls the calculation of the estimates. The list shows current batch jobs and their states. The preferred way to start a calculating all the jobs, press the [Start server] button. This will be done in the background and you can use the program to add new jobs or view the results, or even log out and free the terminal for others. You can update the list by clicking it with mouse button.
MCE User’s Guide MCE windows and dialogs 12.7 Color display Figure 16 Color display of the estimate The color display is opened by selecting [Color display] in the Windows menu (p. 21). The color display shows the estimated source distribution projected to the surface of the brain. The projection is done along the radius of the sphere model. If a time period is selected, the average activity during the period is shown. You can rotate the image by moving the mouse while holding down the left button.
MCE windows and dialogs MCE User’s Guide 12.8 Arrow display Figure 17 Arrow display of the estimate The arrow display is opened by selecting [Arrow display] in the Windows menu (p. 21). The arrow display shows the 3-dimensional estimated source locations and orientations. If a time period is selected, the average activity during the period is shown.
MCE User’s Guide MCE windows and dialogs 12.9 Amplitude window Figure 18 The amplitude window with total activity Figure 19 The amplitude window with an oriented ROI The amplitude window is opened by selecting [Amplitude] in the Windows menu (p. 21).
MCE windows and dialogs MCE User’s Guide The amplitude window shows the activity of the selected ROI (p. 14) during the whole response. You can also use it to select a time point or time range (p. 13). To select a time point, use the left mouse button. To select a time range, drag with the right mouse button. The text box shows the selected ROI, time range and the average amplitude during the time range.
MCE User’s Guide MCE windows and dialogs 12.11 Color scale window Figure 21 The color scale window The color scale window is opened by selecting [Color scale] in the Windows menu (p. 21). You can adjust the color scale of the Color display (p. 29) using the color scale window. Constant color mode By pressing the [Constant] button you can select the constant color scale, where the colors a selected according the absolute value of the estimate. The maximum in nAm can be entered in the field.
MCE windows and dialogs MCE User’s Guide Things to remember Remember that the Arrow display (p. 30) has different color scale and check that you are using the same color map (p. 21) in different windows. Remember also, that because the estimation method tries to minimize the current, the absolute scale of the estimate is very likely smaller than that of the real current. However, the relative strengths at different time points or measurements should be reasonable. 12.
MCE User’s Guide MCE windows and dialogs 12.13 ROI database window Figure 23 The ROI database The ROI database window is opened by selecting [ROI database] in the Windows menu (p. 21). The ROI database window is your contains your interface to the database of previously selected brain areas, ROIs (p. 14). The controls to search ROIs is in the upper left corner. The list of found ROIs is on the right side. The currently selected ROI is shown on the lower left side.
MCE windows and dialogs MCE User’s Guide ROI search Table 8 Controls in the upper left corner [Show other files] Press this button if you want to see the ROIs from different measurements [Show other point sets] Press this button if you want to see the ROIs from different subjects having different point sets [Show other users] Press this button if you want to see the ROIs created by your colleagues [SQL query field] On this field you can have write constraints in using SQL language (p.
MCE User’s Guide MCE windows and dialogs Current ROI Table 9 Controls in the lower left corner [Center] The center of the ROI in millimeters. The values can not be changed unless [Modify] button is pressed. [Extent] The extent of the ROI in millimeters. Only the extents along the X, Y, and Z coordinate axes are shown, although the ROI selected from the Color display (p. 29) can be oblique. The values can not be changed unless [Modify] button is pressed. [Orientation] The orientation of the ROI (p.
MCE windows and dialogs MCE User’s Guide [Options] menu The selected ROI can be exported to a file with the [Export new file] button. The [Append] button adds the selected ellipsoid to the previously selected output file. 12.14 HTML Creation Dialog Figure 24 The HTML Creation Dialog You can open the HTML Creation Dialog from the [File] menu. After selecting appropriate parameters, press OK. The application closes the open files and creates the HTML file.
MCE User’s Guide Table 11 MCE windows and dialogs Controls in the HTML Creation Dialog [File] Select the output file name. The PNG picture files will be created with the same prefix and different suffixes. [Time periods] Select the time periods either with format beginning:length:end or [beginning first second ...
MCE windows and dialogs MCE User’s Guide You can open the Movie Creation Dialog from the [File] menu. Table 12 40 Controls in the Movie Creation Dialog [File] Select the output file name [Time points] Select the time points with format begin:skip:end For example, for a movie from 100 to 300 ms with 10 ms step between frames, select 100:10:300 [Window length] The length of time period integrated for each frame in the movie [Orientations] Select the orientation of the brain in the movie.
MCE User’s Guide Index A Adobe Illustrator 17 amplitude 14, 31 negative 14 animation 22 B background calculation 11 server 28 bad channels 6, 7, 25 automatic setting 6, 25 baseline 4, 25 color scale 33 detrend 4 batch jobs 11, 28 BEM.
MCE User’s Guide Q X quitting 3 xgifdump 18 XPlotter 16 R references 2 region of interest 14, 34 center 37 database 15, 35 definition 14 exporting 15, 38 extent 37 hard 14 orientation 14 selecting 15, 29 smooth 14 regularization 23 ROI.