
User`s guide

CARROLL TOUCH Chapter 7 - Debug
Touch System Diagnostics (CTDIAG) User’s Guide 7-5
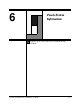
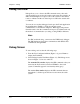
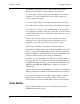
To make a copy of the buffer and display it in the Trace Buffer screen
(Figure 7-3), press F4. While you are viewing the copy of the trace
buffer, CTDIAG continues to record any new communication in the
trace buffer. This new communication will not appear in the Trace
Buffer screen currently on display, since the screen is merely a static
copy of the actual buffer. The new communication will, however,
appear in the receive window when you return to the Debug screen and
will be in the Trace Buffer the next time you request a copy of it.
Figure 7-3. Trace Buffer Screen
When the buffer is full, it is emptied on a first in, first out (FIFO) basis.
To clear the buffer any time you are in Debug, press F5. You may save
a copy of the buffer to a file by typing S and specifying a file name.
Debugging under the Smart-Frame Protocol
This section describes debugging under the SFP and gives all examples
in hexadecimal.
Commands
To issue a command under the Smart-Frame Protocol, simply type its
function number. An SFP command example is 32, the hexadecimal
code for the
Get_Error_Report
command.