Instruction Manual 51-54eA/rev.
ESSENTIAL INSTRUCTIONS READ THIS PAGE BEFORE PROCEEDING! Rosemount Analytical designs, manufactures, and tests its products to meet many national and international standards. Because these instruments are sophisticated technical products, you must properly install, use, and maintain them to ensure they continue to operate within their normal specifications.
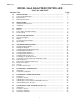
MODEL 54eA TABLE OF CONTENTS MODEL 54eA ANALYZER/CONTROLLER TABLE OF CONTENTS Section Title Page 1.0 1.1 1.2 1.3 SPECIFICATIONS................................................................................................... Features and Applications ....................................................................................... Specifications........................................................................................................... Ordering Information........................
MODEL 54eA TABLE OF CONTENTS TABLE OF CONTENTS (CONTINUED) Section Title Page 9.0 9.1 9.2 9.3 9.4 CALIBRATION - FREE CHLORINE (498 ACL-01) ................................................ Introduction.............................................................................................................. Zeroing the Sensor.................................................................................................. Full Scale Calibration........................................................
MODEL 54eA TABLE OF CONTENTS LIST OF FIGURES Section 2-1 2-2 2-3 2-4 2-5 3-1 3-2 3-3 3-4 3-5 3-6 3-7 3-8 3-9 3-10 3-11 4-1 4-2 5-1 5-2 5-3 5-4 7-1 8-1 8-2 9-1 9-2 9-3 10-1 11-1 12-1 14-1 14-2 15-1 15-2 15-3 15-4 15-5 15-6 Title Wall Mounting.......................................................................................................... Pipe Mounting.......................................................................................................... Pipe and Wall Mounting Dimensions........
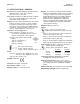
MODEL 54eA SECTION 1.0 SPECIFICATIONS SECTION 1.0 SPECIFICATIONS 1.1 FEATURES AND APPLICATIONS The Model 54eA Analyzer/Controller with the appropriate sensor monitors and controls dissolved oxygen (ppm and ppb level), free chlorine, total chlorine, and ozone in a variety of process liquids. The analyzer is compatible with Rosemount Analytical series 499A amperometric sensors for oxygen, chlorine, and ozone; and with Hx438 and Gx448 steam sterilizable oxygen sensors.
MODEL 54eA SECTION 1.0 SPECIFICATIONS 1.2 SPECIFICATIONS - GENERAL Enclosure: Epoxy-painted (light gray) cast aluminum, NEMA4X (IP65). 144 x 144 x 132 mm (5.7 x 5.7 x 5.2 in.), DIN size. Front Panel: Membrane keypad with tactile feedback. Three green LEDs indicate alarm status. Red LED indicates fault condition. Display: Three-line, back-lit, dot matrix LCD, 70 x 35 mm. First line is oxygen, chlorine, or ozone reading. Second line is temperature and current output. Third line is user-selectable.
MODEL 54eA SECTION 1.0 SPECIFICATIONS SPECIFICATIONS — OXYGEN RECOMMENDED pH SENSORS: Measurement Range: 0-99 ppm (mg/L), 0-200% saturation Resolution: 0.01 ppm, 0.
MODEL 54eA SECTION 1.0 SPECIFICATIONS 1.3 ORDERING INFORMATION The Model 54eA Microprocessor Analyzer measures dissolved oxygen, free chlorine, total chlorine, ozone, and pH. pH is available for free chlorine only. The analyzer has an on-board pressure sensor for automatic air calibration of oxygen sensors. Amperometric measurements are fully compensated for changes in membrane permeability with temperature. Free chlorine is corrected for pH.
MODEL 54eA SECTION 2.0 INSTALLATION SECTION 2.0 INSTALLATION 2.1 UNPACKING AND INSPECTION Inspect the shipping container. If it is damaged, contact the shipper immediately for instructions. Save the box. If there is no apparent damage, unpack the container. Be sure all items shown on the packing list are present. If items are missing, notify Rosemount Analytical immediately. 2.2 INSTALLATION 2.2.1 General information 1.
MODEL 54eA SECTION 2.0 INSTALLATION 2.2.3 Pipe mounting FIGURE 2-2. Pipe Mounting WHEN INCH AND METRIC DIMS ARE GIVEN MILLIMETER INCH 9.52 .375 FRONT VIEW SIDE VIEW DWG. NO. REV. 40005402 PIPE MOUNTING PN 2002577 WALL MOUNTING FIGURE 2-3.
MODEL 54eA SECTION 2.0 INSTALLATION 2.2.4 Panel mounting FIGURE 2-4. Panel Mounting 144 5.7 WHEN INCH AND METRIC DIMS ARE GIVEN 139.7 5.5 28.72 1.17 MILLIMETER INCH SIDE VIEW 144 5.7 PANEL MOUNTING BRACKET WITH BOLTS, WASHERS AND SCREWS. 2 PLACES FRONT VIEW PANEL SUPPLIED BY OTHERS BOTTOM VIEW 139.7 5.5 33 1.3 40005401 D 1.52 RADIUS MAX .06 4 PLACES 137.9 5.43 50.8 2 REV. 68.96 2.715 68.96 2.715 35 1.38 DWG. NO. PANEL FLUSH TO BEZEL 137.9 5.43 66 2.6 155.7 6.
MODEL 54eA SECTION 3.0 WIRING SECTION 3.0 WIRING NOTE The Model 54eA analyzer leaves the factory configured for use with the Model 499ADO sensor (ppm dissolved oxygen). If a 499ADO sensor is NOT being used, turn to Section 5.5 and configure the transmitter for the desired measurement (ppb oxygen, oxygen measured using a steam-sterilizable sensor, free chlorine, total chlorine, monochloramine, or ozone) before wiring the sensor to the analyzer.
MODEL 54eA SECTION 3.0 WIRING DWG. NO. 454EPH02 REV. D FIGURE 3-1.
MODEL 54eA SECTION 3.0 WIRING NOTE The Model 54eA analyzer leaves the factory configured for use with the Model 499ADO sensor (ppm dissolved oxygen). If a 499ADO sensor is not being used, turn to Section 5.5 and configure the analyzer for the desired measurement (ppb oxygen, oxygen measured using a steamsterilizable sensor, free chlorine, total chlorine, monochloramine, or ozone) before wiring the sensor to the analyzer.
MODEL 54eA SECTION 3.0 WIRING 3.3.3 Wiring 499ACL-01 (free chlorine) sensors and pH sensors for automatic pH correction. If free chlorine is being measured using the 499ACL-01 sensor and the pH of the liquid varies more than 0.2 pH unit, a continuous correction for pH must be applied to the chlorine reading. Therefore, a pH sensor must also be wired to the 54eA controller. This section gives wiring diagrams for the pH sensors typically used.
MODEL 54eA SECTION 3.0 WIRING DWG. NO. 4054eA05 REV. A Although the blue wire is connected to a terminal labeled solution ground, the blue wire does not connect to a solution ground in the sensor. The 399-14 sensor has no solution ground. The blue wire, instead, ties the preamplifier in the sensor to instrument common. FIGURE 3-6. 499ACL-01 sensor with standard cable and 399-14 pH sensor having internal preamplifier. DWG. NO. 4054eA03 FIGURE 3-7.
MODEL 54eA SECTION 3.0 WIRING DWG. NO. 4054eA02 REV. B FIGURE 3-8. 499ACL-01 sensor with optimum EMI/RFI cable or Variopol cable and 399VP-09 pH sensor without internal preamplifier. DWG. NO. 4054eA06 REV. A Although the blue wire is connected to a terminal labeled solution ground, the blue wire does not connect to a solution ground in the sensor. The 399-14 sensor has no solution ground. The blue wire, instead, ties the preamplifier in the sensor to instrument common. FIGURE 3-9.
MODEL 54eA SECTION 3.0 WIRING DWG. NO. 4054eA04 FIGURE 3-10. 499CL-01 sensor with optimum EMI/RFI cable or Variopol cable and 399-09-62 pH sensor without internal preamplifier. 3.3.4 Wiring 438ACL-01 (pH independent free chlorine) sensors FIGURE 3-11. 498CL-01 (pH-independent free chlorine) sensor 14 REV.
MODEL 54eA SECTION 3.0 WIRING Insulate and tape back unused wires. 3.3.5 Wiring Hx438 and Gx448 sensors Hx438 and Gx448 steam-sterilizable dissolved oxygen sensors use a 22k NTC thermistor. The thermistor is wired to terminals 1 and 3 on TB5. DWG. NO. 4054eA07 REV. A FIGURE 3-12. Hx438 and Gx448 sensors.
MODEL 54eA SECTION 4.0 DISPLAY AND OPERATION SECTION 4.0 DISPLAY AND OPERATION 4.1 GENERAL DESCRIPTION 4.3 KEY FUNCTIONS AND CONTROLS The 54eA analyzer/controller is a normally a single input, dual output instrument. It does, however, accept a second input for pH when the main measurement is free chlorine. Figure 4-1 shows how the instrument inputs and outputs can be configured for free chlorine. The keys labeled F1, F2, F3, and F4 are multi-function.
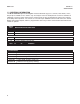
MODEL 54eA SECTION 5.0 SOFTWARE CONFIGURATION SECTION 5.0 SOFTWARE CONFIGURATION The instrument is configured at the factory to measure oxygen. Figure 5-1 is an outline of the menu structure. Table 5-1 lists the default settings and the range of choices available for each setting. To reduce the chance of error when configuring the controller the first time, enter settings in the order shown in the table. TABLE 5-1. Program Settings List ITEM SETPOINTS A. Alarms (Section 5.1) 1. Alarm 1 (low action) a.
MODEL 54eA SECTION 5.0 SOFTWARE CONFIGURATION TABLE 5-1. Program Settings List (continued) ITEM CHOICES FACTORY SETTINGS CONFIGURE A. Display options (Section 5.5) 1. Measurement Oxygen, ozone, free chlorine, total chlorine, monochloramine Oxygen 2. Sensor (Oxygen only) Rosemount standard, Rosemount biopharm, or Rosemount standard other steam sterilizable 3. Units (Oxygen only) ppm, ppb, % saturation ppm 4. Temperature units °C or °F °C 5. Output 1 mA or % of full scale mA 6.
MODEL 54eA SECTION 5.0 SOFTWARE CONFIGURATION TABLE 5-1. Program Settings List (continued) ITEM CHOICES FACTORY SETTINGS CONFIGURE (continued) C. Alarms (Section 5.7) (continued) 3. Alarm 1 setup (TPC) a. Setpoint if oxygen (ppm) -20 to 20 ppm 1 ppm if oxygen (ppb) -999 to 999 ppb 100 ppb if oxygen (% saturation) 0 to 200% 100% if chlorine, monochloramine, or ozone -9999 to 9999 ppm 1.0 ppm if pH -2.0 to 20.00 7.00 if temperature -5 to 130°C 25°C b. Proportional 0 to 299.9% 100 % c.
MODEL 54eA SECTION 5.0 SOFTWARE CONFIGURATION TABLE 5-1. Program Settings List (continued) ITEM CHOICES CONFIGURE (continued) D. pH measurement (Section 5.8) 1. pH sensor Enable or disable 2. pH compensation (free chlorine only) Auto or manual 3. pH value 0.00 - 14.00 4. pH diagnostic On or off a. Glass impedance high 0-2000 MΩ (0 disables) b. Glass impedance low 0-900 MΩ (0 disables) c. Reference impedance high 0-140 kΩ (0 disables) d. Zero offset 0-999 mV e. Impedance temp. compensation On or off 5.
MODEL 54eA SECTION 5.0 SOFTWARE CONFIGURATION FIGURE 5-1.
MODEL 54eA SECTION 5.0 SOFTWARE CONFIGURATION FIGURE 5-1. Menu Tree for the 54eA Controller (continued) Calibrate (see page 21) Main Menu Diagnostic Variable (see page 21) Program Alarm Setpoints Alarms 1, 2, and 3 setpoints Output setpoints 4 mA or 0 mA 20 mA Present output current Simulated tests Test output 1 or 2 Test alarm 1, 2, 3, or 4 Configure Display Main Sensor Sensor type and manufac.
MODEL 54eA SECTION 5.0 SOFTWARE CONFIGURATION FIGURE 5-1.
MODEL 54eA SECTION 5.0 SOFTWARE CONFIGURATION 5.1 CHANGING ALARM SETPOINTS 1. Before changing alarm setpoints, be sure that alarms are properly configured. See Section 5.7. 2. Press any key to enter the main menu. Move the cursor to "Program" and press Enter (F4). Alarm setpoints Output setpoints Simulate tests Exit 3. Press Enter (F4). Enter 4. Move the cursor to the desired alarm and press Enter (F4). Alarm 1 setpoint Alarm 2 setpoint Alarm 3 setpoint Exit Enter Alarm Low : 0.
MODEL 54eA SECTION 5.0 SOFTWARE CONFIGURATION 5.2 RANGING THE OUTPUTS 1. Ranging the outputs means assigning values to the low (0 or 4 mA) and high (20 mA) outputs. Before ranging the outputs, be sure the outputs are properly configured. See Section 5.6. 2. Press any key to enter the main menu. Move the cursor to "Program" and press Enter (F4). 3. Move the cursor to "Output setpoints" and press Enter (F4).
MODEL 54eA SECTION 5.0 SOFTWARE CONFIGURATION 5.3 CHANGING OUTPUT SETPOINTS (PID ONLY) 1. This section describes how to assign the setpoint and the upper and lower range values (URV and LRV) when the 54eA is being used for PID control. Assign the LRV to 4 mA and the URV to 20 mA. The LRV is the deviation from the setpoint that will result in a 4 mA output. The URV is the deviation from the setpoint that will result in a 20 mA output. Example: The setpoint is 1.00 ppm. The URV is +0.50 and the LRV is 0.00.
MODEL 54eA SECTION 5.0 SOFTWARE CONFIGURATION 5.4 TESTING OUTPUTS AND ALARMS 1. For testing purposes, the controller can be programmed to generate simulated outputs and to activate and deactivate alarms. 2. Press any key to enter the main menu. Move the cursor to "Program" and press Enter (F4). 3. Move the cursor to "Simulated tests" and press Enter (F4). Output setpoints Simulated tests Configure Exit Enter 4. Move the cursor to the desired output or alarm.
MODEL 54eA SECTION 5.0 SOFTWARE CONFIGURATION 5.5 CHOOSING DISPLAY OPTIONS 1. The 54eA controller can be used with most amperometric sensors manufactured by Rosemount Analytical. The user must configure the analyzer to match the sensor being used. 2. The display menu also lets the user customize the third line in the display, change timeout values, choose a language other than English, and change the display contrast. 3. Press any key to enter the main menu.
MODEL 54eA SECTION 5.0 SOFTWARE CONFIGURATION 5.5 CHOOSING DISPLAY OPTIONS (CONTINUED) 8. Set the remainder of the display parameters. Use the é and ê keys to choose the desired parameter. Then press Edit (F4). Use the é key to move the cursor to the desired selection. Press Save (F4) to store.
MODEL 54eA SECTION 5.0 SOFTWARE CONFIGURATION 5.6 CHANGING OUTPUT PARAMETERS 1. This section describes how to configure the controller outputs. Outputs can be configured to represent the main amperometric measurement (oxygen, ozone, free chlorine, or total chlorine), temperature, or pH (if free chlorine is being measured and pH was enabled). 2. The output can be configured as either a normal or PID output. Normal means the output current is directly proportional to the measurement assigned to the output.
MODEL 54eA SECTION 5.0 SOFTWARE CONFIGURATION 5.6 CHANGING OUTPUT PARAMETERS (continued) e. The display returns to the “Output: Process” screen. Press Exit (F1). The display returns to the “Output Measurement” screen. Move the cursor to "Control mode" and press Enter (F4). Ctrl mode : Normal f. Exit Edit 8. Output setup for normal outputs: Output 1 Control Output 1 Setup Output 2 Control Exit a. Move the cursor to the desired output setup and press Enter (F4). Enter b.
MODEL 54eA SECTION 5.0 SOFTWARE CONFIGURATION 5.6 CHANGING OUTPUT PARAMETERS (continued) Proportional: Proportional is the same as proportional band and is the range over which control is being used. It is the opposite of process gain. Smaller values provide tighter control. Integral: Integral is the number of seconds over which deviations from the setpoint are integrated to remove continuing offsets. Smaller values provide higher response.
MODEL 54eA SECTION 5.0 SOFTWARE CONFIGURATION 5.7 CHANGING ALARM PARAMETERS 1. This section describes how to configure the controller alarms. Alarms 1, 2, and 3 can be assigned to the main amperometric measurement (oxygen, ozone, free chlorine, or total chlorine), temperature, or pH (if pH was enabled). In addition, alarm 1, 2, or 3 can be configured as a feed limit timer or as an interval timer (see steps 10 and 11). Alarm 4 is always a fault alarm. 2.
MODEL 54eA SECTION 5.0 SOFTWARE CONFIGURATION 5.7 CHANGING ALARM PARAMETERS (continued) c. Activate : Process Exit Edit d. The display returns to the "Activate: Process" screen. Press Exit (F1). The display returns to the "Activation method" screen. Move the cursor to "Control mode" and press Enter (F4). Activation method Control mode Exit Enter e. To change the control mode, press Edit (F4). Use the é key to toggle between "Normal" and "TPC". Press Save (F4) to store the selection.
MODEL 54eA SECTION 5.0 SOFTWARE CONFIGURATION 5.7 CHANGING ALARM PARAMETERS (continued) FIGURE 5-2. Low Alarm FIGURE 5-3. High Alarm 9. Alarm setup for TPC alarms: a. Move the cursor to the desired alarm setup and press Enter (F4). Alarm 1 control Alarm 1 setup Alarm 2 control Exit Enter Setpoint : 1.000 ppm Proportional: 100.0% Integral: 0 sec Exit Edit b. Use the é and ê keys to move the cursor to the desired parameter. Press Edit (F4).
MODEL 54eA SECTION 5.0 SOFTWARE CONFIGURATION 5.7 CHANGING ALARM PARAMETERS (continued) Example: The setpoint is 3.00 ppm. The URV is +5.00 ppm and the LRV is 0.00 ppm. The time period is 30 seconds. When the concentration is 4.00 ppm, the relay will be on (4-3)/(5-0) = 20% of the time or 6 seconds. Relay default: Relay default determines how the relay will act if there is a fault or hold condition. The choices are on (relay closed), off (relay open), or none (relay remains unchanged).
MODEL 54eA SECTION 5.0 SOFTWARE CONFIGURATION 5.7 CHANGING ALARM PARAMETERS (continued) 11. Interval timer setup: Alarm 1, 2, or 3 can be used as an interval timer. The selected relay will open and close at time intervals programmed by the user. The interval timer is useful for automatic cleaning of sensors. NOTE The alarm relay used for the interval timer cannot be used for other purposes.
MODEL 54eA SECTION 5.0 SOFTWARE CONFIGURATION 5.8 CONFIGURING THE pH MEASUREMENT NOTE pH is available only if the Model 54eA controller was configured to measure free chlorine using the 499ACL-01 sensor. 1. Press any key to enter the main menu. Move the cursor to "Program" and press Enter (F4). 2. Move the cursor to "Configure" and press Enter (F4). 3. Move the cursor to “pH” and press Enter (F4). Alarms pH Temperature Exit Enter 4. The default settings are “pH sensor: Enable” and “pH comp: Auto.
MODEL 54eA SECTION 5.0 SOFTWARE CONFIGURATION 5.8 CONFIGURING THE pH MEASUREMENT (continued) key to change "Off" to "On". Press Save (F4). Diagnostics : Off Glass imp hi: 1000 MΩ Glass imp lo: 20 MΩ Exit NOTE Choosing "On" means the controller will display pH diagnostic warning messages and fault alarms. Choosing "Off" means the messages and fault alarms will not be displayed. Diagnostic variables will still be measured and can be viewed under the Diagnostics menu. Edit c.
MODEL 54eA SECTION 5.0 SOFTWARE CONFIGURATION 5.8 CONFIGURING THE pH MEASUREMENT (continued) Stabilize pH and Stabilize time: For the controller to accept calibration data, the pH must remain within a specified range for a specified period of time. The default values are 0.01 pH for 10 seconds. Using a small pH value and a large time provides the best protection against calibration while the reading is still changing. 8. In many industries pH is used and reported at a reference temperature of 25°C.
MODEL 54eA SECTION 5.0 SOFTWARE CONFIGURATION 5.9 TEMPERATURE COMPENSATION AND TEMPERATURE UNITS 1. Refer to Section 6.1 for a discussion of the ways in which temperature affects amperometric and pH measurements. 2. Press any key to enter the main menu. Move the cursor to "Program" and press Enter (F4). 3. Move the cursor to "Configure" and press Enter (F4). 4. Move the cursor to "Temperature" and press Enter (F4). pH Temperature Noise rejection Exit Enter 5.
MODEL 54eA SECTION 5.0 SOFTWARE CONFIGURATION 5.10 NOISE REDUCTION 1. For maximum noise reduction the frequency of the ac power must be entered into the analyzer. 2. Press any key to enter the main menu. Move the cursor to "Program" and press Enter (F4). 3. Move the cursor to "Configure" and press Enter (F4). 4. Move the cursor to "Noise rejection" and press Enter (F4). Temperature Noise rejection Main sensor cal Exit Enter Noise rejection : 60 Hz Exit 42 Edit 5.
MODEL 54eA SECTION 5.0 SOFTWARE CONFIGURATION 5.11 MAIN SENSOR CALIBRATION PARAMETERS 1. Main sensor refers to the amperometric sensor. 2. Press any key to enter the main menu. Move the cursor to "Program" and press Enter (F4). 3. Move the cursor to "Configure" and press Enter (F4). 4. Move the cursor to "Main sensor cal" and press Enter (F4). Noise rejection Main sensor cal Security Exit Enter 5. Use the é and ê keys to move through the list of items. To make a change press Edit (F4).
MODEL 54eA SECTION 5.0 SOFTWARE CONFIGURATION 5.12 BAROMETRIC PRESSURE 1. The barometric pressure menu header appears only if an oxygen sensor (ppm or ppb level) is being used. Barometric pressure is used during air calibration. 2. Press any key to enter the main menu. Move the cursor to "Program" and press Enter (F4). 3. Move the cursor to "Configure" and press Enter (F4). Noise rejection Barometric pressure Main sensor cal Exit Enter 5. Use the é and ê keys to move through the list of items.
MODEL 54eA SECTION 5.0 SOFTWARE CONFIGURATION 5.13 SECURITY 1. The controller can be programmed to require a password for access to menus. There are three levels: Level 1: A level 1 user can 1. Zero and calibrate the main (amperometric) sensor 2. Calibrate the barometric pressure sensor 3. Calibrate the pH sensor 4. Enter a temperature slope for a pH sensor 5. Change temperature compensation from automatic to manual and enter a manual compensation temperature 6. View diagnostic variables.
MODEL 54eA SECTION 5.0 SOFTWARE CONFIGURATION 5.14 CONTROLLER MODE PRIORITY The Model 54eA controller can function in different modes depending on both how it is configured, what process conditions exist, and actions an operator may have made. To reconcile these possible modes, there is a set priority that determines exactly what will happen to the two (2) current outputs and the four (4) alarm relays in the event of multiple modes occurring at the same time. See Table 5-2 below.
MODEL 54eA SECTION 6.0 CALIBRATION - TEMPERATURE SECTION 6.0 CALIBRATION - TEMPERATURE 6.1 INTRODUCTION All four amperometric sensors (oxygen, ozone, free chlorine, total chlorine, and monochloramine) are membranecovered sensors. As the sensor operates, the analyte (the substance to be determined) diffuses through the membrane and is consumed at an electrode immediately behind the membrane. The reaction produces a current that depends on the rate at which the analyte diffuses through the membrane.
MODEL 54eA SECTION 6.0 CALIBRATION - TEMPERATURE 6.2 TEMPERATURE CALIBRATION Place the sensor and a standard thermometer in the process liquid. 1. Check the controller temperature reading (main display) to make sure the sensor has stabilized. Compare the controller temperature with the standard thermometer. The readings should differ by at most 1°C. If the readings differ by a greater amount, refer to Section 15.3. Go to the next step if the reading requires adjustment. 2.
MODEL 54eA SECTION 7.0 CALIBRATION - DISSOLVED OXYGEN SECTION 7.0 CALIBRATION - DISSOLVED OXYGEN 7.1 INTRODUCTION As Figure 7-1 shows, oxygen sensors generate a current directly proportional to the concentration of dissolved oxygen in the sample. Calibrating the sensor requires exposing it to a solution containing no oxygen (zero standard) and to a solution containing a known amount of oxygen (full-scale standard).
MODEL 54eA SECTION 7.0 CALIBRATION - DISSOLVED OXYGEN 7.2 ZEROING THE SENSOR 1. Place the sensor in a fresh solution of 5% sodium sulfite (Na2SO3) in water. Be sure air bubbles are not trapped against the membrane. The current will drop rapidly at first and then gradually reach a stable zero value. To monitor the sensor current, go to the main display. Press any key to obtain the main menu. Press the ê key once to highlight “Diagnostic variables.” Press Enter (F4).
MODEL 54eA SECTION 7.0 CALIBRATION - DISSOLVED OXYGEN 7.3 CALIBRATING THE SENSOR IN AIR 1. Remove the sensor from the process liquid. Use a soft tissue and a stream of water from a wash bottle to clean the membrane. Blot dry. The membrane must be dry during air calibration. 2. Pour some water in a beaker and suspend the sensor with the membrane about 0.5 inch (1 cm) above the water surface. To avoid drift caused by temperature changes, keep the sensor out of the direct sun. 3.
MODEL 54eA SECTION 7.0 CALIBRATION - DISSOLVED OXYGEN 8. Press Exit (F1) four times to return to the main display. NOTE If Hold was activated during calibration, “Hold Mode Activated” will continue to flash in the main display. Return the sensor to normal and deactivate Hold. Refer to Section 5.6, step 11. 9. During calibration, the analyzer stores the measured current and calculates the sensitivity. Sensitivity is the sensor current in nA divided by the saturation concentration of oxygen in ppm.
MODEL 54eA SECTION 7.0 CALIBRATION - DISSOLVED OXYGEN 7.4 CALIBRATING THE SENSOR AGAINST A STANDARD INSTRUMENT The analyzer and sensor can be calibrated against a standard instrument. For oxygen sensors installed in aeration basins in waste treatment plants, calibration against a second instrument is often preferred. For an accurate calibration be sure that… 1. The standard instrument has been zeroed and calibrated against water-saturated air following the manufacturer's instructions. 2.
MODEL 54eA SECTION 7.0 CALIBRATION - DISSOLVED OXYGEN 7.5 CALIBRATING BAROMETRIC PRESSURE 1. If the barometric pressure measured by the controller does not agree with the local barometric pressure, calibrate the pressure sensor. A pressure error of 3 mm Hg introduces an error of about 0.5% in the final measurement. When calibrating the pressure reading, be sure to use the actual barometric pressure.
MODEL 54eA SECTION 8.0 CALIBRATION - FREE CHLORINE (499ACL-01) SECTION 8.0 CALIBRATION - FREE CHLORINE (499ACL-01) 8.1 INTRODUCTION This section covers the calibration of the 499ACL-01 free chlorine sensor. See section 9.0 for calibration of the 498CL-01 pH-independent free chlorine sensor. As Figure 8-1 shows, a free chlorine sensor generates a current directly proportional to the concentration of free chlorine in the sample.
MODEL 54eA SECTION 8.0 CALIBRATION - FREE CHLORINE (499ACL-01) 8.2 ZEROING THE SENSOR 1. Place the sensor in the zero standard (see Section 8.1). Be sure no air bubbles are trapped against the membrane. The sensor current will drop rapidly at first and then gradually reach a stable zero value. To monitor the sensor current, go to the main display. Press any key to obtain the main menu. Press the ê key once to highlight “Diagnostic variables.” Press Enter (F4).
MODEL 54eA SECTION 8.0 CALIBRATION - FREE CHLORINE (499ACL-01) 8.3 FULL SCALE CALIBRATION 1. Place the sensor in the process liquid. If automatic pH correction is being used, calibrate the pH sensor (see Section 11.0) and place it in the process liquid. If manual pH correction is being used, measure the pH of the process liquid and enter the value. See Section 5.8. Adjust the sample flow until it is within the range recommended for the chlorine sensor. Refer to the sensor instruction sheet. 2.
MODEL 54eA SECTION 8.0 CALIBRATION - FREE CHLORINE (499ACL-01) 8.4 DUAL SLOPE CALIBRATION Figure 8-2 shows the principle of dual slope calibration. Between zero and concentration C1, the sensor response is linear. When the concentration of chlorine becomes greater than C1, the response is non-linear. In spite of the non-linearity, the response can be approximated by a straight line between point 1 and point 2. Dual slope calibration is rarely needed. It is probably useful in fewer than 5% of applications.
MODEL 54eA SECTION 8.0 CALIBRATION - FREE CHLORINE (499 ACL-01+3.) 7. Once the reading is stable, the screen at left appears. 2.000 ppm Low point : 2.000 ppm Exit High Sample the process liquid. Make a note of the reading before taking the sample. Immediately determine free chlorine. Note the controller reading again.
MODEL 54eA SECTION 9.0 CALIBRATION - FREE CHLORINE (498CL-01) SECTION 9.0 CALIBRATION - FREE CHLORINE (498CL-01) 9.1 INTRODUCTION This section covers the calibration of the 498CL-01 pH-independent free chlorine sensor only. See section 8.0 for calibration of the 499ACL-01 sensor. As Figure 9-1 shows, a free chlorine sensor generates a current directly proportional to the concentration of free chlorine in the sample.
MODEL 54eA SECTION 9.0 CALIBRATION - FREE CHLORINE (498CL-01) 9.2 ZEROING THE SENSOR 1. BEFORE ZEROING THE SENSOR, PLACE IT IN THE FLOW CELL AND ALLOW THE SENSOR TO OPERATE IN A FLOWING CHLORINATED SAMPLE FOR AT LEAST TWO HOURS. 2. After two hours, remove the sensor from the flow cell and place it in the zero standard. See Section 9.1 for suggested zero standards. Be sure no air bubbles are trapped against the membrane.
MODEL 54eA SECTION 9.0 CALIBRATION - FREE CHLORINE (498CL-01) 9.3 FULL SCALE CALIBRATION 1. Place the sensor in the process liquid. Be sure the controller has been programmed for manual pH correction and the pH is 7.00. Adjust the sample flow until it is in the range recommended for the sensor. Refer to the sensor instructions sheet. 2. Adjust the chlorine concentration until it is near the upper end of the control range. Wait until the controller reading is stable before starting the calibration.
MODEL 54eA SECTION 9.0 CALIBRATION - FREE CHLORINE (498CL-01) 9.4 DUAL SLOPE CALIBRATION Figure 9-2 shows the principle of dual slope calibration. Between zero and concentration C1, the sensor response is linear. When the concentration of chlorine becomes greater than C1, the response is non-linear. In spite of the non-linearity, the response can be approximated by a straight line between point 1 and point 2. Dual slope calibration is rarely needed. It is probably useful in fewer than 5% of applications.
MODEL 54eA SECTION 9.0 CALIBRATION - FREE CHLORINE (498CL-01) 7. Once the reading is stable, the screen at left appears. 2.000 ppm Low point : 2.000 ppm Exit High Sample the process liquid. Make a note of the reading before taking the sample. Immediately determine free chlorine. Note the controller reading again.
MODEL 54eA SECTION 10.0 CALIBRATION - TOTAL CHLORINE SECTION 10.0 CALIBRATION - TOTAL CHLORINE See TCL manual for calibration procedure.
This page intentionally left blank.
MODEL 54eA SECTION 11.0 CALIBRATION - MONOCHLORAMINE SECTION 11.0 CALIBRATION - MONOCHLORAMINE 11.1 INTRODUCTION As Figure 11-1 shows, a monochloramine sensor generates a current directly proportional to the concentration of monochloramine in the sample. Calibrating the sensor requires exposing it to a solution containing no monochloramine (zero standard) and to a solution containing a known amount of monochloramine (full-scale standard).
MODEL 54eA SECTION 11.0 CALIBRATION - MONOCHLORAMINE 11.2 ZEROING THE SENSOR 1. Place the sensor in the zero standard. Be sure no air bubbles are trapped against the membrane. The sensor current will drop rapidly at first and then gradually reach a stable zero value. To monitor the sensor current, go to the main display. Press any key to obtain the main menu. Press the ê key once to highlight “Diagnostic variables.” Press Enter (F4). The sensor current is the second item in the display.
MODEL 54eA SECTION 11.0 CALIBRATION - MONOCHLORAMINE 11.3 FULL SCALE CALIBRATION 1. Place the sensor in the process liquid. Adjust the sample flow until it is within the range recommended for the sensor. Refer to the sensor instruction sheet. 2. Adjust the monochloramine concentration until it is near the upper end of the control range. Wait until the controller reading is stable before starting the calibration. Calibrate main sensor Zero main sensor Adjust temperature Exit Enter Stabilizing . . .
MODEL 54eA SECTION 12.0 CALIBRATION - OZONE SECTION 12.0 CALIBRATION - OZONE 12.1 INTRODUCTION As Figure 12-1 shows, an ozone sensor generates a current directly proportional to the concentration of ozone in the sample. Calibrating the sensor requires exposing it to a solution containing no ozone (zero standard) and to a solution containing a known amount of ozone (full-scale standard).
MODEL 54eA SECTION 12.0 CALIBRATION - OZONE 12.2 ZEROING THE SENSOR 1. Place the sensor in the zero standard. Be sure no air bubbles are trapped against the membrane. The sensor current will drop rapidly at first and then gradually reach a stable zero value. To monitor the sensor current, go to the main display. Press any key to obtain the main menu. Press the ê key once to highlight “Diagnostic variables.” Press Enter (F4). The sensor current is the second item in the display.
MODEL 54eA SECTION 12.0 CALIBRATION - OZONE 12.3 FULL SCALE CALIBRATION 1. Place the sensor in the process liquid. Adjust the sample flow until it is within the range recommended for the sensor. Refer to the sensor instruction sheet. 2. Adjust the ozone concentration until it is near the upper end of the control range. Wait until the controller reading is stable before starting the calibration. Calibrate main sensor Zero main sensor Adjust temperature Exit Enter Stabilizing . . . Wait Cont 1.
MODEL 54eA SECTION 13.0 CALIBRATION - pH SECTION 13.0 CALIBRATION - pH 13.1 INTRODUCTION A new pH sensor must be calibrated before use. Regular recalibration is also necessary. A pH measurement cell (pH sensor and the solution to be measured) can be pictured as a battery with an extremely high internal resistance. The voltage of the battery depends on the pH of the solution.
MODEL 54eA SECTION 13.0 CALIBRATION - pH 13.2 AUTOMATIC TWO-POINT CALIBRATION 1. Be sure the pH feature has been enabled. See Section 5.8. 2. Obtain two buffer solutions. Ideally the buffer pH values should bracket the range of pH values to be measured. 3. Remove the sensor from the process liquid. If the process and buffer temperatures are appreciably different, place the sensor in a container of tap water at the buffer temperature.
MODEL 54eA SECTION 13.0 CALIBRATION - pH 10.02 pH 9. Remove the sensor from buffer 1, rinse it with water, and place it in buffer 2. Swirl the sensor. Press Cont (F3). "Wait" flashes until the reading is stable. Autocal buffer 2 Abort Cont 10.02 pH Buf2 done: 10.01 @25°C Abort 10. The screen at left appears once the reading is stable. Use the é or ê key to change the reading to the nominal pH of the buffer. The nominal pH is the pH of the buffer at 25°C. Press Cont (F3). 11.
MODEL 54eA SECTION 13.0 CALIBRATION - pH 13.3 MANUAL TWO-POINT CALIBRATION 1. Be sure the pH feature has been enabled. See Section 5.8. 2. The controller comes from the factory set for automatic pH calibration. To do a manual calibration, the factory default setting must be changed. Refer to Section 5.8. 3. Obtain two buffer solutions. Ideally the buffer pH values should bracket the range of pH values to be measured. Also obtain a thermometer. The pH of most buffer solutions is a function of temperature.
MODEL 54eA SECTION 13.0 CALIBRATION - pH 10. The screen at left appears if the pH reading in step 9 was changed. Press Pt2 (F3). Go to step 11. 4.00 pH Pt. 1 : 4.00pH 25.0°C Exit Pt 2 Edit 11. Rinse the sensor and thermometer with water and place them in buffer 2. Be sure the glass bulb and junction are completely submerged. Swirl the sensor. Press Cont (F3). "Wait" flashes until the reading stabilizes. 10.01 pH Calibrate point 2 Abort Cont 12. The screen at left appears once the reading is stable.
MODEL 54eA SECTION 13.0 CALIBRATION - pH 13.4 STANDARDIZATION (ONE-POINT CALIBRATION) 1. The pH measured by the controller can be changed to match the reading from a second or referee instrument. The process of making the two reading agree is called standardization, or one-point calibration. 2. During standardization, the difference between the two pH values is converted to the equivalent voltage.
MODEL 54eA SECTION 13.0 CALIBRATION - pH 13.5 pH SLOPE ADJUSTMENT 1. If the electrode slope is known from other measurements, it can be entered directly into the controller. The slope must be entered as the slope at 25°C. To calculate the slope at 25°C from the slope at temperature t°C, use the equation: 298 slope at 25°C = (slope at t°C) t°C + 273 Changing the slope overrides the slope determined from the previous buffer calibration. 2. From the main display, press any key to obtain the main menu.
MODEL 54eA SECTION 14.0 CALIBRATION - CURRENT OUTPUTS SECTION 14.0 CALIBRATION - CURRENT OUTPUTS 14.1 INTRODUCTION Although the controller outputs are calibrated at the factory, they can be trimmed in the field to match the reading from a standard current meter. Both the low output (0 or 4 mA) and the high output (20 mA) can be trimmed. 14.2 TRIMMING THE OUTPUTS 1. From the main display, press any key to obtain the main menu. With the cursor on "Calibrate" press Enter (F4).
MODEL 54eA SECTION 15.0 PID AND TPC CONTROL SECTION 15.0 PID AND TPC CONTROL 15.1 PID CONTROL (CODE -20) PID Control Mode Combinations PID Control All PID controllers have several control modes which can be used in various combinations: proportional plus integral (reset), proportional plus derivative (rate) and a combination of proportional (P), integral (I) and derivative (D).
MODEL 54eA SECTION 15.0 CALIBRATION - CONTROL Proportional (Gain) Plus Integral (Reset) Process Reaction Curve Method For the automatic elimination of deviation, I (Integral mode), also referred to as Reset, is used. The proportional function is modified by the addition of automatic reset. With the reset mode, the controller continues to change its output until the deviation between measurement and set point is eliminated. A PID loop can be tuned using the process reaction curve method.
MODEL 54eA SECTION 15.0 CALIBRATION - CONTROL FIGURE 15-1. The Process Reaction Curve 6. When sufficient data have been collected, return the output signal to its original value using the simulate test function. Maintain the controller in this manual mode until you are ready to initiate automatic PID control, after you have calculated the tuning constants. Once these steps are completed, the resulting process reaction curve is used to obtain information about the overall dynamics of the system.
MODEL 54eA SECTION 15.0 CALIBRATION - CONTROL concentration, temperature) compared to the measurement range, the difference between the 20 mA (Hi) and 4 (or 0) mA (Lo) setpoints, which you determined when configuring the analog output. In the example shown in Figure 15-1: The percent change in pH was: pH2 - pH1 pH “Hi” - pH “Lo” x 100% = 8.2 - 7.2 pH = 33.3% 9.0 - 6.0 pH The change in the output signal was: 6 - 4 milliamps x 100% = 12.5% 20 - 4 So the Plant Gain is: C= 33.3 = 2.66 12.
MODEL 54eA 15.2 SECTION 15.0 CALIBRATION - CONTROL TIME PROPORTIONAL CONTROL (TPC) MODE (Code -20) In the TPC mode, you must establish the following parameters which will determine how the Model 54eA controller responds to your system (see Section 5.7): • Setpoint • Time period • URV point (or 100% on) • LRV point (or 0% on) • Proportional • Integral • Derivative The following describes how TPC works. In the example, pH is to be controlled.
MODEL 54eA SECTION 16.0 TROUBLESHOOTING SECTION 16.0 TROUBLESHOOTING 16.1 OVERVIEW The 54eA controller continuously monitors itself and the sensor for faults. When the controller detects a fault in the amperometric or pH sensor or in the instrument itself it displays a fault message. If alarm 4 was enabled, the red FAIL LED will also light and relay 4 will activate. The outputs will go to 22.00 mA or to the value programmed in Section 5.6.
MODEL 54eA SECTION 16.0 TROUBLESHOOTING 16.2.1 High input current Excessive sensor current implies that the amperometric sensor is miswired or the sensor has failed. Verify that wiring is correct, including connections through a junction box. See Section 3.3. If wiring is correct, try replacing the sensor. 16.2.2 Check sensor zero The sensor current was extremely high when the sensor was zeroed. Refer to the calibration section for the analyte being determined for typical zero currents.
MODEL 54eA SECTION 16.0 TROUBLESHOOTING 16.2.8 Sense line open Most Rosemount Analytical sensors use a Pt100 or a Pt1000 in a three-wire configuration (see Figure 16-4). The in and return leads connect the RTD to the measuring circuit in the analyzer. A third wire, called the sense line, is connected to the return lead. The sense line allows the analyzer to correct for the resistance of the in and return leads and to correct for changes in lead wire resistance with changes in ambient temperature.
MODEL 54eA SECTION 16.0 TROUBLESHOOTING 16.4.1 Zero current is too high A. Is the sensor properly wired to the analyzer? See Section 3.3. B. Is the membrane completely covered with zero solution and are air bubbles not trapped against the membrane? Swirl and tap the sensor to release air bubbles. C. Is the zero solution fresh and properly made? Zero the sensor in a solution of 5% sodium sulfite in water. Prepare the solution immediately before use. It has a shelf life of only a few days. D.
MODEL 54eA SECTION 16.0 TROUBLESHOOTING 16.4.5 Barometric pressure reading is too high or too low. A. Is the pressure inside the enclosure equal to ambient pressure? The pressure sensor is inside the controller enclosure. When cable glands are in place and the front panel is tightly closed, the enclosure is moderately airtight. Therefore, as the air trapped in the enclosure heats or cools, the pressure inside the enclosure may be different from ambient. Open the front door to equalize the pressure. B.
MODEL 54eA SECTION 16.0 TROUBLESHOOTING 16.
MODEL 54eA SECTION 16.0 TROUBLESHOOTING 16.5.3 Sensor can be calibrated, but the current is too low A. Is the temperature low? For both the 499ACL-01 and 498CL-01 sensors, sensor current is a strong function of temperature. The current decreases about 3% for every ºC drop in temperature. B. Is the pH high? The 499ACL-01 sensor current is a strong function of pH. Sensor current decreases as pH increases. Above pH 7, a 0.1 unit increase in pH lowers the current by about 5%.
MODEL 54eA SECTION 16.0 TROUBLESHOOTING 16.5.6 Sensor does not respond to changes in chlorine level. A. Is the grab sample test accurate? Is the grab sample representative of the sample flowing to the sensor? B. Is the pH compensation correct? (Applies only to the 499ACL-01 sensor.) If the controller is using manual pH correction, verify that the pH value in the controller equals the actual pH to within ±0.1 pH. If the controller is using automatic pH correction, check the calibration of the pH sensor. C.
MODEL 54eA 16.7 SECTION 16.0 TROUBLESHOOTING TROUBLESHOOTING WHEN NO ERROR MESSAGE IS SHOWING — MONOCHLORAMINE Problem Zero current was accepted, but the current is outside the range -10 to 50 nA Error or warning message appears while zeroing the sensor (zero current is too high) Zero current is unstable Sensor can be calibrated, but the current is less than about 350 nA/ppm at 25°C Process readings are erratic Readings drift Sensor does not respond to changes in monochloramine level See Section 16.7.
MODEL 54eA SECTION 16.0 TROUBLESHOOTING 16.7.3 Sensor can be calibrated, but the current is too low A. Is the temperature low? The sensor current decreases about 5% for every °C drop in temperature. B. Sensor current depends on the rate of sample flow past the sensor tip. If the flow is too low, monochloramine readings will be low. Refer to the sensor instruction sheet for recommended sample flows. C. Low current can be caused by lack of electrolyte flow to the cathode and membrane.
MODEL 54eA SECTION 16.0 TROUBLESHOOTING 16.7.7 Readings are too low. A. Was the sample tested as soon as it was taken? Monochloramine solutions are moderately unstable. Test the sample immediately after collecting it. Avoid exposing the sample to sunlight. B. When was the sensor fill solution last replaced? The monochloramine sensor loses sensitivity, that is, it generates less current per ppm of monochloramine, as it operates.
MODEL 54eA SECTION 16.0 TROUBLESHOOTING 16.
MODEL 54eA SECTION 16.0 TROUBLESHOOTING 16.8.4 Process readings are erratic A. Readings are often erratic when a new sensor or a rebuilt sensor is first placed in service. The current usually stabilizes after a few hours. B. Is the sample flow within the recommended range? High sample flow may cause erratic readings. Refer to the sensor instruction sheet for recommended flow rates. C. Are the holes between the membrane and the electrolyte reservoir open. Refer to Section 16.8.2. D.
MODEL 54eA SECTION 16.0 TROUBLESHOOTING 16.9 TROUBLESHOOTING WHEN NO FAULT MESSAGE IS SHOWING - pH Problem Warning or error message during two-point calibration Warning or error message during standardization Controller will not accept manual slope Sensor does not respond to known pH changes Calibration was successful, but process pH is slightly different from expected value Calibration was successful, but process pH is grossly wrong and/or noisy Process reading is noisy See Section 16.9.1 16.9.2 16.9.
MODEL 54eA SECTION 16.0 TROUBLESHOOTING 16.9.2 Warning or error message during two-point calibration. During standardization, the millivolt signal from the pH cell is increased or decreased until it agrees with the pH reading from a reference instrument. A unit change in pH requires an offset of about 59 mV. The controller limits the offset to ±1400 mV. If the standardization causes an offset greater than ±1400 mV, the analyzer will display the Calibration Error screen.
MODEL 54eA SECTION 16.0 TROUBLESHOOTING 16.9.6 Calibration was successful, but process pH is grossly wrong and/or noisy. Grossly wrong or noisy readings suggest a ground loop (measurement system connected to earth ground at more than one point), a floating system (no earth ground), or noise being brought into the analyzer by the sensor cable. The problem arises from the process or installation. It is not a fault of the analyzer. The problem should disappear once the sensor is taken out of the system.
MODEL 54eA SECTION 16.0 TROUBLESHOOTING 16.10 TROUBLESHOOTING NOT RELATED TO MEASUREMENT PROBLEMS Problem Display segments missing Alarm relays are chattering Incorrect current output Display too light or too dark “Level 1, 2 or 3 security: Lock” shown in display “Hold mode activated” showing in display “Simulating output 1 or 2” showing in display “Simulating alarm 1, 2, 3 or 4” showing in display Action Replace display board 1. Check alarm setpoints. 2.
MODEL 54eA SECTION 16.0 TROUBLESHOOTING 16.12 SIMULATING INPUTS - OTHER AMPEROMETRIC MEASUREMENTS To check the performance of the controller, use a decade box and a battery to simulate the current from the sensor. The battery, which opposes the polarizing voltage, is necessary to ensure that the sensor current has the correct sign. NOTE It is not possible to simulate an input from a 498CL-01 sensor. A.
MODEL 54eA SECTION 16.0 TROUBLESHOOTING 16.13 SIMULATING INPUTS - pH 16.13.1 General This section describes how to simulate a pH input into the controller. To simulate a pH measurement, connect a standard millivolt source to the controller. If the controller is working properly, it will accurately measure the input voltage and convert it to pH. Although the general procedure is the same, the wiring details depend on whether the preamplifier is in the sensor, a junction box, or the controller. 16.13.
MODEL 54eA SECTION 16.0 TROUBLESHOOTING 16.14 SIMULATING TEMPERATURE 16.14.1 General. The 54eA controller accepts either a Pt100 RTD (for pH, 499ADO, 499ATrDO, 499ACL-01, 499ACL-02, 499ACL-03, and 499AOZ sensors) or a 22k NTC thermistor (for Hx438 and Gx448 DO sensors and most steam-sterilizable DO sensors from other manufacturers). The Pt100 RTD is in a three-wire configuration. See Figure 16-4. The 22k thermistor has a two-wire configuration. 16.14.
MODEL 54eA SECTION 16.0 TROUBLESHOOTING 16.15 MEASURING REFERENCE VOLTAGE Some processes contain substances that poison or shift the potential of the reference electrode. Sulfide is a good example. Prolonged exposure to sulfide converts the reference electrode from a silver/silver chloride electrode to a silver/silver sulfide electrode. The change in reference voltage is several hundred millivolts.
MODEL 54eA SECTION 17.0 MAINTENANCE SECTION 17.
MODEL 54eA SECTION 18.0 RETURN OF MATERIAL SECTION 18.0 RETURN OF MATERIAL 18.1 GENERAL. To expedite the repair and return of instruments, proper communication between the customer and the factory is important. Before returning a product for repair, call 1-949-757-8500 for a Return Materials Authorization (RMA) number. 18.2 WARRANTY REPAIR. The following is the procedure for returning instruments still under warranty: 1. Call Rosemount Analytical for authorization. 2.
WARRANTY Goods and part(s) (excluding consumables) manufactured by Seller are warranted to be free from defects in workmanship and material under normal use and service for a period of twelve (12) months from the date of shipment by Seller. Consumables, pH electrodes, membranes, liquid junctions, electrolyte, O-rings, etc. are warranted to be free from defects in workmanship and material under normal use and service for a period of ninety (90) days from date of shipment by Seller.
The right people, the right answers, right now. ON-LINE ORDERING NOW AVAILABLE ON OUR WEB SITE http://www.raihome.com Specifications subject to change without notice. Credit Cards for U.S. Purchases Only. Emerson Process Management Liquid Division 2400 Barranca Parkway Irvine, CA 92606 USA Tel: (949) 757-8500 Fax: (949) 474-7250 http://www.raihome.com © Rosemount Analytical Inc.