
User`s guide


Copyright © 2004 EIM COMPANY, INC. • 13840 PIKE ROAD • MISSOURI CITY, TX. 77489
Page 95
Controlinc 1746-C (Version 5.21) Network Master Users Guide (2004-11-18)
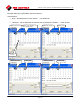
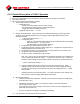
Below is a table of empirical values demonstrating the difference in network performance when
changing the number of additional valves to scan in the scan time slice.
This network scan scenario is for base readings with
• No Network Writes – Only Polling
• Zero M0/M1 transfer delays waiting for the RLL to interface with the 1746-C.
• 60 … Number of nodes configured to be on network
• 25 … Scan Period
• Polling base scan data … no additional registers.
• No additional delay time for Modbus response messages from the actuators.
Average Network Scan Time (seconds) after changing the
number of
“Additional Valves to Scan in the Network Scan Time Slice”
# Nodes “Talking”
… On-Line
0 1 2 3 5 7 9
1 of 60 (#60) 0.2 0.2 0.2 0.2 0.2 0.2 0.2
2 of 60 (#59 – 60) 0.3 0.3 0.3 0.3 0.3 0.3 0.3
3 of 60 (#58 – 60) 0.4 0.4 0.4 0.4 0.4 0.4 0.4
6 of 60 (#55 – 60) 0.7 0.6 0.6 0.6 0.6 0.6 0.6
12 of 60 (#49 – 60) 1.3 1.2 1.1 1.1 1.0 1.0 1.0
24 of 60 (#37 – 60) 2.6 2.4 2.2 2.1 2.0 2.0 2.0
30 of 60 (#31 – 60) 3.2 3.0 2.7 2.7 2.6 2.5 2.5
36 of 60 (#25 – 60) 3.8 3.5 3.2 3.1 3.0 2.9 2.9
42 of 60 (#19 – 60) 4.4 4.1 3.8 3.7 3.6 3.5 3.4
48 of 60 (#13 – 60) 5.1 4.7 4.4 4.2 4.4 3.9 3.9
54 of 60 (#7 – 60) 5.7 5.3 4.9 4.7 4.5 4.4 4.3
60 of 60 (#1 – 60) 6.3 5.6 5.4 5.2 4.9 4.8 4.8
Note: For the most accurate scan period timing, do not use the 1
st
scan period after a power cycle (or
environment change) … wait until the 2
nd
scan period or beyond.
The values in this table
“rounded values” and
have a precision of
(+/-) 0.2 seconds.
Because of this, these
numbers are only
appropriate for estimates
and trend analysis.