
User guide


4. Historic Comparison connued...
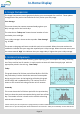
Last 7 Days
This screen shows a rolling weekly comparison. This shows the
last 7 days of consumpon compared with the previous 7 days.
The lighter bars show the last 7 days, with the darker bars
behind showing the previous 7 days.
Last 12 Months
This screen shows consumpon informaon over the last 12
months compared with the previous 12 months. The lighter
bars represent the last 12 months values, with the darker bars
behind showing the previous 12 months consumpon for
comparison. E.g. the rst column shows 380 kWhs used last
January (lighter bar), compared with 340kWhs used the
previous January (Darker Bars)
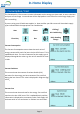
Menu Opon 5 - System Info
These screens show system specic informaon for use by ENER-G Switch2 engineers.
Depending on the type of meter(s) connected to the G6, the
screens 1A &1B may show some useful informaon:
SN: Serial Number of the meter
Read: The meter reading
On, At: The last me the meter was read by the G6
Rate: Tari Informaon and daily standing charge
*This may not be applicable to your parcular installaon.
In-Home Display
Page 11
Page 12