
User manual


Another consideration is the potential failure of the charger. If the
charger malfunctions, causing higher-than-recommended charge
rates, substantial volumes of hydrogen and oxygen will be vented
from the cell. This mixture is explosive and should not be allowed
to accumulate. Therefore, despite its significant advantages over
other lead-acid batteries, the CYCLON
®
cells/batteries SHOULD
NEVER BE CHARGED IN A GAS-TIGHT CONTAINER.
8.3 Shorting
CYCLON batteries have very low internal impedance and thus
are capable of delivering high currents if externally short circuited.
The resultant heat can cause severe burns and is a potential
fire hazard. Particular caution should be used when the person
working near the open terminals of cells or batteries is wearing
metal rings or watchbands.
Accidentally placing metal articles across the terminals could
result in severe skin burns. It is a good practice to remove all
metallic items such as watches, bracelets and personal jewellery
when working on or around battery terminals.
As a further precaution, when installing batteries or working on
them, insulating gloves should be worn and only insulated tools
should be used to prevent accidental short circuits.
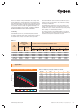
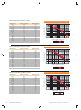
2.5Ah (D) 0.00003 0.0003 0.0004 0.0002 0.0001 0.0038 0.0019 0.0010
4.5Ah (DT) 0.00005 0.0005 0.00064 0.00032 0.00016 0.00636 0.00318 0.00159
5Ah (X) 0.000052 0.00052 0.00066 0.00033 0.00017 0.00661 0.00331 0.00165
8Ah (E) 0.00008 0.0008 0.0010 0.0005 0.0003 0.0102 0.0051 0.0025
12Ah (J) 0.0012 0.00012 0.0015 0.0008 0.0004 0.0153 0.0076 0.0038
25Ah (BC) 0.00025 0.0025 0.0032 0.0016 0.0008 0.0318 0.0159 0.0079
Hydrogen gas
evolved per battery, Cu. ft/hr. of airflow to keep hydrogen accumulation below:
cc/sec.
2.27 VPC 2.45VPC
1% 2% 4% 1% 2% 4%
2.27 VPC 2.45 VPC
12V
Battery
Table 8-1
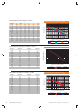
Appendix A
D TD X E BC
J
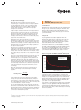
1000
100
10
1
0.1
0.01 0.1 1
Hours to 1.67 VPC at 25°C/77°F
Amps per cell
10 100
Figure A-1: Single Cell CC Graphs to 1.67 VPC
2 min. 24.6 34.9 44.1 55.9 63.3 164.7
5 min. 14.3 22.8 27.3 39.0 47.1 113.6
10 min. 8.9 14.9 17.4 26.4 33.2 76.7
15 min. 5.9 10.8 12.9 20.0 27.9 60.0
20 min. 5.3 9.1 10.4 16.4 21.4 47.8
30 min. 3.8 6.6 7.6 12.0 16.0 35.2
45 min. 2.75 4.7 5.4 8.6 11.7 25.4
1 hr. 1.9 3.6 4.2 6.8 9.7 20.0
2 hr. 1.2 2.0 2.3 3.6 5.1 10.9
3 hr. 0.80 1.4 1.6 2.5 3.6 7.6
4 hr. 0.60 1.0 1.2 1.9 2.8 5.8
5 hr. 0.48 0.83 0.96 1.6 2.3 4.9
8 hr. 0.30 0.55 0.60 1.0 1.5 3.1
10 hr. 0.26 0.42 0.50 0.81 1.2 2.6
20 hr. 0.14 0.23 0.30 0.40 0.60 1.4
Run Time D Tall D X E J BC
Table A-1: Amperes per Single Cell Data to 1.67 VPC
17
Publication No: EN-CYC-AM-007 - December 2008
www.enersys-emea.com