Why is my PV Module rating larger than my Inverter rating? MAR 2022 ©2022 Enphase Energy. All rights reserved. Enphase, the Enphase logo, IQ System Controller 2, IQ Battery, IQ Gateway, IQ Combiner, IQ Microinverter, Enphase Installer App, and other trademarks or service names are the trademarks of Enphase Energy, Inc. Data subject to change.
Why is my PV Module rating larger than my Inverter rating? PV module and inverter selection are two of the most important decisions in PV system design. Ensuring that these components will work together is important from a technical, reliability, and economic perspective. Goals and design assumptions of different stakeholders can influence the decision-making process.
Theory Sizing starts by ensuring that PV modules are electrically compatible with the inverter. Enphase provides an online module compatibility calculator to determine electrical compatibility, purely based on the inverter DC input voltage and current ranges: https://enphase.com/en-us/support/module-compatibility.
Module Degradtion over 25 Years 600 550 500 450 400 360 345 350 300 250 150 293 279 274 100 321 301 287 335 321 307 356 342 327 313 299 285 334 320 305 290 200 330 315 300 349 328 322 308 363 342 335 399 384 370 356 349 397 383 369 389 375 410 424 416 402 451 438 429 492 479 465 456 506 469 483 533 520 496 558 544 530 516 502 488 474 460 447 433 419 405 391 377 427 413 498 484 470 456 441 513 569 555 541 527 581 566 552 537
Which locations are considered for this study? In order to capture all the climatic scenarios in US, a total of 8 locations have been selected. These 8 locations broadly encapsulate all the climate extremes that US experiences. Among all the parameters that affects the Solar system energy harvest, Irradiance and Temperature and the most important one and are listed below in the table for the selected locations.
Definition of output parameters used in the simulations AC CAPACITY FACTOR The capacity factor is the ratio of the system’s predicted electrical output in the first year of operation to the nameplate output, which is equivalent to the quantity of energy the system would generate if it operated at its nameplate capacity for every hour of the year.
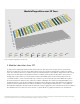
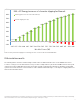
0% 60% 50% IQ8 - AC Energy increase v/s Inverter clipping for Newark AC Energy increase over 1.0 DC:AC ratio (%) 46.5% 40% 57.9% 63.2% 49.3% 42.2% 39.0% 30% 34.0% 30.3% 24.5% 20.5% 20% 14.4% 10% 0% 53.2% Inverter Clipping loss (%) 55.6% 61.1% 10.3% 0.0% 4.1% 0.0% 0.0% 0.0% 0.0% 0.0% -0.1% -0.4% -0.7% -1.5% -2.1% -3.1% -3.9% -5.1% -6.0% -6.9% -8.3% -9.
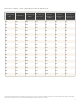
Table 1: IQ8 - Denver, -0.35%/°C simple efficiency model, 180° azimuth, 20° tilt. Mo du le Power (W) D C : AC Rat i o A n n u a l E n e rgy (kWh) AC C apac ity Factor (%) Ye ar 1 Inve rte r C lipping loss (kWh) Ye ar 1 Inve rte r C lipping loss (%) Total Inverter C l ip ping in 25 Years ( %) 245 1.00 430.5 20.1 0.0 0.0 0.0 255 1.04 448.2 20.9 0.0 0.0 0.0 270 1.10 474.7 22.1 0.0 0.0 0.0 280 1.14 492.4 22.9 0.0 0.0 0.0 295 1.20 518.3 24.1 0.6 0.1 0.0 305 1.24 534.
Table 2: IQ8 – Los Angeles, -0.35%/°C simple efficiency model, 180° azimuth, 20° tilt. Mo du le Power (W) D C : AC Rat i o A n n u a l E n e rgy (kWh) AC C apac ity Factor (%) Ye ar 1 Inve rte r C lipping loss (kWh) Ye ar 1 Inve rte r C lipping loss (%) Total Inverter C l ip ping in 25 Years ( %) 245 1.00 446.8 20.8 0.0 0.0 0.0 255 1.04 465.2 21.7 0.0 0.0 0.0 270 1.10 492.7 23.0 0.0 0.0 0.0 280 1.14 511.1 23.8 0.0 0.0 0.0 295 1.20 538.4 25.1 0.2 0.0 0.0 305 1.
Table 3: IQ8 – New York city, -0.35%/°C simple efficiency model, 180° azimuth, 20° tilt. Mo du le Power (W) D C : AC Rat i o A n n u a l E n e rgy (kWh) AC C apac ity Factor (%) Ye ar 1 Inve rte r C lipping loss (kWh) Ye ar 1 Inve rte r C lipping loss (%) Total Inverter C l ip ping in 25 Years ( %) 245 1.00 344.3 16.0 0.0 0.0 0.0 255 1.04 358.5 16.7 0.0 0.0 0.0 270 1.10 379.8 17.7 0.0 0.0 0.0 280 1.14 393.9 18.4 0.0 0.0 0.0 295 1.20 415.0 19.3 0.2 0.0 0.0 305 1.
Table 4: IQ8 – Dallas, -0.35%/°C simple efficiency model, 180° azimuth, 20° tilt. Mo du le Power (W) D C : AC Rat i o A n n u a l E n e rgy (kWh) AC C apac ity Factor (%) Ye ar 1 Inve rte r C lipping loss (kWh) Ye ar 1 Inve rte r C lipping loss (%) Total Inverter C l ip ping in 25 Years ( %) 245 1.00 387.2 18.0 0.0 0.0 0.0 255 1.04 403.1 18.8 0.0 0.0 0.0 270 1.10 427.0 19.9 0.0 0.0 0.0 280 1.14 442.9 20.6 0.0 0.0 0.0 295 1.20 466.6 21.7 0.2 0.0 0.0 305 1.24 482.
Table 5: IQ8 – Miami, -0.35%/°C simple efficiency model, 180° azimuth, 20° tilt. Mo du le Power (W) D C : AC Rat i o A n n u a l E n e rgy (kWh) AC C apac ity Factor (%) Ye ar 1 Inve rte r C lipping loss (kWh) Ye ar 1 Inve rte r C lipping loss (%) Total Inverter C l ip ping in 25 Years ( %) 245 1.00 412.3 19.2 0.0 0.0 0.0 255 1.04 429.2 20.0 0.0 0.0 0.0 270 1.10 454.6 21.2 0.0 0.0 0.0 280 1.14 471.6 22.0 0.0 0.0 0.0 295 1.20 496.9 23.2 0.1 0.0 0.0 305 1.24 513.
Table 6: IQ8 – Phoenix, -0.35%/°C simple efficiency model, 180° azimuth, 20° tilt. Mo du le Power (W) D C : AC Rat i o A n n u a l E n e rgy (kWh) AC C apac ity Factor (%) Ye ar 1 Inve rte r C lipping loss (kWh) Ye ar 1 Inve rte r C lipping loss (%) Total Inverter C l ip ping in 25 Years ( %) 245 1.00 458.3 21.4 0.0 0.0 0.0 255 1.04 477.2 22.2 0.0 0.0 0.0 270 1.10 505.4 23.5 0.0 0.0 0.0 280 1.14 524.2 24.4 0.0 0.0 0.0 295 1.20 552.3 25.7 0.2 0.0 0.0 305 1.24 570.
Table 7: IQ8 – Minnesota, -0.35%/°C simple efficiency model, 180° azimuth, 20° tilt. Mo du le Power (W) D C : AC Rat i o A n n u a l E n e rgy (kWh) AC C apac ity Factor (%) Ye ar 1 Inve rte r C lipping loss (kWh) Ye ar 1 Inve rte r C lipping loss (%) Total Inverter C l ip ping in 25 Years ( %) 245 1.00 355.5 16.6 0.0 0.0 0.0 255 1.04 370.1 17.2 0.0 0.0 0.0 270 1.10 392.0 18.3 0.0 0.0 0.0 280 1.14 406.6 18.9 0.1 0.0 0.0 295 1.20 428.0 19.9 0.7 0.1 0.0 305 1.
Table 8: IQ8 – Newark, -0.35%/°C simple efficiency model, 180° azimuth, 20° tilt. Mo du le Power (W) D C : AC Rat i o A n n u a l E n e rgy (kWh) AC C apac ity Factor (%) Ye ar 1 Inve rte r C lipping loss (kWh) Ye ar 1 Inve rte r C lipping loss (%) Total Inverter C l ip ping in 25 Years ( %) 245 1.00 354.4 16.5 0.0 0.0 0.0 255 1.04 369.0 17.2 0.0 0.0 0.0 270 1.10 390.8 18.2 0.0 0.0 0.0 280 1.14 405.4 18.9 0.0 0.0 0.0 295 1.20 427.1 19.9 0.2 0.0 0.0 305 1.24 441.
IQ8+ simulation results The following tables shows the simulated single-module values for different DC:AC ratios on the IQ8+ Microinverter in locations covering across the United States, using a -0.35%/C simple efficiency model. The IQ8+ Microinverter has a peak output power rating of 300 VA. In this model, the module orientation is fixed at 180° azimuth, 20° tilt.
Table 10: IQ8+ – Los Angeles, -0.35%/°C simple efficiency model, 180° azimuth, 20° tilt. Mo du le Power (W) D C : AC Rat i o A n n u a l E n e rgy (kWh) AC C apac ity Factor (%) Ye ar 1 Inve rte r C lipping loss (kWh) Ye ar 1 Inve rte r C lipping loss (%) Total Inverter C l ip ping in 25 Years ( %) 300 1.00 547.5 20.8 0.0 0.0 0.0 315 1.05 575.1 21.9 0.0 0.0 0.0 330 1.10 602.6 22.9 0.0 0.0 0.0 345 1.15 630.1 24.0 0.0 0.0 0.0 360 1.20 657.4 25.0 0.2 0.0 0.0 375 1.
Table 11: IQ8+ – New York City, -0.35%/°C simple efficiency model, 180° azimuth, 20° tilt. Mo du le Power (W) D C : AC Rat i o A n n u a l E n e rgy (kWh) AC C apac ity Factor (%) Ye ar 1 Inve rte r C lipping loss (kWh) Ye ar 1 Inve rte r C lipping loss (%) Total Inverter C l ip ping in 25 Years ( %) 300 1.00 422.1 16.1 0.0 0.0 0.0 315 1.05 443.4 16.9 0.0 0.0 0.0 330 1.10 464.6 17.7 0.0 0.0 0.0 345 1.15 485.9 18.5 0.0 0.0 0.0 360 1.20 506.9 19.3 0.2 0.0 0.0 375 1.
Table 12: IQ8+ – Dallas, -0.35%/°C simple efficiency model, 180° azimuth, 20° tilt. Mo du le Power (W) D C : AC Rat i o A n n u a l E n e rgy (kWh) AC C apac ity Factor (%) Ye ar 1 Inve rte r C lipping loss (kWh) Ye ar 1 Inve rte r C lipping loss (%) Total Inverter C l ip ping in 25 Years ( %) 300 1.00 474.5 18.1 0.0 0.0 0.0 315 1.05 498.4 19.0 0.0 0.0 0.0 330 1.10 522.3 19.9 0.0 0.0 0.0 345 1.15 546.2 20.8 0.0 0.0 0.0 360 1.20 569.8 21.7 0.2 0.0 0.0 375 1.
Table 13: IQ8+ – Miami, -0.35%/°C simple efficiency model, 180° azimuth, 20° tilt. Mo du le Power (W) D C : AC Rat i o A n n u a l E n e rgy (kWh) AC C apac ity Factor (%) Ye ar 1 Inve rte r C lipping loss (kWh) Ye ar 1 Inve rte r C lipping loss (%) Total Inverter C l ip ping in 25 Years ( %) 300 1.00 505.2 19.2 0.0 0.0 0.0 315 1.05 530.6 20.2 0.0 0.0 0.0 330 1.10 556.1 21.2 0.0 0.0 0.0 345 1.15 581.4 22.1 0.0 0.0 0.0 360 1.20 606.8 23.1 0.1 0.0 0.0 375 1.25 631.
Table 14: IQ8+ – Phoenix, -0.35%/°C simple efficiency model, 180° azimuth, 20° tilt. Mo du le Power (W) D C : AC Rat i o A n n u a l E n e rgy (kWh) AC C apac ity Factor (%) Ye ar 1 Inve rte r C lipping loss (kWh) Ye ar 1 Inve rte r C lipping loss (%) Total Inverter C l ip ping in 25 Years ( %) 300 1.00 561.6 21.4 0.0 0.0 0.0 315 1.05 589.9 22.4 0.0 0.0 0.0 330 1.10 618.1 23.5 0.0 0.0 0.0 345 1.15 646.4 24.6 0.0 0.0 0.0 360 1.20 674.4 25.7 0.2 0.0 0.0 375 1.
Table 15: IQ8+ – Minnesota, -0.35%/°C simple efficiency model, 180° azimuth, 20° tilt. Mo du le Power (W) D C : AC Rat i o A n n u a l E n e rgy (kWh) AC C apac ity Factor (%) Ye ar 1 Inve rte r C lipping loss (kWh) Ye ar 1 Inve rte r C lipping loss (%) Total Inverter C l ip ping in 25 Years ( %) 300 1.00 435.7 16.6 0.0 0.0 0.0 315 1.05 457.7 17.4 0.0 0.0 0.0 330 1.10 479.6 18.2 0.0 0.0 0.0 345 1.15 501.4 19.1 0.2 0.0 0.0 360 1.20 522.8 19.9 0.7 0.1 0.0 375 1.
Table 16: IQ8+ – Newark, -0.35%/°C simple efficiency model, 180° azimuth, 20° tilt. Mo du le Power (W) D C : AC Rat i o A n n u a l E n e rgy (kWh) AC C apac ity Factor (%) Ye ar 1 Inve rte r C lipping loss (kWh) Ye ar 1 Inve rte r C lipping loss (%) Total Inverter C l ip ping in 25 Years ( %) 300 1.00 434.4 16.5 0.0 0.0 0.0 315 1.05 456.2 17.4 0.0 0.0 0.0 330 1.10 478.1 18.2 0.0 0.0 0.0 345 1.15 500.0 19.0 0.0 0.0 0.0 360 1.20 521.7 19.9 0.2 0.0 0.0 375 1.
IQ8M simulation results The following tables shows the simulated single-module values for different DC:AC ratios on the IQ8M Microinverter in locations covering across the United States, using a -0.35%/C simple efficiency model. The IQ8M Microinverter has a peak output power rating of 330 VA. In this model, the module orientation is fixed at 180° azimuth, 20° tilt.
Table 18: IQ8M – Los Angeles, -0.35%/°C simple efficiency model, 180° azimuth, 20° tilt. Mo du le Power (W) D C : AC Rat i o A n n u a l E n e rgy (kWh) AC C apac ity Factor (%) Ye ar 1 Inve rte r C lipping loss (kWh) Ye ar 1 Inve rte r C lipping loss (%) Total Inverter C l ip ping in 25 Years ( %) 330 1.00 602.5 20.8 0.0 0.0 0.0 345 1.05 630.0 21.8 0.0 0.0 0.0 365 1.11 666.7 23.1 0.0 0.0 0.0 380 1.15 694.2 24.0 0.0 0.0 0.0 395 1.20 721.5 25.0 0.2 0.0 0.0 415 1.
Table 19: IQ8M – New York City, -0.35%/°C simple efficiency model, 180° azimuth, 20° tilt. Mo du le Power (W) D C : AC Rat i o A n n u a l E n e rgy (kWh) AC C apac ity Factor (%) Ye ar 1 Inve rte r C lipping loss (kWh) Ye ar 1 Inve rte r C lipping loss (%) Total Inverter C l ip ping in 25 Years ( %) 330 1.00 464.5 16.1 0.0 0.0 0.0 345 1.05 485.8 16.8 0.0 0.0 0.0 365 1.11 514.1 17.8 0.0 0.0 0.0 380 1.15 535.3 18.5 0.0 0.0 0.0 395 1.20 556.4 19.2 0.2 0.0 0.0 415 1.
Table 20: IQ8M – Dallas, -0.35%/°C simple efficiency model, 180° azimuth, 20° tilt. Mo du le Power (W) D C : AC Rat i o A n n u a l E n e rgy (kWh) AC C apac ity Factor (%) Ye ar 1 Inve rte r C lipping loss (kWh) Ye ar 1 Inve rte r C lipping loss (%) Total Inverter C l ip ping in 25 Years ( %) 330 1.00 522.2 18.1 0.0 0.0 0.0 345 1.05 546.1 18.9 0.0 0.0 0.0 365 1.11 577.9 20.0 0.0 0.0 0.0 380 1.15 601.8 20.8 0.0 0.0 0.0 395 1.20 625.4 21.6 0.2 0.0 0.0 415 1.
Table 21: IQ8M – Miami, -0.35%/°C simple efficiency model, 180° azimuth, 20° tilt. Mo du le Power (W) D C : AC Rat i o A n n u a l E n e rgy (kWh) AC C apac ity Factor (%) Ye ar 1 Inve rte r C lipping loss (kWh) Ye ar 1 Inve rte r C lipping loss (%) Total Inverter C l ip ping in 25 Years ( %) 330 1.00 555.9 19.2 0.0 0.0 0.0 345 1.05 581.4 20.1 0.0 0.0 0.0 365 1.11 615.2 21.3 0.0 0.0 0.0 380 1.15 640.6 22.2 0.0 0.0 0.0 395 1.20 665.9 23.0 0.1 0.0 0.0 415 1.26 699.
Table 22: IQ8M – Phoenix, -0.35%/°C simple efficiency model, 180° azimuth, 20° tilt. Mo du le Power (W) D C : AC Rat i o A n n u a l E n e rgy (kWh) AC C apac ity Factor (%) Ye ar 1 Inve rte r C lipping loss (kWh) Ye ar 1 Inve rte r C lipping loss (%) Total Inverter C l ip ping in 25 Years ( %) 330 1.00 618.0 21.4 0.0 0.0 0.0 345 1.05 646.2 22.4 0.0 0.0 0.0 365 1.11 683.9 23.7 0.0 0.0 0.0 380 1.15 712.1 24.6 0.0 0.0 0.0 395 1.20 740.2 25.6 0.2 0.0 0.0 415 1.
Table 23: IQ8M – Minnesota, -0.35%/°C simple efficiency model, 180° azimuth, 20° tilt. Mo du le Power (W) D C : AC Rat i o A n n u a l E n e rgy (kWh) AC C apac ity Factor (%) Ye ar 1 Inve rte r C lipping loss (kWh) Ye ar 1 Inve rte r C lipping loss (%) Total Inverter C l ip ping in 25 Years ( %) 330 1.00 479.5 16.6 0.0 0.0 0.0 345 1.05 501.5 17.3 0.0 0.0 0.0 365 1.11 530.7 18.4 0.0 0.0 0.0 380 1.15 552.4 19.1 0.2 0.0 0.0 395 1.20 573.8 19.9 0.7 0.1 0.0 415 1.
Table 24: IQ8M – Newark, -0.35%/°C simple efficiency model, 180° azimuth, 20° tilt. Mo du le Power (W) D C : AC Rat i o A n n u a l E n e rgy (kWh) AC C apac ity Factor (%) Ye ar 1 Inve rte r C lipping loss (kWh) Ye ar 1 Inve rte r C lipping loss (%) Total Inverter C l ip ping in 25 Years ( %) 330 1.00 478.0 16.5 0.0 0.0 0.0 345 1.05 499.9 17.3 0.0 0.0 0.0 365 1.11 529.0 18.3 0.0 0.0 0.0 380 1.15 550.9 19.1 0.0 0.0 0.0 395 1.20 572.6 19.8 0.2 0.0 0.0 415 1.
IQ8A simulation results The following tables shows the simulated single-module values for different DC:AC ratios on the IQ8A Microinverter in locations covering across the United States, using a -0.35%/C simple efficiency model. The IQ8A Microinverter has a peak output power rating of 366 VA. In this model, the module orientation is fixed at 180° azimuth, 20° tilt.
Table 26: IQ8A – Los Angeles, -0.35%/°C simple efficiency model, 180° azimuth, 20° tilt. Mo du le Power (W) D C : AC Rat i o A n n u a l E n e rgy (kWh) AC C apac ity Factor (%) Ye ar 1 Inve rte r C lipping loss (kWh) Ye ar 1 Inve rte r C lipping loss (%) Total Inverter C l ip ping in 25 Years ( %) 365 1.00 670.4 20.9 0.0 0.0 0.0 385 1.05 707.3 22.1 0.0 0.0 0.0 405 1.11 744.1 23.2 0.0 0.0 0.0 420 1.15 771.8 24.1 0.0 0.0 0.0 440 1.20 808.2 25.2 0.4 0.0 0.0 460 1.
Table 27: IQ8A – New York city, -0.35%/°C simple efficiency model, 180° azimuth, 20° tilt. Mo du le Power (W) D C : AC Rat i o A n n u a l E n e rgy (kWh) AC C apac ity Factor (%) Ye ar 1 Inve rte r C lipping loss (kWh) Ye ar 1 Inve rte r C lipping loss (%) Total Inverter C l ip ping in 25 Years ( %) 365 1.00 517.1 16.1 0.0 0.0 0.0 385 1.05 545.6 17.0 0.0 0.0 0.0 405 1.11 574.0 17.9 0.0 0.0 0.0 420 1.15 595.4 18.6 0.0 0.0 0.0 440 1.20 623.5 19.4 0.3 0.1 0.0 460 1.
Table 28: IQ8A – Dallas, -0.35%/°C simple efficiency model, 180° azimuth, 20° tilt. Mo du le Power (W) D C : AC Rat i o A n n u a l E n e rgy (kWh) AC C apac ity Factor (%) Ye ar 1 Inve rte r C lipping loss (kWh) Ye ar 1 Inve rte r C lipping loss (%) Total Inverter C l ip ping in 25 Years ( %) 365 1.00 581.2 18.1 0.0 0.0 0.0 385 1.05 613.2 19.1 0.0 0.0 0.0 405 1.11 645.2 20.1 0.0 0.0 0.0 420 1.15 669.1 20.9 0.0 0.0 0.0 440 1.20 700.7 21.9 0.4 0.1 0.0 460 1.
Table 29: IQ8A – Miami, -0.35%/°C simple efficiency model, 180° azimuth, 20° tilt. Mo du le Power (W) D C : AC Rat i o A n n u a l E n e rgy (kWh) AC C apac ity Factor (%) Ye ar 1 Inve rte r C lipping loss (kWh) Ye ar 1 Inve rte r C lipping loss (%) Total Inverter C l ip ping in 25 Years ( %) 365 1.00 618.7 19.3 0.0 0.0 0.0 385 1.05 652.7 20.4 0.0 0.0 0.0 405 1.11 686.7 21.4 0.0 0.0 0.0 420 1.15 712.2 22.2 0.0 0.0 0.0 440 1.20 746.1 23.3 0.2 0.0 0.0 460 1.26 779.
Table 30: IQ8A – Phoenix, -0.35%/°C simple efficiency model, 180° azimuth, 20° tilt. Mo du le Power (W) D C : AC Rat i o A n n u a l E n e rgy (kWh) AC C apac ity Factor (%) Ye ar 1 Inve rte r C lipping loss (kWh) Ye ar 1 Inve rte r C lipping loss (%) Total Inverter C l ip ping in 25 Years ( %) 365 1.00 687.7 21.4 0.0 0.0 0.0 385 1.05 725.5 22.6 0.0 0.0 0.0 405 1.11 763.3 23.8 0.0 0.0 0.0 420 1.15 791.7 24.7 0.0 0.0 0.0 440 1.20 829.2 25.9 0.3 0.0 0.0 460 1.
Table 31: IQ8A – Minnesota, -0.35%/°C simple efficiency model, 180° azimuth, 20° tilt. Mo du le Power (W) D C : AC Rat i o A n n u a l E n e rgy (kWh) AC C apac ity Factor (%) Ye ar 1 Inve rte r C lipping loss (kWh) Ye ar 1 Inve rte r C lipping loss (%) Total Inverter C l ip ping in 25 Years ( %) 365 1.00 533.7 16.6 0.0 0.0 0.0 385 1.05 563.1 17.6 0.0 0.0 0.0 405 1.11 592.5 18.5 0.0 0.0 0.0 420 1.15 614.3 19.2 0.2 0.0 0.0 440 1.20 642.8 20.1 1.1 0.2 0.0 460 1.
Table 32: IQ8A – Newark, -0.35%/°C simple efficiency model, 180° azimuth, 20° tilt. Mo du le Power (W) D C : AC Rat i o A n n u a l E n e rgy (kWh) AC C apac ity Factor (%) Ye ar 1 Inve rte r C lipping loss (kWh) Ye ar 1 Inve rte r C lipping loss (%) Total Inverter C l ip ping in 25 Years ( %) 365 1.00 532.1 16.6 0.0 0.0 0.0 385 1.05 561.4 17.5 0.0 0.0 0.0 405 1.11 590.7 18.4 0.0 0.0 0.0 420 1.15 612.6 19.1 0.0 0.0 0.0 440 1.20 641.6 20.0 0.3 0.0 0.0 460 1.
IQ8H-240 simulation results The following tables shows the simulated single-module values for different DC:AC ratios on the IQ8H-240 Microinverter in locations covering across the United States, using a -0.35%/C simple efficiency model. The IQ8H-240 Microinverter has a peak output power rating of 384 VA. In this model, the module orientation is fixed at 180° azimuth, 20° tilt.
Table 34: IQ8H-240 – Los Angeles, -0.35%/°C simple efficiency model, 180° azimuth, 20° tilt. Mo du le Power (W) D C : AC Rat i o A n n u a l E n e rgy (kWh) AC C apac ity Factor (%) Ye ar 1 Inve rte r C lipping loss (kWh) Ye ar 1 Inve rte r C lipping loss (%) Total Inverter C l ip ping in 25 Years ( %) 385 1.00 703.6 20.9 0.0 0.0 0.0 405 1.05 740.2 22.0 0.0 0.0 0.0 420 1.09 767.8 22.8 0.0 0.0 0.0 440 1.15 804.4 23.9 0.0 0.0 0.0 460 1.20 840.8 25.0 0.3 0.0 0.
Table 35: IQ8H-240 – New York city, -0.35%/°C simple efficiency model, 180° azimuth, 20° tilt. Mo du le Power (W) D C : AC Rat i o A n n u a l E n e rgy (kWh) AC C apac ity Factor (%) Ye ar 1 Inve rte r C lipping loss (kWh) Ye ar 1 Inve rte r C lipping loss (%) Total Inverter C l ip ping in 25 Years ( %) 385 1.00 542.7 16.1 0.0 0.0 0.0 405 1.05 571.1 17.0 0.0 0.0 0.0 420 1.09 592.3 17.6 0.0 0.0 0.0 440 1.15 620.6 18.4 0.0 0.0 0.0 460 1.20 648.7 19.3 0.3 0.0 0.
Table 36: IQ8H-240 – Dallas, -0.35%/°C simple efficiency model, 180° azimuth, 20° tilt. Mo du le Power (W) D C : AC Rat i o A n n u a l E n e rgy (kWh) AC C apac ity Factor (%) Ye ar 1 Inve rte r C lipping loss (kWh) Ye ar 1 Inve rte r C lipping loss (%) Total Inverter C l ip ping in 25 Years ( %) 385 1.00 610.0 18.1 0.0 0.0 0.0 405 1.05 641.8 19.1 0.0 0.0 0.0 420 1.09 665.7 19.8 0.0 0.0 0.0 440 1.15 697.5 20.7 0.0 0.0 0.0 460 1.20 729.0 21.7 0.3 0.0 0.0 480 1.
Table 37: IQ8H-240 – Miami, -0.35%/°C simple efficiency model, 180° azimuth, 20° tilt. Mo du le Power (W) D C : AC Rat i o A n n u a l E n e rgy (kWh) AC C apac ity Factor (%) Ye ar 1 Inve rte r C lipping loss (kWh) Ye ar 1 Inve rte r C lipping loss (%) Total Inverter C l ip ping in 25 Years ( %) 385 1.00 649.3 19.3 0.0 0.0 0.0 405 1.05 683.2 20.3 0.0 0.0 0.0 420 1.09 708.6 21.1 0.0 0.0 0.0 440 1.15 742.4 22.1 0.0 0.0 0.0 460 1.20 776.1 23.1 0.2 0.0 0.0 480 1.
Table 38: IQ8H-240 – Phoenix, -0.35%/°C simple efficiency model, 180° azimuth, 20° tilt. Mo du le Power (W) D C : AC Rat i o A n n u a l E n e rgy (kWh) AC C apac ity Factor (%) Ye ar 1 Inve rte r C lipping loss (kWh) Ye ar 1 Inve rte r C lipping loss (%) Total Inverter C l ip ping in 25 Years ( %) 385 1.00 721.7 21.5 0.0 0.0 0.0 405 1.05 759.3 22.6 0.0 0.0 0.0 420 1.09 787.6 23.4 0.0 0.0 0.0 440 1.15 825.2 24.5 0.0 0.0 0.0 460 1.20 862.6 25.6 0.2 0.0 0.0 480 1.
Table 39: IQ8H-240 – Minnesota, -0.35%/°C simple efficiency model, 180° azimuth, 20° tilt. Mo du le Power (W) D C : AC Rat i o A n n u a l E n e rgy (kWh) AC C apac ity Factor (%) Ye ar 1 Inve rte r C lipping loss (kWh) Ye ar 1 Inve rte r C lipping loss (%) Total Inverter C l ip ping in 25 Years ( %) 385 1.00 560.2 16.7 0.0 0.0 0.0 405 1.05 589.4 17.5 0.0 0.0 0.0 420 1.09 611.3 18.2 0.0 0.0 0.0 440 1.15 640.4 19.0 0.2 0.0 0.0 460 1.20 668.9 19.9 0.9 0.1 0.0 480 1.
Table 40: IQ8H-240 – Newark, -0.35%/°C simple efficiency model, 180° azimuth, 20° tilt. Mo du le Power (W) D C : AC Rat i o A n n u a l E n e rgy (kWh) AC C apac ity Factor (%) Ye ar 1 Inve rte r C lipping loss (kWh) Ye ar 1 Inve rte r C lipping loss (%) Total Inverter C l ip ping in 25 Years ( %) 385 1.00 558.4 16.6 0.0 0.0 0.0 405 1.05 587.6 17.5 0.0 0.0 0.0 420 1.09 609.4 18.1 0.0 0.0 0.0 440 1.15 638.6 19.0 0.0 0.0 0.0 460 1.20 667.5 19.8 0.2 0.0 0.0 480 1.
IQ8H-208 simulation results The following tables shows the simulated single-module values for different DC:AC ratios on the IQ8H-208 Microinverter in locations covering across the United States, using a -0.35%/C simple efficiency model. The IQ8H-208 Microinverter has a peak output power rating of 366 VA and works only with 208V grid. In this model, the module orientation is fixed at 180° azimuth, 20° tilt.
Table 42: IQ8H-208 – Los Angeles, -0.35%/°C simple efficiency model, 180° azimuth, 20° tilt. Mo du le Power (W) D C : AC Rat i o A n n u a l E n e rgy (kWh) AC C apac ity Factor (%) Ye ar 1 Inve rte r C lipping loss (kWh) Ye ar 1 Inve rte r C lipping loss (%) Total Inverter C l ip ping in 25 Years ( %) 365 1.00 666.9 20.8 0.0 0.0 0.0 385 1.05 703.6 21.9 0.0 0.0 0.0 405 1.11 740.3 23.1 0.0 0.0 0.0 420 1.15 767.8 23.9 0.0 0.0 0.0 440 1.20 804.2 25.1 0.3 0.0 0.
Table 43: IQ8H-208 – New York city, -0.35%/°C simple efficiency model, 180° azimuth, 20° tilt. Mo du le Power (W) D C : AC Rat i o A n n u a l E n e rgy (kWh) AC C apac ity Factor (%) Ye ar 1 Inve rte r C lipping loss (kWh) Ye ar 1 Inve rte r C lipping loss (%) Total Inverter C l ip ping in 25 Years ( %) 365 1.00 514.4 16.0 0.0 0.0 0.0 385 1.05 542.8 16.9 0.0 0.0 0.0 405 1.11 571.1 17.8 0.0 0.0 0.0 420 1.15 592.3 18.5 0.0 0.0 0.0 440 1.20 620.4 19.4 0.3 0.0 0.
Table 44: IQ8H-208 – Dallas, -0.35%/°C simple efficiency model, 180° azimuth, 20° tilt. Mo du le Power (W) D C : AC Rat i o A n n u a l E n e rgy (kWh) AC C apac ity Factor (%) Ye ar 1 Inve rte r C lipping loss (kWh) Ye ar 1 Inve rte r C lipping loss (%) Total Inverter C l ip ping in 25 Years ( %) 365 1.00 578.2 18.0 0.0 0.0 0.0 385 1.05 610.0 19.0 0.0 0.0 0.0 405 1.11 641.8 20.0 0.0 0.0 0.0 420 1.15 665.7 20.8 0.0 0.0 0.0 440 1.20 697.2 21.7 0.3 0.0 0.0 460 1.
Table 45: IQ8H-208 – Miami, -0.35%/°C simple efficiency model, 180° azimuth, 20° tilt. Mo du le Power (W) D C : AC Rat i o A n n u a l E n e rgy (kWh) AC C apac ity Factor (%) Ye ar 1 Inve rte r C lipping loss (kWh) Ye ar 1 Inve rte r C lipping loss (%) Total Inverter C l ip ping in 25 Years ( %) 365 1.00 615.5 19.2 0.0 0.0 0.0 385 1.05 649.4 20.3 0.0 0.0 0.0 405 1.11 683.2 21.3 0.0 0.0 0.0 420 1.15 708.6 22.1 0.0 0.0 0.0 440 1.20 742.3 23.2 0.2 0.0 0.0 460 1.
Table 46: IQ8H-208 – Phoenix, -0.35%/°C simple efficiency model, 180° azimuth, 20° tilt. Mo du le Power (W) D C : AC Rat i o A n n u a l E n e rgy (kWh) AC C apac ity Factor (%) Ye ar 1 Inve rte r C lipping loss (kWh) Ye ar 1 Inve rte r C lipping loss (%) Total Inverter C l ip ping in 25 Years ( %) 365 1.00 684.1 21.3 0.0 0.0 0.0 385 1.05 721.8 22.5 0.0 0.0 0.0 405 1.11 759.4 23.7 0.0 0.0 0.0 420 1.15 787.6 24.6 0.0 0.0 0.0 440 1.20 825.0 25.7 0.2 0.0 0.0 460 1.
Table 47: IQ8H-208 – Minnesota, -0.35%/°C simple efficiency model, 180° azimuth, 20° tilt. Mo du le Power (W) D C : AC Rat i o A n n u a l E n e rgy (kWh) AC C apac ity Factor (%) Ye ar 1 Inve rte r C lipping loss (kWh) Ye ar 1 Inve rte r C lipping loss (%) Total Inverter C l ip ping in 25 Years ( %) 365 1.00 531.0 16.6 0.0 0.0 0.0 385 1.05 560.2 17.5 0.0 0.0 0.0 405 1.11 589.4 18.4 0.0 0.0 0.0 420 1.15 611.2 19.1 0.2 0.0 0.0 440 1.20 639.7 20.0 0.9 0.1 0.0 460 1.
Table 48: IQ8H-208 – Newark, -0.35%/°C simple efficiency model, 180° azimuth, 20° tilt. Mo du le Power (W) D C : AC Rat i o A n n u a l E n e rgy (kWh) AC C apac ity Factor (%) Ye ar 1 Inve rte r C lipping loss (kWh) Ye ar 1 Inve rte r C lipping loss (%) Total Inverter C l ip ping in 25 Years ( %) 365 1.00 529.3 16.5 0.0 0.0 0.0 385 1.05 558.5 17.4 0.0 0.0 0.0 405 1.11 587.6 18.3 0.0 0.0 0.0 420 1.15 609.5 19.0 0.0 0.0 0.0 440 1.20 638.4 19.9 0.3 0.0 0.0 460 1.
Conclusion The primary purpose of this paper is to provide a technical framework for discussion. Some common configurations of Enphase Inverters were simulated in NREL SAM to illustrate how various performance metrics change by varying DC:AC ratios. PV modules seldom produce power at their test condition power rating. This leads installers to pair PV modules with power ratings higher than the inverter power rating. In many locations, high DC:AC ratios may not result in significant clipping losses.