
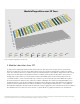
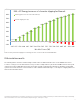
IQ8 PV Module Rating Larger Than Inverter Rating


5
©2022 Enphase Energy. All rights reserved. Enphase, the Enphase logo, IQ System Controller 2, IQ Battery, IQ Gateway, IQ Combiner, IQ Microinverter, Enphase Installer App,
and other trademarks or service names are the trademarks of Enphase Energy, Inc. Data subject to change.
Simulation tool and input parameters used
To provide some context on DC:AC ratios and assist in the decision-making process, energy performance was simulated
with NREL System Advisor Model (SAM) using the Simple Eciency Module Model (temperature coecient: -0.35%/°C
P
MP
) with TMY3 weather data. The L
total
was 2.5%, with 2% for the DC wiring loss and 0.5% for Diodes and connections
losses. These DC loss assumptions are very conservative. Real-world losses, can be higher, which in turn would decrease
resulting clipping losses. There are many tools that perform similar calculations, though NREL SAM supports parametric
simulations which helps given the large number of system congurations and locations in this simulation.
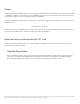
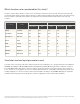
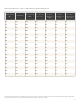
Location State
Irradiance (W/m
2
) Ambient temperature
Avg daily Max Min Avg Daily Max
DENVER COLORADO 768 1073 -32.2 14.7 30.6
LOS ANGELES CALIFORNIA 559 1000 -18.9 13.3 31.7
NEW YORK CITY NEW YORK 600 968 -15 13.6 36.7
DALLAS TEXAS 702 1003 -6.7 20 42
MIAMI FLORIDA 795 1034 10 26 31
PHOENIX ARIZONA 814 1149 2.2 30 44.4
BRAINERD MINNESOTA 578 982 -33 5.3 31
NEWARK NEW JERSEY 736 1058 -11 11.8 39
Which locations are considered for this study?
In order to capture all the climatic scenarios in US, a total of 8 locations have been selected. These 8 locations broadly
encapsulate all the climate extremes that US experiences. Among all the parameters that aects the Solar system energy
harvest, Irradiance and Temperature and the most important one and are listed below in the table for the selected
locations.