Why is my PV Module rating larger than my Inverter rating? JAN 2022 © 2022 Enphase Energy, Inc. All rights reserved. Enphase Energy®, the Enphase logo, Encharge, Enlighten, Enlighten Manager, Enpower, Ensemble, MyEnlighten, and other trademarks or service names are the trademarks of Enphase Energy, Inc. Other names are for informational purposes and may be trademarks of their respective owners.
Why is my PV Module rating larger than my Inverter rating? PV module and inverter selection are two of the most important decisions in PV system design. Ensuring that these components will work together is important from a technical, reliability, and economic perspective. Goals and design assumptions of different stakeholders can influence the decision-making process.
Theory Sizing starts by ensuring that PV modules are electrically compatible with the inverter. Enphase provides an online module compatibility calculator to determine electrical compatibility, purely based on the inverter DC input voltage and current ranges: https://enphase.com/en-us/support/module-compatibility.
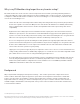
Chart 1 – Module degradation over 25 years 2. Module’s deviation from STC It’s important to understand that the module power ratings on their data sheets are based on DC power at STC. However, modules do not operate at STC all the time because STC stands for Standard Test Conditions. In simpler terms, STC stands for laboratory conditions and are specified by Irradiance at 1000W/m2, Temperature at 250 Celsius and Pressure at 1 atmosphere.
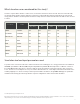
Which locations are considered for this study? In order to capture all the climatic scenarios in US, a total of 8 locations have been selected. These 8 locations broadly encapsulate all the climate extremes that the US experiences. Among all the parameters that affects the Solar system energy harvest, Irradiance and Temperature and the most important one and are listed below in the table for the selected locations.
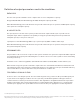
Definition of output parameters used in the simulations ENERGY YIELD The ratio of the system’s annual AC electric output in Year one to it’s nameplate DC capacity: Energy Yield (kWh/kW) = Net Annual Energy (AC kWh) ÷ Nameplate Capacity (DC kW) Where Net Annual Energy is the total annual electric generation in the first year of operation, and Nameplate Capacity is the system’s DC nameplate capacity.
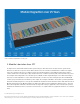
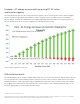
Example – AC energy increase with increasing DC AC ration and Inverter clipping Increasing DC:AC ratio increases AC energy, however there may be some loss of energy harvest due to Inverter clipping. The increased AC energy is always larger than the loss due to clipping, even at very high DC:AC ratios. Note that the Inverter clipping shown below is simulated first-year clipping at Newark for IQ8.
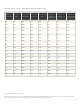
Table 1: IQ8 - Denver, -0.35%/°C simple efficiency model, 180° azimuth, 20° tilt. Mo d ule Power (W) DC: AC Rat i o E n e rgy Y i e l d ( k W h /k W ) C a pac ity Factor (%) Ye ar 1 Inve rte r Pe rformanc e C lipping loss Ratio (K Wh/ kW) Total Ye ar 1 Inverter Inve rte r C lipping loss Clipp ing in 25 Years ( %) (%) 245 1.00 1757.0 20.1 0.83 0.0 0.0 0.0% 255 1.04 1757.5 20.9 0.83 0.0 0.0 0.0% 270 1.10 1758.2 22.1 0.83 0.0 0.0 0.0% 280 1.14 1758.5 22.9 0.83 0.1 0.0 0.
Table 2: IQ8 – Los Angeles, -0.35%/°C simple efficiency model, 180° azimuth, 20° tilt. Mo d ule Power (W) DC: AC Rat i o E n e rgy Y i e l d ( k W h /k W ) AC C a pac ity Factor (%) Ye ar 1 Inve rte r Pe rformanc e C lipping loss Ratio (K Wh) Total Ye ar 1 Inverter Inve rte r C lipping loss Clip ping in 25 Years ( %) (%) 245 1.00 1823.8 20.8 0.81 0.0 0.0 0.0% 255 1.04 1824.3 21.7 0.81 0.0 0.0 0.0% 270 1.10 1824.9 23.0 0.81 0.0 0.0 0.0% 280 1.14 1825.3 23.8 0.81 0.0 0.
Table 3: IQ8 – New York city, -0.35%/°C simple efficiency model, 180° azimuth, 20° tilt. Mo d ule Power (W) DC: AC Rat i o E n e rgy Y i e l d ( k W h /k W ) C a pac ity Factor (%) Ye ar 1 Inve rte r Pe rformanc e C lipping loss Ratio (K Wh/ kW) Total Ye ar 1 Inverter Inve rte r C lipping loss Clipp ing in 25 Years ( %) (%) 245 1.00 1405.4 16.0 0.86 0.0 0.0 0.0% 255 1.04 1405.9 16.7 0.86 0.0 0.0 0.0% 270 1.10 1406.6 17.7 0.86 0.0 0.0 0.0% 280 1.14 1407.0 18.4 0.86 0.1 0.
Table 4: IQ8 – Dallas, -0.35%/°C simple efficiency model, 180° azimuth, 20° tilt. Mo d ule Power (W) DC: AC Rat i o E n e rgy Y i e l d ( k W h /k W ) AC C a pac ity Factor (%) Ye ar 1 Inve rte r Pe rformanc e C lipping loss Ratio (K Wh) Total Ye ar 1 Inverter Inve rte r C lipping loss Clip ping in 25 Years ( %) (%) 245 1.00 1580.3 18.0 0.83 0.0 0.0 0.0% 255 1.04 1580.8 18.8 0.83 0.0 0.0 0.0% 270 1.10 1581.5 19.9 0.83 0.0 0.0 0.0% 280 1.14 1581.8 20.6 0.83 0.0 0.0 0.
Table 5: IQ8 – Miami, -0.35%/°C simple efficiency model, 180° azimuth, 20° tilt. Mo d ule Power (W) DC: AC Rat i o E n e rgy Y i e l d ( k W h /k W ) C a pac ity Factor (%) Ye ar 1 Inve rte r Pe rformanc e C lipping loss Ratio (K Wh/ kW) Total Ye ar 1 Inverter Inve rte r C lipping loss Clipp ing in 25 Years ( %) (%) 245 1.00 1682.7 19.2 0.82 0.0 0.0 0.0% 255 1.04 1683.2 20.0 0.82 0.0 0.0 0.0% 270 1.10 1683.8 21.2 0.82 0.0 0.0 0.0% 280 1.14 1684.2 22.0 0.82 0.1 0.0 0.
Table 6: IQ8 – Phoenix, -0.35%/°C simple efficiency model, 180° azimuth, 20° tilt. Mo d ule Power (W) DC: AC Rat i o E n e rgy Y i e l d ( k W h /k W ) AC C a pac ity Factor (%) Ye ar 1 Inve rte r Pe rformanc e C lipping loss Ratio (K Wh) Total Ye ar 1 Inverter Inve rte r C lipping loss Clip ping in 25 Years ( %) (%) 245 1.00 1870.7 21.4 0.80 0.0 0.0 0.0% 255 1.04 1871.2 22.2 0.80 0.0 0.0 0.0% 270 1.10 1871.9 23.5 0.80 0.0 0.0 0.0% 280 1.14 1872.3 24.4 0.80 0.0 0.0 0.
Table 7: IQ8 – Minnesota, -0.35%/°C simple efficiency model, 180° azimuth, 20° tilt. Mo d ule Power (W) DC: AC Rat i o E n e rgy Y i e l d ( k W h /k W ) C a pac ity Factor (%) Ye ar 1 Inve rte r Pe rformanc e C lipping loss Ratio (K Wh/ kW) Total Ye ar 1 Inverter Inve rte r C lipping loss Clipp ing in 25 Years ( %) (%) 245 1.00 1450.9 16.6 0.87 0.0 0.0 0.0% 255 1.04 1451.4 17.2 0.87 0.0 0.0 0.0% 270 1.10 1452.0 18.3 0.87 0.1 0.0 0.0% 280 1.14 1452.1 18.9 0.87 0.3 0.
Table 8: IQ8 – Newark, -0.35%/°C simple efficiency model, 180° azimuth, 20° tilt. Mo d ule Power (W) DC: AC Rat i o E n e rgy Y i e l d ( k W h /k W ) AC C a pac ity Factor (%) Ye ar 1 Inve rte r Pe rformanc e C lipping loss Ratio (K Wh) Total Ye ar 1 Inverter Inve rte r C lipping loss Clip ping in 25 Years ( %) (%) 245 1.00 1446.4 16.5 0.84 0.0 0.0 0.0% 255 1.04 1446.9 17.2 0.84 0.0 0.0 0.0% 270 1.10 1447.6 18.2 0.84 0.0 0.0 0.0% 280 1.14 1447.9 18.9 0.84 0.0 0.0 0.
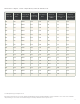
IQ8+ simulation results The following tables indicate example simulated single-module year-one inverter capacity factor, clipping and energy yield for various DC:AC ratios on the IQ 8+ Microinverter in various US locations, using a -0.35%/C simple efficiency model. The IQ 8+ Microinverter has a peak output power rating of 300 VA. In this model, the module orientation is fixed at 180° azimuth, 20° tilt.
Table 10: IQ8+ – Los Angeles, -0.35%/°C simple efficiency model, 180° azimuth, 20° tilt. Mo d ule Power (W) DC: AC Rat i o E n e rgy Y i e l d ( k W h /k W ) AC C a pac ity Factor (%) Ye ar 1 Inve rte r Pe rformanc e C lipping loss Ratio (K Wh) Total Ye ar 1 Inverter Inve rte r C lipping loss Clip ping in 25 Years ( %) (%) 300 1.00 1825.1 20.8 0.81 0.0 0.0 0.0% 315 1.05 1825.6 21.9 0.81 0.0 0.0 0.0% 330 1.10 1826.1 22.9 0.81 0.0 0.0 0.0% 345 1.15 1826.4 24.0 0.81 0.0 0.
Table 11: IQ8+ – New York City, -0.35%/°C simple efficiency model, 180° azimuth, 20° tilt. Mo d ule Power (W) DC: AC Rat i o E n e rgy Y i e l d ( k W h /k W ) C a pac ity Factor (%) Ye ar 1 Inve rte r Pe rformanc e C lipping loss Ratio (K Wh/ kW) Total Ye ar 1 Inverter Inve rte r C lipping loss Clipp ing in 25 Years ( %) (%) 300 1.00 1407.0 16.1 0.86 0.0 0.0 0.0% 315 1.05 1407.5 16.9 0.86 0.0 0.0 0.0% 330 1.10 1408.0 17.7 0.86 0.0 0.0 0.0% 345 1.15 1408.3 18.5 0.86 0.
Table 12: IQ8+ – Dallas, -0.35%/°C simple efficiency model, 180° azimuth, 20° tilt. Mo d ule Power (W) DC: AC Rat i o E n e rgy Y i e l d ( k W h /k W ) AC C a pac ity Factor (%) Ye ar 1 Inve rte r Pe rformanc e C lipping loss Ratio (K Wh) Total Ye ar 1 Inverter Inve rte r C lipping loss Clip ping in 25 Years ( %) (%) 300 1.00 1581.8 18.1 0.83 0.0 0.0 0.0% 315 1.05 1582.3 19.0 0.83 0.0 0.0 0.0% 330 1.10 1582.7 19.9 0.83 0.0 0.0 0.0% 345 1.15 1583.1 20.8 0.83 0.1 0.0 0.
Table 13: IQ8+ – Miami, -0.35%/°C simple efficiency model, 180° azimuth, 20° tilt. Mo d ule Power (W) DC: AC Rat i o E n e rgy Y i e l d ( k W h /k W ) C a pac ity Factor (%) Ye ar 1 Inve rte r Pe rformanc e C lipping loss Ratio (K Wh/ kW) Total Ye ar 1 Inverter Inve rte r C lipping loss Clipp ing in 25 Years ( %) (%) 300 1.00 1684.1 19.2 0.82 0.0 0.0 0.0% 315 1.05 1684.6 20.2 0.82 0.0 0.0 0.0% 330 1.10 1685.0 21.2 0.82 0.0 0.0 0.0% 345 1.15 1685.4 22.1 0.82 0.1 0.0 0.
Table 14: IQ8+ – Phoenix, -0.35%/°C simple efficiency model, 180° azimuth, 20° tilt. Mo d ule Power (W) DC: AC Rat i o E n e rgy Y i e l d ( k W h /k W ) AC C a pac ity Factor (%) Ye ar 1 Inve rte r Pe rformanc e C lipping loss Ratio (K Wh) Total Ye ar 1 Inverter Inve rte r C lipping loss Clip ping in 25 Years ( %) (%) 300 1.00 1872.1 21.4 0.80 0.0 0.0 0.0% 315 1.05 1872.7 22.4 0.80 0.0 0.0 0.0% 330 1.10 1873.1 23.5 0.80 0.0 0.0 0.0% 345 1.15 1873.5 24.6 0.80 0.1 0.0 0.
Table 15: IQ8+ – Minnesota, -0.35%/°C simple efficiency model, 180° azimuth, 20° tilt. Mo d ule Power (W) DC: AC Rat i o E n e rgy Y i e l d ( k W h /k W ) C a pac ity Factor (%) Ye ar 1 Inve rte r Pe rformanc e C lipping loss Ratio (K Wh/ kW) Total Ye ar 1 Inverter Inve rte r C lipping loss Clipp ing in 25 Years ( %) (%) 300 1.00 1452.5 16.6 0.87 0.0 0.0 0.0% 315 1.05 1453.0 17.4 0.87 0.0 0.0 0.0% 330 1.10 1453.3 18.2 0.87 0.1 0.0 0.0% 345 1.15 1453.3 19.1 0.87 0.4 0.
Table 16: IQ8+ – Newark, -0.35%/°C simple efficiency model, 180° azimuth, 20° tilt. Mo d ule Power (W) DC: AC Rat i o E n e rgy Y i e l d ( k W h /k W ) AC C a pac ity Factor (%) Ye ar 1 Inve rte r Pe rformanc e C lipping loss Ratio (K Wh) Total Ye ar 1 Inverter Inve rte r C lipping loss Clip ping in 25 Years ( %) (%) 300 1.00 1447.9 16.5 0.84 0.0 0.0 0.0% 315 1.05 1448.4 17.4 0.84 0.0 0.0 0.0% 330 1.10 1448.8 18.2 0.84 0.0 0.0 0.0% 345 1.15 1449.2 19.0 0.84 0.0 0.0 0.
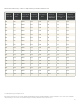
IQ8M simulation results The following tables indicate example simulated single-module year-one inverter capacity factor, clipping and energy yield for various DC:AC ratios on the IQ8M Microinverter in various US locations, using a -0.35%/C simple efficiency model. The IQ8M Microinverter has a peak output power rating of 330 VA. In this model, the module orientation is fixed at 180° azimuth, 20° tilt.
Table 18: IQ8M – Los Angeles, -0.35%/°C simple efficiency model, 180° azimuth, 20° tilt. Mo d ule Power (W) DC: AC Rat i o E n e rgy Y i e l d ( k W h /k W ) AC C a pac ity Factor (%) Ye ar 1 Inve rte r Pe rformanc e C lipping loss Ratio (K Wh) Total Ye ar 1 Inverter Inve rte r C lipping loss Clip ping in 25 Years ( %) (%) 330 1.00 1825.7 20.8 0.81 0.0 0.0 0.0% 345 1.05 1826.1 21.8 0.81 0.0 0.0 0.0% 365 1.11 1826.6 23.1 0.81 0.0 0.0 0.0% 380 1.15 1826.8 24.0 0.81 0.1 0.
Table 19: IQ8M – New York City, -0.35%/°C simple efficiency model, 180° azimuth, 20° tilt. Mo d ule Power (W) DC: AC Rat i o E n e rgy Y i e l d ( k W h /k W ) C a pac ity Factor (%) Ye ar 1 Inve rte r Pe rformanc e C lipping loss Ratio (K Wh/ kW) Total Ye ar 1 Inverter Inve rte r C lipping loss Clipp ing in 25 Years ( %) (%) 330 1.00 1407.7 16.1 0.86 0.0 0.0 0.0% 345 1.05 1408.1 16.8 0.86 0.0 0.0 0.0% 365 1.11 1408.6 17.8 0.86 0.0 0.0 0.0% 380 1.15 1408.8 18.5 0.86 0.
Table 20: IQ8M – Dallas, -0.35%/°C simple efficiency model, 180° azimuth, 20° tilt. Mo d ule Power (W) DC: AC Rat i o E n e rgy Y i e l d ( k W h /k W ) AC C a pac ity Factor (%) Ye ar 1 Inve rte r Pe rformanc e C lipping loss Ratio (K Wh) Total Ye ar 1 Inverter Inve rte r C lipping loss Clip ping in 25 Years ( %) (%) 330 1.00 1582.4 18.1 0.83 0.0 0.0 0.0% 345 1.05 1582.8 18.9 0.83 0.0 0.0 0.0% 365 1.11 1583.3 20.0 0.83 0.0 0.0 0.0% 380 1.15 1583.6 20.8 0.83 0.1 0.0 0.
Table 21: IQ8M – Miami, -0.35%/°C simple efficiency model, 180° azimuth, 20° tilt. Mo d ule Power (W) DC: AC Rat i o E n e rgy Y i e l d ( k W h /k W ) C a pac ity Factor (%) Ye ar 1 Inve rte r Pe rformanc e C lipping loss Ratio (K Wh/ kW) Total Ye ar 1 Inverter Inve rte r C lipping loss Clipp ing in 25 Years ( %) (%) 330 1.00 1684.7 19.2 0.82 0.0 0.0 0.0% 345 1.05 1685.1 20.1 0.82 0.0 0.0 0.0% 365 1.11 1685.6 21.3 0.82 0.0 0.0 0.0% 380 1.15 1685.8 22.2 0.82 0.1 0.0 0.
Table 22: IQ8M – Phoenix, -0.35%/°C simple efficiency model, 180° azimuth, 20° tilt. Mo d ule Power (W) DC: AC Rat i o E n e rgy Y i e l d ( k W h /k W ) AC C a pac ity Factor (%) Ye ar 1 Inve rte r Pe rformanc e C lipping loss Ratio (K Wh) Total Ye ar 1 Inverter Inve rte r C lipping loss Clip ping in 25 Years ( %) (%) 330 1.00 1872.7 21.4 0.80 0.0 0.0 0.0% 345 1.05 1873.2 22.4 0.80 0.0 0.0 0.0% 365 1.11 1873.7 23.7 0.80 0.0 0.0 0.0% 380 1.15 1874.0 24.6 0.80 0.1 0.0 0.
Table 23: IQ8M – Minnesota, -0.35%/°C simple efficiency model, 180° azimuth, 20° tilt. Mo d ule Power (W) DC: AC Rat i o E n e rgy Y i e l d ( k W h /k W ) C a pac ity Factor (%) Ye ar 1 Inve rte r Pe rformanc e C lipping loss Ratio (K Wh/ kW) Total Ye ar 1 Inverter Inve rte r C lipping loss Clipp ing in 25 Years ( %) (%) 330 1.00 1453.1 16.6 0.87 0.0 0.0 0.0% 345 1.05 1453.5 17.3 0.87 0.0 0.0 0.0% 365 1.11 1453.9 18.4 0.87 0.1 0.0 0.0% 380 1.15 1453.8 19.1 0.87 0.5 0.
Table 24: IQ8M – Newark, -0.35%/°C simple efficiency model, 180° azimuth, 20° tilt. Mo d ule Power (W) DC: AC Rat i o E n e rgy Y i e l d ( k W h /k W ) AC C a pac ity Factor (%) Ye ar 1 Inve rte r Pe rformanc e C lipping loss Ratio (K Wh) Total Ye ar 1 Inverter Inve rte r C lipping loss Clip ping in 25 Years ( %) (%) 330 1.00 1448.5 16.5 0.84 0.0 0.0 0.0% 345 1.05 1448.9 17.3 0.84 0.0 0.0 0.0% 365 1.11 1449.4 18.3 0.84 0.0 0.0 0.0% 380 1.15 1449.7 19.1 0.84 0.0 0.0 0.
IQ8A simulation results The following tables indicate example simulated single-module year-one inverter capacity factor, clipping and energy yield for various DC:AC ratios on the IQ8A Microinverter in various US locations, using a -0.35%/C simple efficiency model. The IQ8A Microinverter has a peak output power rating of 366 VA. In this model, the module orientation is fixed at 180° azimuth, 20° tilt.
Table 26: IQ8A – Los Angeles, -0.35%/°C simple efficiency model, 180° azimuth, 20° tilt. Mo d ule Power (W) DC: AC Rat i o E n e rgy Y i e l d ( k W h /k W ) AC C a pac ity Factor (%) Ye ar 1 Inve rte r Pe rformanc e C lipping loss Ratio (K Wh) Total Ye ar 1 Inverter Inve rte r C lipping loss Clip ping in 25 Years ( %) (%) 365 1.00 1836.7 20.9 0.82 0.0 0.0 0.0% 385 1.05 1837.0 22.1 0.82 0.0 0.0 0.0% 405 1.11 1837.3 23.2 0.82 0.0 0.0 0.0% 420 1.15 1837.5 24.1 0.82 0.1 0.
Table 27: IQ8A – New York city, -0.35%/°C simple efficiency model, 180° azimuth, 20° tilt. Mo d ule Power (W) DC: AC Rat i o E n e rgy Y i e l d ( k W h /k W ) C a pac ity Factor (%) Ye ar 1 Inve rte r Pe rformanc e C lipping loss Ratio (K Wh/ kW) Total Ye ar 1 Inverter Inve rte r C lipping loss Clipp ing in 25 Years ( %) (%) 365 1.00 1416.7 16.1 0.87 0.0 0.0 0.0% 385 1.05 1417.1 17.0 0.87 0.0 0.0 0.0% 405 1.11 1417.4 17.9 0.87 0.0 0.0 0.0% 420 1.15 1417.5 18.6 0.87 0.
Table 28: IQ8A – Dallas, -0.35%/°C simple efficiency model, 180° azimuth, 20° tilt. Mo d ule Power (W) DC: AC Rat i o E n e rgy Y i e l d ( k W h /k W ) AC C a pac ity Factor (%) Ye ar 1 Inve rte r Pe rformanc e C lipping loss Ratio (K Wh) Total Ye ar 1 Inverter Inve rte r C lipping loss Clip ping in 25 Years ( %) (%) 365 1.00 1592.3 18.1 0.83 0.0 0.0 0.0% 385 1.05 1592.6 19.1 0.83 0.0 0.0 0.0% 405 1.11 1593.0 20.1 0.83 0.0 0.0 0.0% 420 1.15 1593.1 20.9 0.83 0.1 0.0 0.
Table 29: IQ8A – Miami, -0.35%/°C simple efficiency model, 180° azimuth, 20° tilt. Mo d ule Power (W) DC: AC Rat i o E n e rgy Y i e l d ( k W h /k W ) C a pac ity Factor (%) Ye ar 1 Inve rte r Pe rformanc e C lipping loss Ratio (K Wh/ kW) Total Ye ar 1 Inverter Inve rte r C lipping loss Clipp ing in 25 Years ( %) (%) 365 1.00 1695.0 19.3 0.82 0.0 0.0 0.0% 385 1.05 1695.4 20.4 0.82 0.0 0.0 0.0% 405 1.11 1695.7 21.4 0.82 0.0 0.0 0.0% 420 1.15 1695.8 22.2 0.82 0.1 0.0 0.
Table 30: IQ8A – Phoenix, -0.35%/°C simple efficiency model, 180° azimuth, 20° tilt. Mo d ule Power (W) DC: AC Rat i o E n e rgy Y i e l d ( k W h /k W ) AC C a pac ity Factor (%) Ye ar 1 Inve rte r Pe rformanc e C lipping loss Ratio (K Wh) Total Ye ar 1 Inverter Inve rte r C lipping loss Clip ping in 25 Years ( %) (%) 365 1.00 1884.0 21.4 0.80 0.0 0.0 0.0% 385 1.05 1884.4 22.6 0.80 0.0 0.0 0.0% 405 1.11 1884.7 23.8 0.80 0.0 0.0 0.0% 420 1.15 1884.9 24.7 0.80 0.1 0.0 0.
Table 31: IQ8A – Minnesota, -0.35%/°C simple efficiency model, 180° azimuth, 20° tilt. Mo d ule Power (W) DC: AC Rat i o E n e rgy Y i e l d ( k W h /k W ) C a pac ity Factor (%) Ye ar 1 Inve rte r Pe rformanc e C lipping loss Ratio (K Wh/ kW) Total Ye ar 1 Inverter Inve rte r C lipping loss Clipp ing in 25 Years ( %) (%) 365 1.00 1462.3 16.6 0.88 0.0 0.0 0.0% 385 1.05 1462.7 17.6 0.88 0.0 0.0 0.0% 405 1.11 1462.9 18.5 0.88 0.1 0.0 0.0% 420 1.15 1462.7 19.2 0.88 0.5 0.
Table 32: IQ8A – Newark, -0.35%/°C simple efficiency model, 180° azimuth, 20° tilt. Mo d ule Power (W) DC: AC Rat i o E n e rgy Y i e l d ( k W h /k W ) AC C a pac ity Factor (%) Ye ar 1 Inve rte r Pe rformanc e C lipping loss Ratio (K Wh) Total Ye ar 1 Inverter Inve rte r C lipping loss Clip ping in 25 Years ( %) (%) 365 1.00 1457.7 16.6 0.85 0.0 0.0 0.0% 385 1.05 1458.1 17.5 0.85 0.0 0.0 0.0% 405 1.11 1458.4 18.4 0.85 0.0 0.0 0.0% 420 1.15 1458.6 19.1 0.85 0.0 0.0 0.
IQ8H-240 simulation results The following tables indicate example simulated single-module year-one inverter capacity factor, clipping and energy yield for various DC:AC ratios on the IQ8H-240 Microinverter in various US locations, using a -0.35%/C simple efficiency model. The IQ8H-240 Microinverter has a peak output power rating of 384 VA. In this model, the module orientation is fixed at 180° azimuth, 20° tilt.
Table 34: IQ8H-240 – Los Angeles, -0.35%/°C simple efficiency model, 180° azimuth, 20° tilt. Mo d ule Power (W) DC: AC Rat i o E n e rgy Y i e l d ( k W h /k W ) AC C a pac ity Factor (%) Ye ar 1 Inve rte r Pe rformanc e C lipping loss Ratio (K Wh) Total Ye ar 1 Inverter Inve rte r C lipping loss Clip ping in 25 Years ( %) (%) 385 1.00 1827.4 20.9 0.81 0.0 0.0 0.0% 405 1.05 1827.8 22.0 0.81 0.0 0.0 0.0% 420 1.09 1828.0 22.8 0.81 0.0 0.0 0.0% 440 1.15 1828.2 23.9 0.81 0.
Table 35: IQ8H-240 – New York city, -0.35%/°C simple efficiency model, 180° azimuth, 20° tilt. Mo d ule Power (W) DC: AC Rat i o E n e rgy Y i e l d ( k W h /k W ) C a pac ity Factor (%) Ye ar 1 Inve rte r Pe rformanc e C lipping loss Ratio (K Wh/ kW) Total Ye ar 1 Inverter Inve rte r C lipping loss Clipp ing in 25 Years ( %) (%) 385 1.00 1409.7 16.1 0.86 0.0 0.0 0.0% 405 1.05 1410.0 17.0 0.86 0.0 0.0 0.0% 420 1.09 1410.2 17.6 0.86 0.0 0.0 0.0% 440 1.15 1410.4 18.4 0.
Table 36: IQ8H-240 – Dallas, -0.35%/°C simple efficiency model, 180° azimuth, 20° tilt. Mo d ule Power (W) DC: AC Rat i o E n e rgy Y i e l d ( k W h /k W ) AC C a pac ity Factor (%) Ye ar 1 Inve rte r Pe rformanc e C lipping loss Ratio (K Wh) Total Ye ar 1 Inverter Inve rte r C lipping loss Clip ping in 25 Years ( %) (%) 385 1.00 1584.3 18.1 0.83 0.0 0.0 0.0% 405 1.05 1584.7 19.1 0.83 0.0 0.0 0.0% 420 1.09 1584.9 19.8 0.83 0.0 0.0 0.0% 440 1.15 1585.1 20.7 0.83 0.0 0.
Table 37: IQ8H-240 – Miami, -0.35%/°C simple efficiency model, 180° azimuth, 20° tilt. Mo d ule Power (W) DC: AC Rat i o E n e rgy Y i e l d ( k W h /k W ) C a pac ity Factor (%) Ye ar 1 Inve rte r Pe rformanc e C lipping loss Ratio (K Wh/ kW) Total Ye ar 1 Inverter Inve rte r C lipping loss Clipp ing in 25 Years ( %) (%) 385 1.00 1686.5 19.3 0.82 0.0 0.0 0.0% 405 1.05 1686.8 20.3 0.82 0.0 0.0 0.0% 420 1.09 1687.1 21.1 0.82 0.0 0.0 0.0% 440 1.15 1687.3 22.1 0.82 0.1 0.
Table 38: IQ8H-240 – Phoenix, -0.35%/°C simple efficiency model, 180° azimuth, 20° tilt. Mo d ule Power (W) DC: AC Rat i o E n e rgy Y i e l d ( k W h /k W ) AC C a pac ity Factor (%) Ye ar 1 Inve rte r Pe rformanc e C lipping loss Ratio (K Wh) Total Ye ar 1 Inverter Inve rte r C lipping loss Clip ping in 25 Years ( %) (%) 385 1.00 1874.6 21.5 0.80 0.0 0.0 0.0% 405 1.05 1874.9 22.6 0.80 0.0 0.0 0.0% 420 1.09 1875.2 23.4 0.80 0.0 0.0 0.0% 440 1.15 1875.4 24.5 0.80 0.0 0.
Table 39: IQ8H-240 – Minnesota, -0.35%/°C simple efficiency model, 180° azimuth, 20° tilt. Mo d ule Power (W) DC: AC Rat i o E n e rgy Y i e l d ( k W h /k W ) C a pac ity Factor (%) Ye ar 1 Inve rte r Pe rformanc e C lipping loss Ratio (K Wh/ kW) Total Ye ar 1 Inverter Inve rte r C lipping loss Clipp ing in 25 Years ( %) (%) 385 1.00 1455.0 16.7 0.87 0.0 0.0 0.0% 405 1.05 1455.4 17.5 0.87 0.0 0.0 0.0% 420 1.09 1455.5 18.2 0.87 0.1 0.0 0.0% 440 1.15 1455.4 19.0 0.87 0.
Table 40: IQ8H-240 – Newark, -0.35%/°C simple efficiency model, 180° azimuth, 20° tilt. Mo d ule Power (W) DC: AC Rat i o E n e rgy Y i e l d ( k W h /k W ) AC C a pac ity Factor (%) Ye ar 1 Inve rte r Pe rformanc e C lipping loss Ratio (K Wh) Total Ye ar 1 Inverter Inve rte r C lipping loss Clip ping in 25 Years ( %) (%) 385 1.00 1450.5 16.6 0.84 0.0 0.0 0.0% 405 1.05 1450.8 17.5 0.84 0.0 0.0 0.0% 420 1.09 1451.0 18.1 0.84 0.0 0.0 0.0% 440 1.15 1451.3 19.0 0.84 0.0 0.
IQ8H-208 simulation results The following tables indicate example simulated single-module year-one inverter capacity factor, clipping and energy yield for various DC:AC ratios on the IQ8H-208 Microinverter in various US locations, using a -0.35%/C simple efficiency model. The IQ8H-208 Microinverter has a peak output power rating of 366 VA and works only with 208V grid. In this model, the module orientation is fixed at 180° azimuth, 20° tilt.
Table 42: IQ8H-208 – Los Angeles, -0.35%/°C simple efficiency model, 180° azimuth, 20° tilt. Mo d ule Power (W) DC: AC Rat i o E n e rgy Y i e l d ( k W h /k W ) AC C a pac ity Factor (%) Ye ar 1 Inve rte r Pe rformanc e C lipping loss Ratio (K Wh) Total Ye ar 1 Inverter Inve rte r C lipping loss Clip ping in 25 Years ( %) (%) 365 1.00 1827.2 20.8 0.81 0.0 0.0 0.0% 385 1.05 1827.6 21.9 0.81 0.0 0.0 0.0% 405 1.11 1827.9 23.1 0.81 0.0 0.0 0.0% 420 1.15 1828.1 23.9 0.81 0.
Table 43: IQ8H-208 – New York city, -0.35%/°C simple efficiency model, 180° azimuth, 20° tilt. Mo d ule Power (W) DC: AC Rat i o E n e rgy Y i e l d ( k W h /k W ) C a pac ity Factor (%) Ye ar 1 Inve rte r Pe rformanc e C lipping loss Ratio (K Wh/ kW) Total Ye ar 1 Inverter Inve rte r C lipping loss Clipp ing in 25 Years ( %) (%) 365 1.00 1409.4 16.0 0.86 0.0 0.0 0.0% 385 1.05 1409.8 16.9 0.86 0.0 0.0 0.0% 405 1.11 1410.1 17.8 0.86 0.0 0.0 0.0% 420 1.15 1410.3 18.5 0.
Table 44: IQ8H-208 – Dallas, -0.35%/°C simple efficiency model, 180° azimuth, 20° tilt. Mo d ule Power (W) DC: AC Rat i o E n e rgy Y i e l d ( k W h /k W ) AC C a pac ity Factor (%) Ye ar 1 Inve rte r Pe rformanc e C lipping loss Ratio (K Wh) Total Ye ar 1 Inverter Inve rte r C lipping loss Clip ping in 25 Years ( %) (%) 365 1.00 1584.1 18.0 0.83 0.0 0.0 0.0% 385 1.05 1584.5 19.0 0.83 0.0 0.0 0.0% 405 1.11 1584.8 20.0 0.83 0.0 0.0 0.0% 420 1.15 1585.0 20.8 0.83 0.0 0.
Table 45: IQ8H-208 – Miami, -0.35%/°C simple efficiency model, 180° azimuth, 20° tilt. Mo d ule Power (W) DC: AC Rat i o E n e rgy Y i e l d ( k W h /k W ) C a pac ity Factor (%) Ye ar 1 Inve rte r Pe rformanc e C lipping loss Ratio (K Wh/ kW) Total Ye ar 1 Inverter Inve rte r C lipping loss Clipp ing in 25 Years ( %) (%) 365 1.00 1686.3 19.2 0.82 0.0 0.0 0.0% 385 1.05 1686.7 20.3 0.82 0.0 0.0 0.0% 405 1.11 1687.0 21.3 0.82 0.0 0.0 0.0% 420 1.15 1687.1 22.1 0.82 0.1 0.
Table 46: IQ8H-208 – Phoenix, -0.35%/°C simple efficiency model, 180° azimuth, 20° tilt. Mo d ule Power (W) DC: AC Rat i o E n e rgy Y i e l d ( k W h /k W ) AC C a pac ity Factor (%) Ye ar 1 Inve rte r Pe rformanc e C lipping loss Ratio (K Wh) Total Ye ar 1 Inverter Inve rte r C lipping loss Clip ping in 25 Years ( %) (%) 365 1.00 1874.3 21.3 0.80 0.0 0.0 0.0% 385 1.05 1874.7 22.5 0.80 0.0 0.0 0.0% 405 1.11 1875.1 23.7 0.80 0.0 0.0 0.0% 420 1.15 1875.2 24.6 0.80 0.0 0.
Table 47: IQ8H-208 – Minnesota, -0.35%/°C simple efficiency model, 180° azimuth, 20° tilt. Mo d ule Power (W) DC: AC Rat i o E n e rgy Y i e l d ( k W h /k W ) C a pac ity Factor (%) Ye ar 1 Inve rte r Pe rformanc e C lipping loss Ratio (K Wh/ kW) Total Ye ar 1 Inverter Inve rte r C lipping loss Clipp ing in 25 Years ( %) (%) 365 1.00 1454.8 16.6 0.87 0.0 0.0 0.0% 385 1.05 1455.1 17.5 0.87 0.0 0.0 0.0% 405 1.11 1455.4 18.4 0.87 0.1 0.0 0.0% 420 1.15 1455.3 19.1 0.87 0.
Table 48: IQ8H-208 – Newark, -0.35%/°C simple efficiency model, 180° azimuth, 20° tilt. Mo d ule Power (W) DC: AC Rat i o E n e rgy Y i e l d ( k W h /k W ) AC C a pac ity Factor (%) Ye ar 1 Inve rte r Pe rformanc e C lipping loss Ratio (K Wh) Total Ye ar 1 Inverter Inve rte r C lipping loss Clip ping in 25 Years ( %) (%) 365 1.00 1450.2 16.5 0.84 0.0 0.0 0.0% 385 1.05 1450.6 17.4 0.84 0.0 0.0 0.0% 405 1.11 1450.9 18.3 0.84 0.0 0.0 0.0% 420 1.15 1451.1 19.0 0.84 0.0 0.
Conclusion The primary purpose of this paper is to provide a technical framework for discussion. Some common configurations of Enphase Inverters were simulated in NREL SAM to illustrate how various performance metrics change by varying DC:AC ratios. PV modules seldom produce power at their test condition power rating. This leads installers to pair PV modules with power ratings higher than the inverter power rating. In many locations, high DC:AC ratios may not result in significant clipping losses.