
System information


Blastware Compliance Module
___________________________________________________
4–80 Blastware Operator Manual
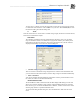
d. Add
Click on the Add button to include Events from the current directory into the Scaled Distance
Event list window. Events can also be added manually by highlighting them in the Event Manager
and then clicking on the Add button within Scaled Distance.
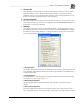
e. Also Plot 95% of Line
Input the confidence level in this box. Refer to the technical and “rule of thumb” description in
Section 3.3.2, Part b. Algorithms, subsection (2).
4.3.2 Scaled Distance - Technical Description
This section describes the formulas used by Blastware to calculate scaled distance.
a. Scaled Distance
(1)
Dividing the distance from the blast by the square or cube root of the charge weight is familiar to
the blasting industry and is known as the Scaled Distance. It arises from the fact that surface blast
energy dissipates in all directions; i.e., it goes into a circular or spherical area surrounding the blast
site.
(2)
The actual value of the scaled distance depends on the units of measure used in the equation,
SD = D/W
r
where the distance D, and weight of charge W, may be expressed in either Metric or Imperial units
and r is either 1/2 or 1/3 depending on whether square or cube root is used. (Air pressure always
uses cube root scaling.)
(3)
There is a correlation between scaled distance and particle velocity. If enough PPV (or pressure) -
SD sample pairs are available, statistical analysis can be used to derive an expression to show this
dependence. It is of the form,
P = H(SD)
-ß
where
P = PPV is peak particle velocity (or air pressure),
H is the velocity (or air pressure) axis intercept i.e., P when SD = 1,
SD is the scaled distance,
ß is the slope of the curve, i.e., the negative decay exponent
(4)
This is an equation for a curve of the form y = ax
b
. (In the case of air pressure in dB, the equation
is of the form P = a+b logSD where P is pressure.) If the logarithm is taken of both sides we have
log y = log a + b log x which gives a linear xy relationship when plotted using log-log scales.
Since the curve has been reduced to a straight line, we can perform linear regression analysis to
find its equation. Linear regression is a statistical tool for determining a line of fit through a
distribution of points on a graph.
b. Algorithms
(1)
Linear regression is used to find the equation of a straight line of the form
y = a + bx