
System information


Blastware Advanced Module
____________________________________________________
6–58 Blastware Operator Manual
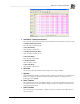
Sample of channel data pasted into a Microsoft Excel document:
6.11 Blast Design Simulation
Within the Tools menu, Waveform Simulation offers three ways to model the influence of
initiation timing on blast-induced vibration, 1) Interval Analysis, 2) Linear Superposition, and 3)
Signature Hole Analysis. These are modeling tools to assist you in developing blast design, and
should be used with caution, as actual results will vary depending upon site particularities
including geology, and explosives type, among other factors.
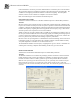
6.11.1 Interval Analysis
This tool is only available when a Waveform Analysis window is open. The tool produces a color
plot with the frequency displayed on the x-axis, delay interval on the y-axis, and a measure of the
energy content (y-axis value of a standard FFT plot) represented using different color bands. The
recorded signals must be the same length as the desired resultant signal or larger.
The contour plot outputs to a separate window that can be printed or saved to disk as a metafile.
WARNING: This is a modeling tool only. Actual results will vary depending upon site
particularities including geology, and explosives type, among other factors.
NOTE: If the result of the entries for the Number of Delays X Delay Range (ms) is
greater than 40, the following dialog will appear:
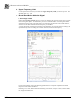
Click on the Tools menu in the Event Manager and select Synthetic Waveform – select the
Interval Analysis tool from the fly-out menu. A dialog box is displayed: