
User`s guide

26
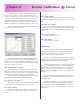
Chapter 6
Density Calibration (Q-Curve)
PowerRIP ImageSet includes a calibration tool known as
Q-Curve which is used to create the calibration files used to
change the output density on a per-color basis. This application
is launched automatically whenever the “Adjust Custom Calibra-
tion” button is clicked (see the Configure Output Section) or,
when the “Apply Custom Calibration” checkbox is checked and
there is no calibration curves defined for that job or queue setup.
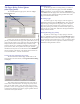
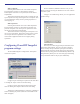
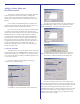
When you click on the Adjust Custom Calibration button,
the Q-Curve main dialog will appear.
The last values for this job or queue (depending on what
dialog it was selected from) will be loaded automatically. It is
not necessary to “name” the different calibrations. It is possible,
however, to save settings to and load from named files by using
the “Load” and “Save As” buttons.
The “All the same” checkbox
Checking this box will tie all the channels together. All
other color channels will become like the currently displayed
channel when the box is checked. Also, any subsequent changes
to a channel will affect all channels in the same manner.
If this checkbox is not checked, all channels can be edited
independently and will retain their individual values.
The “Channel” dropdown
This dropdown list allows you to switch color channels. If
“All the same” is checked, all channels will be the same.
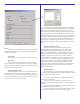
The “Reset” button
Clicking this button will reset the curve to the values that
were set when the “Adjust Custom Calibration” button was
clicked.
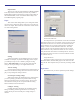
The “Load” button
This will envoke the normal Windows navigation dialog
and allow you to load a previously defined curve from a named
file.
The “Save As..” button
This will envoke the normal Windows navigation dialog
and allow you to save the current settings to a named file. This
will allow you to have an archive of different curves to load as
needed.
The “Cancel” button
Ignores all changes and exists
The “OK” button
Saves all changes and exists
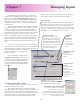
Calibrating
NOTE: It is highly recommended that a densitometer be
used when doing any calibration. Although you can calibrate
without one, you would be relying on the human eye, light
source, etc which can have many variables.
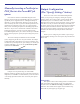
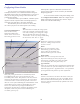
The Q-Curve calibration user interface enables you to alter
the density curves by dragging the graphical line (on the left) or
typing the number into the proper box (on the right).
To edit using the graphical line, select a place on the curve
where you want to make the change and click. A handle will
appear which you can then drag up and down. Create as many
handles as necessary to achive the proper curve. To delete a
handle, simply drag it outside the bounds of the grid and it will
dissapear.
The calibration grid is designed “linearly” and thus 0%
(the highlights) is at the bottom left and 100% (the shadows) is
on the upper right.
To change the appearence of your printout, drag the curve
in the direction you want the density to move. For example if
your 50% range is printing too dark, decrease the value at that
range by moving the curve down or entering a lower number in
the 50% box.