
User guide

80
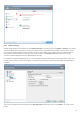
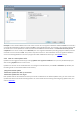
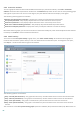
4.6.3 Protection statistics
To view a graph of statistical data related to ESET Smart Security's protection modules, click Tools > Protection
statistics. Select the desired protection module from the Statistics drop-down menu to see the corresponding graph
and legend. If you mouse over an item in the legend, only the data for that item will display in the graph.
The following statistic graphs are available:
Antivirus and Antispyware protection – Displays the number of infected and cleaned objects.
File system protection – Only displays objects that were read or written to the file system.
Email client protection – Only displays objects that were sent or received by email clients.
Web access and Anti-Phishing protection – Only displays objects downloaded by web browsers.
Email client antispam protection – Displays the history of antispam statistics since the last startup.
Below the statistics graphs, you can see the number of total scanned objects, latest scanned object and the statistics
timestamp. Click Reset to clear all statistics information.
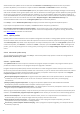
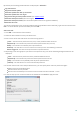
4.6.4 Watch activity
To see the current File system activity in graph form, click Tools > Watch activity. At the bottom of the graph is a
timeline that records file system activity in real-time based on the selected time span. To change the time span,
click Step: 1... located at the bottom-right of the window.
The following options are available:
Step: 1 second (last 10 minutes) – The graph refreshes every second and the timeline covers the last 10 minutes
Step: 1 minute (last 24 hours) – The graph is refreshed every minute and the timeline covers the last 24 hours
Step: 1 hour (last month) – The graph is refreshed every hour and the timeline covers the last month
Step: 1 hour (selected month) – The graph is refreshed every hour and the timeline covers the last X selected
months
The vertical axis of the File system activity graph represents read data (blue) and written data (red). Both values are