
Instruction manual


Instruction manual αlpha DO 2000
38
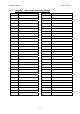
11.2 Appendix 2 – Salinity vs Temperature (@ 760 mmHg)
The following table shows the Dissolved Oxygen values at different salinity values, at different
temperatures, at barometric pressure of 760 mmHg. For other pressure levels, the controller
automatically corrects the value based on the pressure value input.
Temperature Salinity- ppm
o
C
o
F 0 10 20 30 40
0 32.0 14.6 13.8 13.0 12.1 11.3
1 33.8 14.2 13.4 12.6 11.8 11.0
2 35.6 13.8 13.1 12.3 11.5 10.8
3 37.4 13.4 12.7 12.0 11.2 10.5
4 39.2 13.1 12.4 11.7 11.0 10.3
5 41.0 12.7 12.1 11.4 10.7 10.0
6 42.8 12.8 11.8 11.1 10.5 9.8
7 44.6 12.1 11.5 10.9 10.2 9.6
8 46.4 11.8 11.2 10.6 10.0 9.4
9 48.2 11.5 11.0 10.4 9.8 9.2
10 50.0 11.3 10.7 10.1 9.6 9.0
11 51.8 11.0 10.5 9.9 9.4 8.8
12 53.6 10.7 10.3 9.7 9.2 8.6
13 55.4 10.5 10.1 9.5 9.0 8.5
14 57.2 10.3 9.9 9.3 8.8 8.3
15 59.0 10.1 9.7 9.1 8.6 8.1
16 60.8 9.8 9.5 9.0 8.5 8.0
17 62.6 9.6 9.3 8.8 8.3 7.8
18 64.4 9.4 9.1 8.6 8.2 7.7
19 66.2 9.2 8.8 8.5 8.0 7.6
20 68.0 9.1 8.7 8.3 7.8 7.4
21 69.8 8.9 8.6 8.1 7.7 7.3
22 71.6 8.7 8.4 8.0 7.6 7.1
23 73.4 8.6 8.3 7.9 7.4 7.0
24 75.2 8.4 8.1 7.7 7.3 6.9
25 77.0 8.2 8.0 7.6 7.2 6.7
26 78.8 8.1 7.8 7.4 7.0 6.6
27 80.6 8.0 7.7 7.3 6.9 6.5
28 82.4 7.8 7.6 7.1 6.8 6.4
29 84.2 7.7 7.4 7.0 6.6 6.3
30 86.0 7.6 7.3 6.9 6.5 6.1
31 87.8 7.4 7.1 6.7 6.4 6.0
32 89.6 7.3 7.0 6.6 6.3 5.9
33 91.4 7.2 6.9 6.5 6.2 5.8
34 93.2 7.1 6.8 6.5 6.1 5.7
35 95.0 7.0 6.7 6.4 6.0 5.6
36 96.8 6.8 6.5 6.2 5.9 5.5
37 98.6 6.7 6.4 6.1 5.8 5.4
38 100.4 6.6 6.3 6.0 5.7 5.3
39 102.2 6.5 6.3 5.9 5.6 5.2
40 104.0 6.4 6.3 5.8 5.5 5.2