User Guide RTU-310/310G RTU-310/310G IP Services Test Head
Copyright © 2007–2012 EXFO Inc. All rights reserved. No part of this publication may be reproduced, stored in a retrieval system or transmitted in any form, be it electronically, mechanically, or by any other means such as photocopying, recording or otherwise, without the prior written permission of EXFO Inc. (EXFO). Information provided by EXFO is believed to be accurate and reliable.
Contents Contents Certification Information ....................................................................................................... ix 1 Introducing the RTU-310/310G ..................................................................... 1 Features ..................................................................................................................................1 Models ............................................................................................................
Contents 5 Creating and Starting a Test Case ..............................................................67 Introducing the Test Setup ....................................................................................................68 Test Case Availability .............................................................................................................72 EtherSAM (Y.1564) Test Case .................................................................................................
Contents 10 Traffic Analyzer Tabs ................................................................................ 199 Ethernet TX .........................................................................................................................200 Ethernet RX ........................................................................................................................203 Ethernet Statistics ...................................................................................................
Contents 15 EtherSAM Tabs ..........................................................................................321 Overview (Configuration) ....................................................................................................322 Services (Configuration) ......................................................................................................327 Ramp (Configuration) .........................................................................................................
Contents 21 Tools Tabs .................................................................................................. 407 Script ..................................................................................................................................408 Ping Configuration .............................................................................................................412 Ping Results ...................................................................................................
Contents D Pop-Up Windows .......................................................................................485 VLAN Configuration ............................................................................................................486 PBB-TE Interface configuration ...........................................................................................487 IPv4 Configuration ..............................................................................................................
Certification Information Certification Information Federal Communications Commission (FCC) and Industry Canada (IC) Information Electronic test and measurement equipment is exempt from FCC Part 15 compliance in the United States and from IC ICES 003 compliance in Canada. However, EXFO Inc. (EXFO) makes reasonable efforts to ensure compliance to the applicable standards.
Certification Information European Union (CE) Information Electronic test and measurement equipment is subject to the EMC Directive in the European Union. The EN61326 standard prescribes both emission and immunity requirements for laboratory, measurement, and control equipment. For devices within the scope of information technology equipment (ITE) and complying with applicable ITE EMC standards, EN55022 and EN55024 can also be used for declaring conformance.
Certification Information CE Declaration of Conformity DECLARATION OF CONFORMITY Application of Council Directives: Manufacturer’s Name: Manufacturer’s Address: Equipment Type/Environment: Trade Name/Model No.: 2006/95/EC - The Low Voltage Directive 2004/108/EC - The EMC Directive 2006/66/EC - The Battery Directive 93/68/EEC - CE Marking and their amendments EXFO Inc.
1 Introducing the RTU-310/310G The RTU-310/310G is a powerful 24/7 network testing solution for IPTV and Ethernet services. Features High-performance probe hardware supporting hundreds of simultaneous services Real-time measurement of over 35 IPTV metrics Detailed Ethernet statistics and error reporting Alarm reporting Complete EtherSAM™ (ITU-T Y.1564) test suite.
Introducing the RTU-310/310G Features 2 Boot using USB drive RTU health diagnostics Remote restart NTP server support with daylight saving option Fully compliant with IEEE 802.
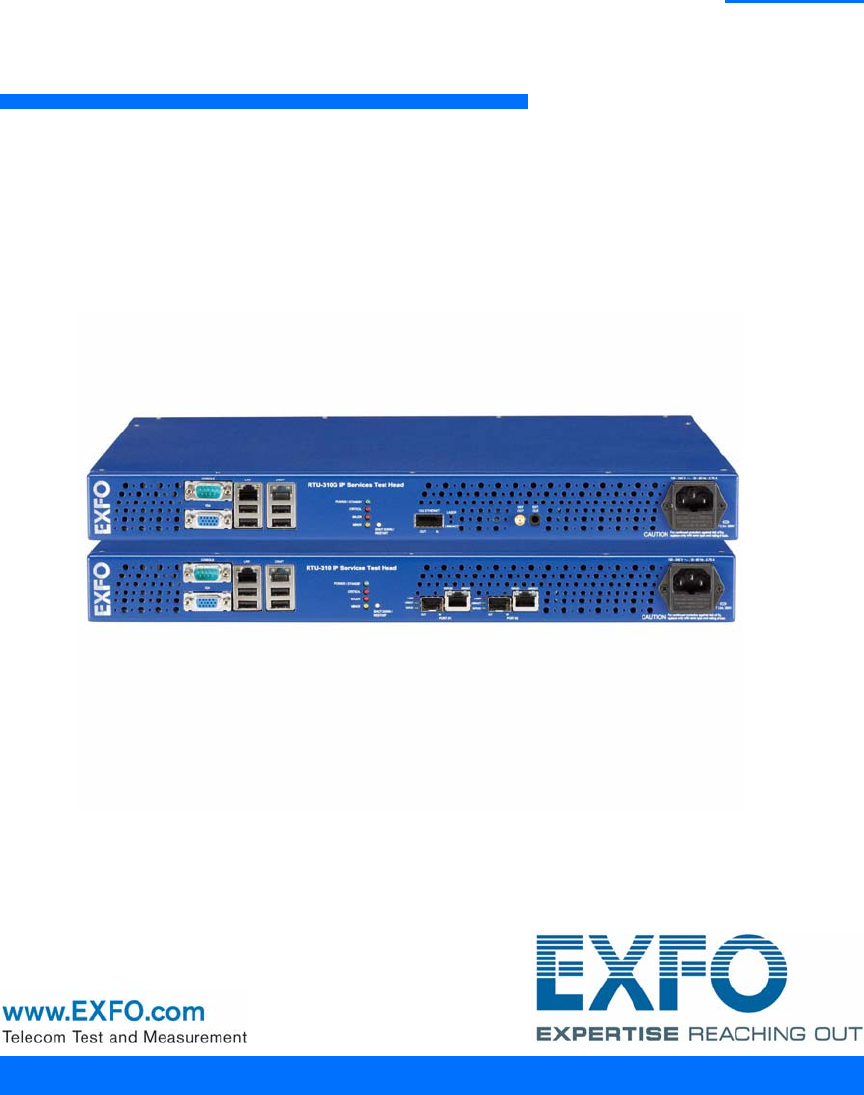
Introducing the RTU-310/310G Models Models The RTU-310 is equipped with two electrical 10/1000/1000 Mbps Ethernet port and two optical 100/1000 Mbps Ethernet port. The RTU-310G is equipped with one optical 10 Gbps Ethernet port. The RTU-310/310G unit is available either with AC or DC power connector. RTU-310 AC version DC version Note: The 100 Mbps optical interface is available through a software option. Refer to Software Options on page 347 for more information.
Introducing the RTU-310/310G Models RTU-310G 4 AC version DC version RTU-310/310G
Introducing the RTU-310/310G Option Option Option Description RTU-8580 Software key that enables the 1000 Mbps electrical and optical interfaces on the RTU-310 model. 100M Optical Software key that enables the 100 Mbps optical interface on the RTU-310. Optical Transceivers (SFP) Option Description FTB-8590 1000Base-SX (850 nm) LC connectors optical SFP transceiver module. FTB-8591 1000Base-LX (1300 nm) LC connectors optical SFP transceiver module.
Introducing the RTU-310/310G Optical Transceivers (XFP) Optical Transceivers (XFP) Option 6 Description FTB-85900 850 nm short-wave optics (10GBASE-SR/SW) FTB-85901 1310 nm long-wave optics (10GBASE-LR/LW) FTB-85902 1550 nm long-wave optics (10GBASE-ER/EW) RTU-310/310G
Introducing the RTU-310/310G Conventions Conventions Before using the product described in this manual, you should understand the following conventions: WARNING Indicates a potentially hazardous situation which, if not avoided, could result in death or serious injury. Do not proceed unless you understand and meet the required conditions. CAUTION Indicates a potentially hazardous situation which, if not avoided, may result in minor or moderate injury.
2 Safety Information Laser Safety Warnings WARNING Do not install or terminate fibres while a laser source is active. Never look directly into a live fibre, and ensure that your eyes are protected at all times. WARNING Use of optical instruments with this product will increase eye hazard. WARNING This product may employ a Class 1 or Class 1M SFP/XFP. WARNING When the LASER LED is on, the RTU-310/310G is receiving/emitting an optical signal.
Safety Information Installation Instruction Warnings Installation Instruction Warnings CAUTION No user serviceable parts are contained inside. Contact the manufacturer regarding service of this equipment. CAUTION Keep all ventilation openings clear and unobstructed. IMPORTANT All wiring and installation must be in accordance with local building and electrical codes acceptable to the authorities in the countries where the equipment is installed and used.
Safety Information Installation Instruction Warnings IMPORTANT Unauthorized modifications to this equipment shall void the user’s authority to operate this equipment. CAUTION For DC version: The RTU-310/310G must be installed in Restricted Access Locations.
3 Getting Started This chapter covers the description of the RTU-310/310G unit, the physical installation, all connections, LEDs, and the initial setup of the RTU-310/310G. Front Panel Description The following figure indicates the location of all connectors, ports, and LEDs available on the front panel of the RTU-310/310G unit.
Getting Started SHUT DOWN / RESTART Button SHUT DOWN / RESTART Button The SHUT DOWN/RESTART button is used to either shut down or restart (shut down and restart) the unit. To shut down the RTU-310/310G unit: Press the SHUT DOWN / RESTART button once. The RTU-310/310G unit closes all applications and once done, the POWER/STANDBY LED will flash to indicate that it is safe to disconnect the AC or DC power. To wake up the RTU-310/310G unit: Press the SHUT DOWN / RESTART button once while in standby mode.
Getting Started RTU-310/310G LEDs RTU-310/310G LEDs LED Status POWER/STANDBY On Description Indicates that the RTU-310/310G unit is on and ready to be used. Flashing Indicates that the RTU-310/310G unit is in standby mode. It is safe to turn the unit off. CRITICALa MAJORa MINORa a. On Indicates current critical severity alarm. Off Indicates no critical severity alarm. On Indicates current major severity alarm. Off Indicates no major severity alarm. On Indicates current minor severity alarm.
Getting Started Installing the RTU-310/310G in a Rack Installing the RTU-310/310G in a Rack To install the RTU-310/310G in a rack: 1. Fix the supplied brackets on the RTU-310/310G with the supplied 8-32 x 5/16 in. screws. Bracket kits are available for 19 and 23 inch rack mount applications but only one kit is supplied with the unit. Note: The brackets allow the RTU-310/310G to be installed with its front panel flush or offset with the front of the rack.
Getting Started Installing the RTU-310/310G in a Rack 2. Place the unit in the rack at the desired height. 3. Fix the unit in place using four 10-32 x 1/2 in. screws and lock washers.
Getting Started Connecting the Power Connecting the Power The RTU-310/310G is available with either an AC or DC integrated power supply. Note: The RTU-310/310G automatically powers up once connected to a live AC or DC power source. To connect the RTU-310/310G to an AC power source: 1. Connect the supplied AC power cord to the RTU-310/310G front panel. 2. Connect the other end to an AC power source.
Getting Started Connecting the Power To connect the RTU-310/310G to a DC power source: WARNING The RTU-310/310G DC version is intended to be grounded. Ensure that the unit is connected to earth ground during normal use. Ground lug 1. Remove the two Phillips flat screws, and remove the ground lug on the back panel of the RTU-310/310G unit. 2. Use a #6 AWG wire (not supplied) insert the wire into the lug and crimp it. 3.
Getting Started Connecting the Power 5. Using 14-16 AWG copper insulated wires and the supplied lug, insert the two stripped wires into the lug and tighten the screws firmly. Make sure to respect the polarity. The positive supply wire lead (40-70V) must be on the right side of the lug and the negative supply wire on the left side.
Getting Started Turning the Unit On 7. Connect the other end of wires to the DC power source. CAUTION The DC input feeds to the equipment must be protected by 20A rated maximum breaker provided as part of the building installation. 8. To add a redundant DC source on the RTU-310/310G, repeat steps 5 to 7. Turning the Unit On To turn the unit on: Connect the RTU-310/310G to a live AC or DC power source. Note: The RTU unit must be connected to monitor and keyboard before switching it on.
Getting Started Connecting the Test Interface Ports Connecting the Test Interface Ports Connecting the Electrical 10/100/1000 Mbps Ethernet Test Interface The RTU-310 unit provides two electrical RJ-45 ports for10Base-T, 100Base-T, or 1000Base-T testing capability. Note: 1000Base-T is optional.
Getting Started Connecting the Test Interface Ports Electrical Port LEDs LED LINK/ACT DUPLEX Ethernet Test Module Status Description On Ethernet link up Off Ethernet link down Flashing TX/RX activity On Full Duplex mode Off Half Duplex mode Flashing Collisions detected 23
Getting Started Connecting the Test Interface Ports Connecting the Optical 100/1000 Mbps and 10 Gbps Ethernet Test Interfaces The RTU-310 unit provides two optical ports for 100Base-FX or 1000Base-X whereas the RTU-310G provides one optical port for 10 Gbps Ethernet testing capability. The optical port for RTU-310 is Small Form Factor Pluggable (SFP) slot type (LC connector) and the optical port for RTU-310G is Extended Small Form Pluggable (XFP) slot type. Note: 100Base-FX and 1000Base-X are optional.
Getting Started Connecting the Test Interface Ports To use the optical 100/1000 Mbps Ethernet interface for testing: 1. Insert one of the following SFP modules into the optical slot. Rate 1000Base-X Description 850 nm SFP module for 1000Base-SX short wavelength laser connection. 1300 nm SFP module for 1000Base-LX long wavelength laser connection. 1550 nm SFP module for 1000Base-ZX extended wavelength laser connection. 100Base-FX 1310 nm SFP module for 100Base-FX, MMF, 2 Km.
Getting Started Connecting the Test Interface Ports 2. Carefully connect optical fiber cables to the SFP’s or XFP’s IN and OUT ports. To ensure good signal quality, make sure that the optical fibre connector is fully inserted into the optical connector port. Note: In order not to exceed the maximum receiver power level before damage, an attenuator must be used. Refer to Maximum RX before damage (dBm) on page 453 for more information.
Getting Started Connecting the Test Interface Ports Optical Port LEDs for RTU-310G LED LASER LINK/ACT Ethernet Test Module Status Description On An optical signal is generated Off No optical signal is generated On Ethernet link up Off Ethernet link down Flashing TX/RX activity 27
Getting Started Connecting the Management Interfaces Connecting the Management Interfaces Connecting the Ethernet CRAFT Port Connecting a PC to the Ethernet CRAFT port is required to access the user interface and configure the RTU-310/310G the very first time. Note: The CRAFT port is for access using a Static configured IP.
Getting Started Connecting the Management Interfaces CRAFT Port Embedded LEDs LED LINK/ACT (Green) SPEED (Yellow) Ethernet Test Module Status Description On Ethernet link up Off Ethernet link down or no activity Flashing TX/RX activity On 100 Mbps Off 10 Mbps 29
Getting Started Connecting the Management Interfaces Connecting the Ethernet LAN Port The RTU-310/310G LAN interface is designed to provide remote connectivity to the unit through a typical management network. To connect remotely to the RTU-310/310G: Both the RTU-310/310G unit and remote PC must be connect to the same management network using standard straight through Ethernet cables with RJ-45 connectors. Refer to Ethernet Cables on page 455 for more information.
Getting Started Connecting the Management Interfaces LAN Port Embedded LEDs LED LINK/ACT (Green) SPEED (Yellow) Ethernet Test Module Status Description On Ethernet link up Off Ethernet link down or no activity Flashing TX/RX activity On 100 Mbps Off 10 Mbps 31
Getting Started Software Management Software Management Software management functionality ensures that the version of EX-Vu running on the RTU-310/310G unit and the client machine is the same. Software Version Management using EX-Vu When the version of EX-Vu remote application does not match with the RTU-310/310G software load, options to download and match the software version are displayed.
Getting Started Software Management To match the version of Ex-Vu to the current version of the RTU-310/310G software load: 1. Select Download and install the EX-Vu remote application to match the current RTU-310 version and click OK. The current EX-Vu remote application is uninstalled and the other version of EX-Vu application is downloaded from the RTU-310/310G and installed on the client machine to match the version of the RTU-310/310G software load. 2.
Getting Started Software Management 2. Click Yes to confirm the download The current RTU-310/310G software load is uninstalled and the other version of the software is downloaded from the client machine and installed on the RTU-310/310G unit. Note: If the version of RTU-310/310G software load (that needs to be installed to match the EX-Vu version) is not available on the client machine, a rollback is initiated by the RTU-310/310G unit.
Getting Started Software Management To transfer files to the RTU-310/310G: 1. Create a folder on the local drive of the RTU-310/310G. 2. Right-click the task bar of the TightVNC Viewer screen and select Transfer files. 3. Select the setup files on the local drive of your computer and click the button. The files are transferred to the local drive of the RTU-310/310G. 4. Double-click the setup file RTU-310/310G setup.exe. Click Next to start the installation and follow the on-screen instructions.
4 Introducing the Smart User Interface To Start the RTU-310/310G Application: 1. Once your RTU-310/310G module is installed, turn on the RTU-310/310G. 2. In the main window, under Modules, press RTU-310/310G once to select the module. 3. start the Smart User Interface (SUI). Login Ensure that the RTU-310/310G is connected to the management network or you are locally connected to the RTU-310/310G. To log on to the RTU-310/310G interface using SUI: 1.
Introducing the Smart User Interface Login Note: An error is displayed when the connection to the RTU-310/310G unit is not established, the initialization of the SUI software fails, or due to an unexpected loss of connection. Note: Alternatively, you can connect to the RTU-310/310G using the TightVNC service. Refer Remote Connection using TightVNC on page 474, for more information. A check is performed to ensure that the version of SUI software on the RTU-310x and client machine match.
Introducing the Smart User Interface Main Window Main Window Minimize Tabs Help Application name Exit Tab(s) Tab’s Content Global Test Status Ethernet and Fibre Channel Application Test controls Remote status Date and time 39
Introducing the Smart User Interface Main Window Tabs The SUI application contains the following four main application tabs that contain other tabs. TEST Tab The TEST tab gives access to the test creation, configuration, and results. Note: Only the Setup tab is available when there is no test created. Setup tab is part of the TEST tab and allows setting up the test. Refer to page 68 for more information.
Introducing the Smart User Interface Main Window For Dual ports (RTU-310 only), see the figure below for the localization of the port number on each tabs.
Introducing the Smart User Interface Main Window TCP Throughput Tabs on page 349RTU-310) Advanced Tab on page 355 WIS Tabs on page 239 (RTU-310G) Common Tab on page 359 Expert Mode Tabs on page 363 System tab; refer to page 333 for more information. Tools tab; refer to page 407 for more information. About tab; gives information on EXFO company, contact, and product software release version. Application Title Displays the software application title.
Introducing the Smart User Interface Main Window It is also possible to navigate through the help information once the help window is open. Exit The exit button ( X ) closes the current application.
Introducing the Smart User Interface Global Test Status and Controls Global Test Status and Controls Global Test Status The global test status area displays the alarm, verdict, and test timer. Clicking on this area maximizes the view of these status. The maximized view is useful to facilitate distant viewing of these status. To minimize the view, either click on the global test status area or click anywhere on the maximized status area.
Introducing the Smart User Interface Global Test Status and Controls Current status: Indicates the current alarm/error status of the test. A grey background indicates that the test is not running (--), a green background indicates that there is no alarm/error (NO ALARM), while a red background indicates that at least one alarm/error condition has occurred in the last second (ALARM). Note: The history and current alarm/error status are monitored once the test is started.
Introducing the Smart User Interface Global Test Status and Controls Button Description b Load : Loads a previously saved configuration. Select an existing file and click Open to confirm. The default directory is C:\ProgramFiles\EXFO\Applications\RTU\310\UserFiles\Configuration or C:\ProgramFiles\EXFO\Applications\RTU\310G\UserFiles\Configuration. The configuration file extension is cfg.
Introducing the Smart User Interface Global Test Status and Controls Date and Time Indicates the date (YYYY-MM-DD) and time (HH:MM:SS). Refer to Time Options on page 334 for more information on time format and time zone. System Alarms The System alarms provide a quick indication about the alarm status of the RTU-310/310G unit. H (History) LED: Indicates the alarms/errors that occurred in the past.
Introducing the Smart User Interface Favorites Favorites Favorites gives access to 10 factory test case configurations. Favorites is available when no test is running. Click . Favorites List Allows to select a test case configuration. The test case configuration selected by default is the first one in the list. Note: Test cases not supported by the current RTU-310/310G model and its options will not be created. Note: Favorites may or may not be compatible from one version of software to another.
Introducing the Smart User Interface Favorites Overwrite Selected Favorite Content The factory test case configurations can be modified as well as their default names. Favorite Name: Allows changing the name of the test case configuration file. A maximum of 32 characters are allowed in the name. Save: Saves the current test case configuration using the specified favorite name. Load Loads the selected test case configuration.
Introducing the Smart User Interface Test Report Generation Test Report Generation Click Report from the Global Test Status and Controls to generate a report for the current test. The report contains all the information about the test including the job information, system information, interface setup, test summary, test configuration, results, etc.
Introducing the Smart User Interface Test Report Generation Report Settings: These parameters are used to identify the report and are not mandatory. Enter the following report information if needed: Report Title, Report Header, Selected Logo, and Report Format. Click Browse to select a different logo, then click Open. Report Format: Select the report file format. Choices are html, csv, pdf, and txt.
Introducing the Smart User Interface Test Report Generation Generate button: Allows generating and saving the report. Select an existing file, or type a new name in the File name field and click OK. The default directory is C:\ProgramFiles\EXFO\Applications\RTU\310\UserFiles\Reports or C:\ProgramFiles\EXFO\Applications\RTU\310G\UserFiles\Reports. The report file can be saved on the following locations: Local memory (RTU-310/310G): The file is saved locally on the RTU-310/310G memory.
Introducing the Smart User Interface Test Report Generation Sections Tab Pre-defined selection: Allows selecting the type of report, and the window underneath allows selecting what will be part of the report. The default setting is Summary Report. Choices are: Summary Report selects the Summary report section only. Test Case Report selects all the report sections. Note: Once the report type is selected, each section can be selected to customize the report.
Introducing the Smart User Interface Typical Tab Elements Typical Tab Elements Once the test is created, different tabs are available allowing test configuration and monitoring. The following section describes usual elements appearing on those tabs. Status LEDs H (History) LED: Indicates that alarms/errors occurred in the past.
Introducing the Smart User Interface Typical Tab Elements Alarm/Error Measurements Note: Alarms/Errors are only monitored once the test is started. Seconds: Gives the total number of the seconds in which one or more alarm/error occurred. Count: Gives the number of occurrences of a specific error. The count is displayed using integer value; exponential value (1.00000E10) is used when the count is bigger than the field display capacity. Rate: Calculates and displays the error rate.
Introducing the Smart User Interface Typical Tab Elements Table Sorting Tables offer sorting capabilities on one or more columns. An arrow next to the column label name, indicates the sorting column field and the sorting order. Clicking again on the selected sort column label will change the sort order. Clicking another column label allows to sort using a different field.
Introducing the Smart User Interface Tab Configuration Tab Configuration Once the test is created, other tabs next to the Test tabs are enabled allowing configuration of test parameters and viewing of the test status and results. A tab configuration button is available at the top-right part of each tab.
Introducing the Smart User Interface Tab Configuration This tab configuration window allows configuration of all tabs on any page except for the Test Setup, and Summary tabs. The tab configuration allows also to jump directly to the desired page by selecting it from the Defined Tabs list and then clicking OK. Selected Tab 58 Tab Name indicates the name of the tab containing the two tabs (top and bottom page). Clicking this field allows changing the tab name.
Introducing the Smart User Interface Tab Configuration Defined Tabs Allows the selection of a tab. Up and down arrows are used to respectively move the selected page up or down in the list. Insert button allows the insertion of a new tab after the selected tab (the one highlighted) A maximum of 30 tabs can be displayed. Delete button allows the deletion of the selected tab.
Introducing the Smart User Interface Tab Configuration Help Button (?) Displays the help information related to the tab configuration. It is also possible to navigate through the remainder of the help information. Default Button Return to the default page configuration layout. OK Button Accepts the page layout changes and jumps to the selected page (Defined tabs). Cancel Button Cancels the changes and returns to the page from where the tab configuration was launched.
Introducing the Smart User Interface Keyboard Usage Keyboard Usage The SUI pops up different keyboards to modify data. Following are the usual keyboard keys: Left arrow: Moves the cursor one position to the left. Right arrow: Moves the cursor one position to the right. Del: Deletes the value at the cursor position. Back: Deletes the value preceding the cursor position. Help: Displays the help information related to the keyboard usage.
Introducing the Smart User Interface Keyboard Usage 62 Numerical keyboards: Allows entering integer/decimal values.
Introducing the Smart User Interface Keyboard Usage Time Keyboard: Allows entering a time value. Date keyboard: Allows selecting a date by clicking the date on the calendar. Use the left and right arrow to switch from one month to another or Click the month area for quick month selection. Click the year area for quick year selection.
Introducing the Smart User Interface Keyboard Usage Hexadecimal keyboards: Allows entering hexadecimal values (0 through 9 and A through F) For MAC address For IPv6 address 64 FTB-8500 Series and FTB-8120NGE/8130NGE
Introducing the Smart User Interface Keyboard Usage Full keyboard: Allows entering numbers, letters and some other characters. The Back, Del, Shift and space bar keys have the same functionality as a regular PC keyboard. Trace message keyboard (WAN): Allows entering alphanumerical characters (ITU T.50) required for J0 and J1 Trace fields. Click the Ctrl Char button to access these characters.
Introducing the Smart User Interface Keyboard Usage ITU T.
5 Creating and Starting a Test Case A test case can be created using one of the following methods: Test Setup allows the creation of the test case by travelling through the signal structure. See Introducing the Test Setup on page 68. See Test Case Availability to determine the test cases supported by the unit. Load allows setting up the test case by loading a previously saved configuration. Refer to Load on page 46 for more information. Script allows running a script that creates the test case.
Creating and Starting a Test Case Introducing the Test Setup Introducing the Test Setup The Test Setup window is displayed by default when the SUI is started. In the case where the SUI is not in the test setup window, click the Test Setup from the TEST Tab on page 40. Configuration section Test Setup Controls Data Path Selector Tree allows seeing the configuration test structure (data path). Grid is used for test case direction (decoupled test mode).
Creating and Starting a Test Case Introducing the Test Setup Test Setup Controls: Back returns to the previous configuration step allowing to see, change or delete what had been selected. Next switches to the next configuration step. The Next button is only available when selection(s) from the Data Path Selector and/or the Grid has been made. Delete deletes the current path node. Finish/Setup: Finish completes the configuration and creates the test case.
Creating and Starting a Test Case Introducing the Test Setup The test path is created through the configuration of each layer that must be crossed by the signal under test.
Creating and Starting a Test Case Introducing the Test Setup Steps Available with The Test step is the root of the test case. It allows the configuration All tests of the test name, test application type, Interface Type, topology, and Clock Mode. For RFC 2544, the selection of the sub tests and dual test set are also available. The Port step allows the selection and configuration of the physical All tests portand for 10Gig-E interface the configuration of the transceiver mode (LAN or WAN).
Creating and Starting a Test Case Test Case Availability Test Case Availability The remaining of this chapter describes how to create the following typical Ethernet and Fibre Channel test cases. The available test cases depend on the model and activated options. Supported on Test Case RTU-310G EtherSAM (Y.1564) Test Case X X 73 Ethernet EtherSAM (Y.
Creating and Starting a Test Case EtherSAM (Y.1564) Test Case EtherSAM (Y.1564) Test Case ITU-T Y.1564 is the newly introduced standard for turning-up and troubleshooting carrier Ethernet services. This new methodology is completely adapted to today’s Ethernet services especially mobile backhaul and commercial services. Contrary to other methodologies, EtherSAM supports new multiservice offerings.
Creating and Starting a Test Case EtherSAM (Y.1564) Test Case To create an EtherSAM (Y.1564) test case: 1. Test configuration: 1a. Select Ethernet 10/100/1000 as the Interface Type. Interface Type is not available with RTU-310G. 1b. Select Single Port as the Topology. Topology is only available with RTU-310. 1c. Select the source Clock Mode. Available with RTU-310G only. Refer to Clock Synchronization on page 352 for more information. 1d. Select EtherSAM (Y.1564) as the Application Type. 1e.
Creating and Starting a Test Case EtherSAM (Y.1564) Test Case 2. Port configuration: 2a. RTU-310Select the port Connector Type (Optical or Electrical RJ-45). Optical is automatically selected for the Ethernet 10G interface. 2b. For RTU-310select the port number by clicking on Port 1 or Port 2. 2c. For Electrical RJ-45, if required, select the Ethernet port crossover check box to inverse the pin-to-pair assignment of the UTP cable used.
Creating and Starting a Test Case EtherSAM (Y.1564) Test Case 3. Optical configuration for Ethernet 10G interface only: 3a. Select the Transceiver Mode Choices are Local Area Network (LAN) for regular Ethernet interface (10.31250Gb/s) and Wide Area Network (WAN) for Ethernet stream encapsulated inside a SONET/SDH frame structure (9.95328Gb/s). Choices availability depend on the unit model and options refer to Software Options on page 347 for more information. 3b.
Creating and Starting a Test Case EtherSAM (Y.1564) Test Case 4c. Select the Frame Format. Choices are Ethernet II and 802.3 SNAP. For 802.3 SNAP, select the Organizationally Unique Identifier (OUI). Refer to Network on page 150 for more information. 4d. Select the PBB-TE check box to enable the capability to generate and analyze streams with PBB-TE data traffic including configuration of B-MAC (source and destination), B-VLAN and I-tag, and to filter received traffic by any of these fields.
Creating and Starting a Test Case EtherSAM (Y.1564) Test Case 4g. For IPv6, click the IPv6 Config button to set the IPv6 settings. Refer to IPv6 Address Configuration on page 491 for more information. 4h. Click Next. 5. Service configuration 5a. For IPv4, select the Automatic IP Address check box to dynamically obtain an IP address from a DHCP (Dynamic Host Configuration Protocol) server or set the source and destination IP addresses, Subnet Mask, and the Default Gateway.
Creating and Starting a Test Case EtherSAM (Y.1564) Test Case 6. Services must be enabled before starting the test. For enabling Services and for additional configuration parameters, refer to EtherSAM Tabs on page 321. 7. Click the Start button to start the test. At least one of the EtherSAM (Y.1564) sub tests (Configuration Test or Performance Test) has to be enabled to start the test. The sub-tests that are enabled will be performed following this order: Configuration Test and Performance Test. 8.
Creating and Starting a Test Case Ethernet EtherSAM (Y.1564) and RFC 2544 Dual Test Set Test Cases Ethernet EtherSAM (Y.1564) and RFC 2544 Dual Test Set Test Cases The EtherSAM (Y.1564) test allows to validate the key performance indicators of Carrier Ethernet-based services. The RFC 2544 test allows Ethernet Throughput, Back-to-Back, Frame Loss, and Latency performance tests in accordance with RFC 2544 specifications.
Creating and Starting a Test Case Ethernet EtherSAM (Y.1564) and RFC 2544 Dual Test Set Test Cases To create an EtherSAM (Y.1564) or RFC 2544 Dual Test Set test case, first create the test on the remote module as follow: 1. Test configuration: 1a. Select Ethernet 10/100/1000 as the Interface Type. Interface Type is not available with RTU-310G. 1b. Select Single Port as the Topology. Topology is only available with RTU-310. 1c. Select EtherSAM (Y.1564) or RFC 2544 as the Application Type. 1d.
Creating and Starting a Test Case Ethernet EtherSAM (Y.1564) and RFC 2544 Dual Test Set Test Cases 2. Port configuration: Port 1 (RTU-310 only) is automatically selected. 2a. Select the port Connector Type (Optical or Electrical RJ-45). Optical is automatically selected for the Ethernet 10G interface. 2b. For Electrical RJ-45, if required, select the Ethernet port crossover check box to inverse the pin-to-pair assignment of the UTP cable used.
Creating and Starting a Test Case Ethernet EtherSAM (Y.1564) and RFC 2544 Dual Test Set Test Cases 3. Optical configuration for Ethernet 10G interface only: 3a. Select the Transceiver Mode Choices are Local Area Network (LAN) for regular Ethernet interface (10.31250Gb/s) and Wide Area Network (WAN) for Ethernet stream encapsulated inside a SONET/SDH frame structure (9.95328Gb/s). Choices availability depend on the unit model and options refer to Software Options on page 347 for more information. 3b.
Creating and Starting a Test Case Ethernet EtherSAM (Y.1564) and RFC 2544 Dual Test Set Test Cases 4. Framing configuration. 4a. Set the Auto-Negotiation, Speed, Duplex, and Flow Control parameters. Not available with Ethernet 10G. Refer to Interface Setup (Ethernet) on page 142 for more information. 4b. Set the VLAN parameters when required. Refer to MAC on page 177 for more information. 4c. Select the Frame Format. Choices are Ethernet II and 802.3 SNAP. Refer to Network on page 150 for more information.
Creating and Starting a Test Case Ethernet EtherSAM (Y.1564) and RFC 2544 Dual Test Set Test Cases Create the test on the local module as follow: 1. On the local module, proceed with the test creation as described above (starting with step 1 on page 81) at the exception of the following parameters: 1a. Select the desired EtherSAM (Y.1564) or RFC 2544 sub test(s). All sub tests are selected by default.
Creating and Starting a Test Case Ethernet EtherSAM (Y.1564) and RFC 2544 Dual Test Set Test Cases 1c. From the Remote Module page, click the Remote Selection button. IPv4 IPv6 1d. If both modules (remote and local) are on the same subnet, select the subnet mask (Broadcast Destination) of the network to be scanned, based on the IP address and subnet of its interface. Available with IPv4 only.
Creating and Starting a Test Case Ethernet EtherSAM (Y.1564) and RFC 2544 Dual Test Set Test Cases 1e. Click Scan Subnet to scan the subnet to find remote compatible modules (FTB-8510B, FTB-8510G, FTB-8525/FTB-8535, FTB-8120NGE/FTB-8130NGE, AXS-850 Series (RFC 2544 only), FTB-860 Series, FTB-810/880 Series, or RTU-310/RTU-310G). The subnet scan will work only when both remote and local modules are on the same subnet.
Creating and Starting a Test Case Ethernet EtherSAM (Y.1564) and RFC 2544 Dual Test Set Test Cases 2. For additional configuration parameters, refer to EtherSAM Tabs on page 321 or RFC 2544 Tabs on page 295. 3. On the local module, click the Start button to start the test. The Start button will be available only when the connection between the two RTU-310/310G units is established. At least one of the test procedures (For EtherSAM (Y.
Creating and Starting a Test Case Ethernet RFC 2544 Test Case Ethernet RFC 2544 Test Case RFC 2544: Allows Ethernet Throughput, Back-to-Back, Frame Loss, and Latency performance tests in accordance with RFC 2544 specifications. Note: For bi-directional (Dual Test Set) test, see Ethernet EtherSAM (Y.1564) and RFC 2544 Dual Test Set Test Cases on page 80.
Creating and Starting a Test Case Ethernet RFC 2544 Test Case To create an RFC 2544 test case: 1. Test configuration: 1a. Select Ethernet 10/100/1000 as the Interface Type. Interface Type is not available with RTU-310G. 1b. For RTU-310: Select the Topology test type: Single Port or Dual Ports. 1c. Select RFC 2544 as the Application Type. 1d. Select the desired RFC 2544 sub test(s). All RFC 2544 sub tests are selected by default.
Creating and Starting a Test Case Ethernet RFC 2544 Test Case 2. Port configuration: 2a. RTU-310Select the port Connector Type (Optical or Electrical RJ-45). Optical is automatically selected for the Ethernet 10G interface. 2b. For RTU-310select the port number by clicking on Port 1 or Port 2. 2c. For Electrical RJ-45, if required, select the Ethernet port crossover check box to inverse the pin-to-pair assignment of the UTP cable used.
Creating and Starting a Test Case Ethernet RFC 2544 Test Case 3. Optical configuration for Ethernet 10G interface only: 3a. Select the Transceiver Mode Choices are Local Area Network (LAN) for regular Ethernet interface (10.31250Gb/s) and Wide Area Network (WAN) for Ethernet stream encapsulated inside a SONET/SDH frame structure (9.95328Gb/s). Choices availability depend on the unit model and options refer to Software Options on page 347 for more information. 3b.
Creating and Starting a Test Case Ethernet RFC 2544 Test Case 5. Traffic stream configuration 5a. For IPv4, select the Automatic IP Address check box to dynamically obtain an IP address from a DHCP (Dynamic Host Configuration Protocol) server or set the source and destination IP addresses, Subnet Mask, and the Default Gateway. Refer to IPv4 Configuration on page 489 for more information. 5b. For IPv6, set the destination IP address and if required, click the IPv6 Config button for additional IPv6 settings.
Creating and Starting a Test Case Ethernet RFC 2544 Test Case 6. For additional configuration parameters, refer to RFC 2544 Tabs on page 295. 7. Click the Start button to start the test. At least one of the RFC 2544 test procedures (Throughput, Back-to-Back, Frame Loss or Latency) has to be enabled to start the test. Test procedures that are enabled will be performed following this order: Throughput, Back-to-Back, Frame Loss, and Latency. 8. For additional results, refer to RFC 2544 Tabs on page 295.
Creating and Starting a Test Case Ethernet BERT Test Case Ethernet BERT Test Case Allows Ethernet unframed and Layer 1 up to Layer 4 traffic generation with specific test pattern for Bit Error Rate analysis.
Creating and Starting a Test Case Ethernet BERT Test Case To create a BERT test case: 1. Test configuration: 1a. Select Ethernet 10/100/1000 as the Interface Type. Interface Type is not available with RTU-310G. 1b. For RTU-310: Select the Topology test type: Single Port or Dual Ports. 1c. Select BERT as the Application Type. 1d. Click Next. 2. Port configuration: 2a. Select the port Connector Type (Optical or Electrical RJ-45). Optical is automatically selected for the Ethernet 10G interface. 2b.
Creating and Starting a Test Case Ethernet BERT Test Case 2c. For Electrical RJ-45, if required, select the Ethernet port crossover check box to inverse the pin-to-pair assignment of the UTP cable used. Note: At this point you should have a link up indicated in the Tree view tab. A green LED indicates a link up while a red LED indicates a link down. For electrical port, if the link is down, make sure that the Ethernet port crossover setting is correct. 2d. Click Next. 3.
Creating and Starting a Test Case Ethernet BERT Test Case 4. Framing configuration: 4a. Select the test framing mode. Ethernet Unframed: Consists in sending a frame without EOF (End Of Frame). Ethernet Unframed is only available for optical interfaces excluding 10Gig-E WAN. Enable Sync disabled: Enable Sync enabled: Ethernet Framed Layer 1: Consists in sending a frame of x bytes specified from the frame size field; refer to frame Size on page 168 for more information.
Creating and Starting a Test Case Ethernet BERT Test Case 4b. For Ethernet Unframed, select the Enable Sync check box to allow any receiver to bit-sync every second by inserting an IFG of 12 bytes with SOF. The Enable Sync check box is not selected by default. 4c. Set the Auto-Negotiation, Speed, Duplex, and Flow Control parameters. Not available with Ethernet 10G. Refer to Interface Setup (Ethernet) on page 142 for more information. 4d. Set the IP Version (IPv4 or IPv6).
Creating and Starting a Test Case Ethernet BERT Test Case 5. Traffic stream configuration: Only Frame Size and Maximum Rate are configurable with Framed Layer 1. 5a. For IPv4, select the Automatic IP Address check box to dynamically obtain an IP address from a DHCP (Dynamic Host Configuration Protocol) server or set the source and destination IP addresses, Subnet Mask, and the Default Gateway. Refer to IPv4 Configuration on page 489 for more information. 5b.
Creating and Starting a Test Case Ethernet BERT Test Case 5g. Enter the Maximum Rate (%), the default setting is 100% for all speeds except for 10Gbps WAN which is 92.3076923076923%. Refer to Traffic Shaping on page 172 for more information. 5h. Click Next. 6. Pattern configuration: 6a. Set the pattern parameters. Refer to Pattern TX on page 290 for more information. 6b. Click Finish to complete the test setup. The Alarm summary tab is automatically displayed. 7.
Creating and Starting a Test Case Ethernet Frame Analyzer Test Case Ethernet Frame Analyzer Test Case Allows Ethernet traffic generation and analysis of up to 10 streams. The Frame Analyzer test allows also to perform IPTV, Through Mode, MPLS and PBB-TE testing. IPTV and Through Mode are only available with RTU-310.
Creating and Starting a Test Case Ethernet Frame Analyzer Test Case To create a Frame Analyzer test case: 1. Test configuration: 1a. Select Ethernet 10/100/1000 as the Interface Type. Interface Type is not available with RTU-310G. 1b. For RTU-310: Select the Topology test type: Single Port or Dual Ports. 1c. Select Frame Analyzer as the Application Type. 1d. Select the IPTV (Internet Protocol Television) check box to give access to the IPTV testing capability.
Creating and Starting a Test Case Ethernet Frame Analyzer Test Case 2. Port configuration: 2a. Select the port Connector Type (Optical or Electrical RJ-45). Optical is automatically selected for the Ethernet 10G interface. 2b. For RTU-310select the port number by clicking on Port 1 or Port 2. Port 1 (RTU-310 only) is automatically selected when IPTV is selected. For RTU-310Dual Ports, select the first port and proceed with the rest of the configuration for the first port.
Creating and Starting a Test Case Ethernet Frame Analyzer Test Case 3. Optical configuration for Ethernet 10G interface only: 3a. Select the Transceiver Mode Choices are Local Area Network (LAN) for regular Ethernet interface (10.31250Gb/s) and Wide Area Network (WAN) for Ethernet stream encapsulated inside a SONET/SDH frame structure (9.95328Gb/s). Choices availability depend on the unit model and options refer to Software Options on page 347 for more information. 3b.
Creating and Starting a Test Case Ethernet Frame Analyzer Test Case 4c. Select the PBB-TE check box to enable the capability to generate and analyze streams with PBB-TE data traffic including configuration of B-MAC (source and destination), B-VLAN and I-tag, and to filter received traffic by any of these fields. PBB-TE is a software option and needs to be enabled to give access to the PBB-TE testing capability (refer to Software Options on page 347).
Creating and Starting a Test Case Ethernet Frame Analyzer Test Case 5. Traffic stream configuration: 5a. Select the traffic stream to be configured, then set its parameters. Up to 10 streams can be configured with Frame Analyzer test. IPv4 IPv6 5b. For IPv4, select the Automatic IP Address check box to dynamically obtain an IP address from a DHCP (Dynamic Host Configuration Protocol) server or set the source and destination IP addresses, Subnet Mask, and the Default Gateway.
Creating and Starting a Test Case Ethernet Frame Analyzer Test Case 5f. Set the VLAN parameters when required. Refer to MAC on page 177 for more information. 5g. Click Finish to complete the test setup. The Alarm summary tab is automatically displayed. 6. For additional configuration parameters like setting Framed Layer 3 and Layer 4, refer to Stream Generation Tabs on page 161. 7. Click the Start button to start the test. 8.
Creating and Starting a Test Case Ethernet Smart Loopback Test Case Ethernet Smart Loopback Test Case Allows transmitting back the received Ethernet stream of data while interchanging the source and destination addresses of the MAC and IP, in addition to the source and destination ports for UDP and TCP layers. To create a Smart Loopback test case: 1. Test configuration: 1a. Select Ethernet 10/100/1000 as the Interface Type. Interface Type is not available with RTU-310G. 1b.
Creating and Starting a Test Case Ethernet Smart Loopback Test Case 1f. For RTU-310select the port number by clicking on Port 1 or Port 2. For RTU-310Dual Ports, select the first port and proceed with the rest of the configuration for the first port. However, before clicking Finish, click Back several times to return to the port setup window, select the second port and proceed with the rest of the configuration for the second port. 1g.
Creating and Starting a Test Case Ethernet Smart Loopback Test Case 2. Optical configuration for Ethernet 10G interface only: 2a. Select the Transceiver Mode Choices are Local Area Network (LAN) for regular Ethernet interface (10.31250Gb/s) and Wide Area Network (WAN) for Ethernet stream encapsulated inside a SONET/SDH frame structure (9.95328Gb/s). Choices availability depend on the unit model and options refer to Software Options on page 347 for more information. 2b.
Creating and Starting a Test Case Ethernet Smart Loopback Test Case 3. Framing configuration: 3a. Set the Auto-Negotiation, Speed, Duplex, and Flow Control parameters. Refer to Interface Setup (Ethernet) on page 142 for more information. 3b. Select the Frame Format. Choices are Ethernet II and 802.3 SNAP. Refer to Network on page 150 for more information. 3c. Set the IP Version(IPv4 or IPv6) IP Version is only available when the IPv6 software option (SK-IPV6) is enabled. 3d.
Creating and Starting a Test Case Ethernet TCP Throughput Test Case Ethernet TCP Throughput Test Case TCP Throughput (not available with Ethernet 10G interface): Allows sending TCP/IP traffic to the network and provides an average of the TCP Throughput based on the successfully transported bytes over the test time. Two units running a TCP Throughput test are required. One unit will act as the source (Local) and the other one as the destination (Remote).
Creating and Starting a Test Case Ethernet TCP Throughput Test Case 2. Port configuration: Port 1 (RTU-310 only) is automatically selected. 2a. Select the port Connector Type (Optical or Electrical RJ-45). Optical is automatically selected for the Ethernet 10G interface. 2b. For Electrical RJ-45, if required, select the Ethernet port crossover check box to inverse the pin-to-pair assignment of the UTP cable used. Note: At this point you should have a link up indicated in the Tree view tab.
Creating and Starting a Test Case Ethernet TCP Throughput Test Case 4. Click the TCP Throughput tab and TCP Throughput Configuration tab. 4a. Select Remote as the TCP Mode. 4b. Enter the IP address of the local module in the Listening IP Address field. Create the test on the local module as follow: 1. On the local module, proceed with the test creation as described above (start with step 1 on page 113 up to step 4 inclusively). However, in step 4 do the following: 1a. Select Local as the TCP Mode. 1b.
Creating and Starting a Test Case Fibre Channel BERT Test Case Fibre Channel BERT Test Case Typical Fibre Channel BERT application in Single Port: Typical BERT application in Dual Ports: To create a Fibre Channel test: 1. Test configuration: 1a. Select Fibre Channel as the Interface Type. Fibre Channel is only available with BERT test. 1b. For RTU-310: Select the Topology test type: Single Port or Dual Ports. 1c. Select BERT as the Application Type. 1d. Click Next.
Creating and Starting a Test Case Fibre Channel BERT Test Case 2. Port configuration: 2a. For RTU-310select the port number by clicking on Port 1 or Port 2. For RTU-310Dual Ports, select the first port and proceed with the rest of the configuration for the first port. However, before clicking Finish, click Back several times to return to the port setup window, select the second port and proceed with the rest of the configuration for the second port. Select the Fibre Channel speed. Choices are 1X, and 2X.
Creating and Starting a Test Case Fibre Channel BERT Test Case 3. Framing selection: 3a. Select the test framing mode. FC Unframed consists in sending a frame without EOF (End Of Frame). FC Unframed with the Enable Sync check box selected consists of continuously sending frames that last approximately 1 sec. Thus sending a sync pattern that regularly keeps the link synchronized. Frames are separated by the minimum Inter-Frame Gap (IFG).
Creating and Starting a Test Case Fibre Channel BERT Test Case 4. Framing configuration (available with FC Framed Layer 2 only): 4a. Set the network parameters. Refer to Interface Setup (Fibre Channel) on page 146 for more information. 4b. Select the Login check box to generate a login process when clicking on the Login button. 4c. Select the source and destination World Wide Name (WWN) addresses. WWN is only available when the Enable login check box is selected. 4d.
6 Summary Tabs The summary tabs allow to configure the test parameters and to view the test status and results. Tab Available with Ethernet Fibre Channel Page Test Summary X X 121 Alarm Summary X X 128 Test Summary Gives the test configuration, status, and timer configuration. Click TEST, Summary, and Test.
Summary Tabs Test Summary Test Status Start Time: Indicates the date and time the test has been started. The date and time reset every time the test is restarted. The default time format is ISO (yyyy-mm-dd hh:mm:ss) unless otherwise set from the Application Preferences on page 334. Port Link: Indicates the link status at the input port of the Ethernet/Fibre Channel interface. A green LED indicates that the link is up while a grey LED indicates a link down.
Summary Tabs Test Summary SAM Test Status: Indicates the EtherSAM test status message. Test Status Desciption Pending (--) No sub test is started. Running... A sub test is currently running. Data Transfer... A sub test is running but no test traffic is being transmitted. Completed, A sub test has completed. represents the test global verdict upon completion of the sub test. Aborted, A sub test has been aborted either manually (Stop) or by an alarm.
Summary Tabs Test Summary RFC 2544: Indicates the status of the running RFC 2544 test. This setting is only available with RFC 2544 test. Possible status are: --: Indicates that the test did not run yet. Throughput/Back-to-Back/Frame Loss/Latency - In Progress: Indicates that either the Throughput, Back-to-Back, Frame Loss, or Latency test is running. None - In Progress: Indicates that the link is down and no test is performed. Completed: Indicates that all selected tests are completed.
Summary Tabs Test Summary Clock Configuration Clock Mode indicates the clock mode selected during the test setup. Available with 10Gig-E WAN interface only. Possible choices are: Clock Mode LAN WAN Internal: Internal clock of the unit (STRATUM 3). Internal is the only available clock when 10GigE LAN transceiver mode is selected with Frame Analyzer, BERT, or RFC 2544 test. X X External: Clock from the connected DS1/E1/2M external clock signal (For RTU-310G: EXT. CLK DS1/2M IN port; ).
Summary Tabs Test Summary Timer Configuration Allows to automatically start and/or stop a test case at a given time or for a specific duration. Note: For EtherSAM test, only the Start Time is configurable. Start Time: Allows the selection of the specific time the created test case will automatically start. The start time check box has to be checked to be included in the test timer. Note: A valid start time has to be subsequent to the current time.
Summary Tabs Test Summary On/Off button allows enabling the test timer. An error message is displayed and the test timer is not enabled when the provided start time or stop time is not valid. It is not possible to enable the test timer while the test is running. When the timer is enabled (On), it is possible to disable it even when the test is running. This setting is disabled (Off) by default. When test timer is enabled, it is possible to manually stop a test case using the main test case Stop button.
Summary Tabs Alarm Summary Alarm Summary Click TEST, Summary, and Alarm. The Alarm summary tab gives access to the alarm summary including the test logger. See Test Logger on page 131. Alarm Summary The alarm summary gives current and history summary of alarms and errors encountered during the test. Single port test Dual ports test (RTU-310) Note: The list of available alarms and errors depends on the test case.
Summary Tabs Alarm Summary Test Global: Indicates the presence of any alarms/errors related to the test such as Port, WIS, Ethernet, Pattern, High Layer Protocol, Fibre Channel, and Other. Fibre Channel is not available with RTU-310G. Log Full: Indicates that the logger exceeds it maximum capacity of 5000 events. Port: Indicates the presence of any alarms/errors related to the physical port such as LOS, Frequency, and LOC (Ethernet 10G WAN).
Summary Tabs Alarm Summary 130 Higher Layer Protocol (Ethernet): Indicates the presence of any error related to the HLP over Ethernet (IP header checksum, UDP checksum, TCP Checksum (RTU-310), and IPTV (RTU-310)). Pattern (BERT): Indicates the presence of any alarms/errors related to pattern testing such as No Traffic, Pattern Loss, and Bit Error. Indicates also the Bit Error rate and count. Other: Indicates all other alarms/errors such as SDT (Available with Ethernet BERT test only).
Summary Tabs Test Logger Test Logger Click TEST, Summary, and Alarm. The Test Logger lists the test status/events. Total Events Indicates the total number of recorded events. Note: The Logger lists a maximum of 5000 events, over that amount the logger stops recording and the log full alarm is activated.
Summary Tabs Test Logger Logger Table An event is automatically listed in the logger and saved on the hard drive in case a power failure condition occurs. The logger is cleared when one of the following conditions is met: A test case is stopped and restarted. The test case is cleared. When clicking . Events are listed by ID - Date/Time by default. Events can also be sorted by Data Path or Event by clicking on the corresponding column title. ID: Indicates the Event number.
7 Port Tabs The port tabs allow to configure different port parameters and to view the port analysis. Note: The available tabs listed depend on the activated test path. Available with Tab Ethernet Fibre Channela Page Electrical TXa X 134 RXa X 136 Electrical Optical TX X X 138 Optical RX X X 140 Interface Setup (Ethernet) Interface Setup (Fibre X Channel)a 142 X 146 X 150 TXa X 154 Advanced Auto-Neg. RXa X 159 Network Advanced Auto-Neg. a. Not available on the RTU-310G.
Port Tabs Electrical TX Electrical TX Click TEST, Port, and Electrical TX. Configuration Ethernet port crossover: Allows selecting the type of cable used. 134 When disabled, the cable used should be straight through. When enabled, the cable used should be crossover.
Port Tabs Electrical TX Frequency Note: Frequency offset generation is not available for 10Base-T test and when Through Mode is selected. Frequency Offset (ppm): Allows entering a positive or a negative frequency offset in ppm. Choices are listed in the table below. The default setting is 0. The frequency offset value can be changed on the fly even when activated (On). Actual Frequency (bps): Indicates the frequency (actual frequency + Frequency offset) that will be used for transmission.
Port Tabs Electrical RX Electrical RX Click TEST, Port, and Electrical RX. Alarm Analysis Frequency: The frequency alarm indicates if the received signal rate meets the standard rate specifications (green) or not (red).
Port Tabs Electrical RX Frequency Analysis Note: Frequency Analysis is not available for 10Base-T test. Frequency (bps): Indicates the frequency of the input signal. Frequency Offset: Indicates the offset between the standard rate specification and the rate of the input signal. Max. Positive Offset: Indicates the offset between the standard rate specification and the largest rate recorded from the received signal. Max.
Port Tabs Optical TX Optical TX Click TEST, Port, and Optical TX. Signal Analysis Output Presence: Indicates the presence of a signal at the output port (green) or not (grey). The output presence LED is grey when there is no SFP/XFP. Wavelength (nm): Indicates the detected SFP/XFP wavelength. Possible values are 850, 1310, 1550 nm, or unknown if the SFP/XFP is missing or not recognized. Alarm Generation Note: Alarm generation is not available with RFC 2544 test.
Port Tabs Optical TX Frequency Note: Frequency offset is not available when Through Mode (RTU-310 only) is selected. Frequency Offset (ppm): Available with FC 1x/2x, and 10 Gig-E interfaces only. Allows entering a positive or a negative frequency offset in ppm. The default setting is 0. Actual Frequency (bps): Available with FC 1x/2x, and 10 Gig-E interfaces only. Indicates the frequency (actual frequency + Frequency offset) used for transmission.
Port Tabs Optical RX Optical RX Click TEST, Port, and Optical RX. Signal Analysis Power Level (dBm): Indicates the power level of the input signal in dBm. Input Presence: Indicates if there is a valid signal at the input port (green) or not (grey). Alarm Analysis LOS (Loss Of Signal): A LOS indicates that there is no input signal. Frequency: The frequency alarm indicates that the received signal rate meets the standard rate specifications (green) or not (red).
Port Tabs Optical RX Frequency Analysis Frequency (bps): Indicates the frequency of the input signal in bps. Frequency Offset: Indicates the offset between the standard rate specification and the rate of the input signal. Max. Negative Offset: Indicates the offset between the standard rate specification and the smallest rate recorded from the received signal. Max. Positive Offset: Indicates the offset between the standard rate specification and the largest rate recorded from the received signal.
Port Tabs Interface Setup (Ethernet) Interface Setup (Ethernet) Note: For Fibre Channel test case, see Interface Setup (Fibre Channel) on page 146. Click TEST, Port1/2, and Interface. Configuration Note: The port configuration parameters are disabled when Advanced Auto-Neg. TX on page 154 is enabled. For RTU-310, all port 1 and port 2 configuration parameters are coupled when Through Mode is selected.
Port Tabs Interface Setup (Ethernet) Auto-Negotiation (Not available on RTU-310G) The Auto-Negotiation should be selected if the remote connected port is also set to Auto-Negotiation, otherwise it should be deactivated. When selected, the RTU-310/310G will indicate to the remote port which parameters to use. Auto-Negotiation is not available with the optical 100Mbps and 10Gbps interfaces. The Auto-Negotiation check box is selected by default.
Port Tabs Interface Setup (Ethernet) Flow Control Available with Frame Analyzer, RFC 2544, and TCP Throughput stest only. Flow control is not supported (set to None) for EtherSAM, BERT and Smart Loopback tests. When Flow Control is enabled, the RTU-310/310G will stop transmitting for the requested time value specified by the valid flow control frame received. Choices are None, Enable RX, Enable TX, and Enable RX and TX. Only None and Enable RX are available on RTU-310G.
Port Tabs Interface Setup (Ethernet) Status Link: A green Link LED indicates that there is a link at the input port of the corresponding Ethernet interface. A grey LED indicates that there is no link at the input port of the corresponding Ethernet interface. Auto-Negotiation: Indicates the auto-negotiation status (Not available on RTU-310G). “- -” indicates that the auto-negotiation process is not enabled. Negotiating: indicates that the auto-negotiation process is running and not completed yet.
Port Tabs Interface Setup (Fibre Channel) Interface Setup (Fibre Channel) Note: For Ethernet test case, see Interface Setup (Ethernet) on page 142. Click TEST, Port1/2, and Interface. Configuration PSP (Link Protocol) The Primitive Sequence Protocol (PSP) allows link management when the PSP (Link Protocol) check box is selected and forces the port in Active mode when the PSP (Link Protocol) check box is cleared. The PSP (Link Protocol) check box is selected by default.
Port Tabs Interface Setup (Fibre Channel) Login The capability to log in is available only if a successful link has been established with Framed Layer 2. Enable: Allows, when the Enable check box is selected, to either generate a login process when clicking on the Login button, or to accept a remote Login command. Advertised BB_Credit: Advertised BB_Credit is the number of frame buffers that a local port has available to receive frames from another port.
Port Tabs Interface Setup (Fibre Channel) Port Status: Indicates the status of the port login process. Possible status are: Logged-in: The login process has completed successfully. Failed: The login process has not been able to complete the login process or an error has been detected. However, traffic can still be transmitted. In Progress: The login process is running (not completed yet).
Port Tabs Interface Setup (Fibre Channel) Buffer-to-Buffer Flow Control Enable: The Enable check box is forced selected when Login is selected. The RTU-310/310G will send a Received Ready (R_RDY) automatically after receiving a frame when the Enable check box is selected. Note: Since R_RDY are inserted between frames and have higher priority, in certain condition they may affect the TX throughput.
Port Tabs Network Network Note: Network is only available with Framed Layer 2 and when Through Mode (RTU-310) is not selected. Click TEST, Port, and Network. Coupled to stream For BERT and Frame Analyzer test, the port’s VLAN, IP, and PBB-TE parameters are coupled to the stream (Stream 1 for Frame Analyzer) when the Coupled to stream check box is selected. Thus only the source MAC Address, and MPLS parameters are configurable. The Coupled to stream check box is selected by default.
Port Tabs Network Source MAC Configuration MAC Address: A default and unique Media Access Control (MAC) address is automatically given to the Ethernet port. Select the MAC Address field if the MAC address has to be changed for this port and enter the new MAC address. Note: This MAC address will be used as the source MAC address for all streams. VLAN VLAN: When selected, allows the configuration of VLAN. The VLAN check box is not selected by default.
Port Tabs Network Source IP Configuration For IPv4: Automatic IP Address: Allows to dynamically obtain an IP address from a DHCP (Dynamic Host Configuration Protocol) server. IP Address: Enter the IP address for the Ethernet port. The default IP address is the address set from the Default/Ethernet Test Preferences on page 336. The default factory IP address from the Default Test Preferences is 10.10.x.
Port Tabs Network For IPv6: Displays the Link-Local IPv6 Address, Global IPv6 Address, and Default Gateway Address. IPv6 Config button allows to configure the IPv6 addresses. Refer to IPv6 Address Configuration on page 491 for more information. Frame Format Frame Format allows to select Ethernet II or 802.3 SNAP frame format. OUI is available when the frame format 802.3 SNAP is selected and it allows the selection of the Organizationally Unique Identifier (OUI). Choices are RFC1042, and 802.
Port Tabs Advanced Auto-Neg. TX Advanced Auto-Neg. TX Note: Advanced auto-negotiation is not available with the optical 100 Mbps and 10 Gig-E interfaces or when Through Mode (RTU-310) is selected. Click TEST, Port, and Advanced Auto-Neg TX. Advanced Auto-Neg. Mode The Auto-Negotiation should be activated if the remote connected port is also set to Auto-Negotiation, otherwise should be deactivated. When activated, the RTU-310/310G will indicate to the remote port which parameters to use.
Port Tabs Advanced Auto-Neg. TX Configuration The Speed, Duplex, and Flow Control can be modified only when the Enable Local Capabilities is disabled. Speed: Select the speed of the connected interface. Choices are: For electrical port: 10Mbps, 100Mbps, 1Gbps, and Auto. For optical port: 1Gbps. Duplex: Select the duplex mode for the selected port. Choices are: For 10 Mbps and 100 Mbps speeds (except for BERT and Smart Loopback tests): Full, Half, and Auto.
Port Tabs Advanced Auto-Neg. TX Local Link Partner Description Asym. Asym. & Sym. Local: Only the TX Pause is enabled. L. P.: Only the RX pause is enabled. Backpressure is only performed on the L. P. side. Sym. Sym. Sym. Asym. & Sym. On both sides the RX and TX pause is enabled. Backpressure is performed on both sides. On both sides the RX and TX pause is enabled. Backpressure is performed on both sides. Asym. & Sym. Asym. Local: Only the RX pause is enabled.
Port Tabs Advanced Auto-Neg. TX Auto-Neg. Fault Register Fault Type: Allows the generation of a fault during the negotiation process. Changing the fault type, while enabled, will automatically restart the negotiation process. The fault condition will be generated only once when clicking on the Negotiate button. The default setting is No Error. Choices are: For electrical port: No Error and Auto-Negotiation Error. For 1000Mbps optical port: No Error, Off-line, Link Failure, and Auto-Negotiation Error.
Port Tabs Advanced Auto-Neg. TX Negotiate Button The Negotiate button allows starting the auto-negotiation process. The auto-negotiation process last until the auto-negotiation has succeeded (completed) or the auto-negotiation is manually disabled. When Automatic is selected as speed, the auto-negotiation uses the following prioritization scheme to ensure that the highest common denominator ability is chosen (electrical interfaces) .
Port Tabs Advanced Auto-Neg. RX Advanced Auto-Neg. RX Note: Advanced auto-negotiation is not available with the optical 100 Mbps and 10 Gig-E interfaces. Click TEST, Port1/2, and Advanced Auto-Neg RX. Status Link: A green Link LED indicates that there is a link at the input port of the corresponding Ethernet interface. A red LED indicates that there is no link at the input port of the corresponding Ethernet interface. Auto-Negotiation: Indicates the auto-negotiation status.
Port Tabs Advanced Auto-Neg. RX Duplex: Indicates the negotiated duplex mode. Possible values are Half, and Full. Flow Control: Indicates the negotiated flow control. Possible values are None, Enable TX, Enable RX, and Enable RX and TX. Local Clock: Indicates the negotiated clock source. The local clock is negotiated only in 1000Base-T (electrical). Possible values are Local, and Remote. Note: (--) indicates a link down condition.
8 Stream Generation Tabs Note: Stream generation is not available with Smart Loopback and TCP Throughput (RTU-310) tests. When IPTV is enabled (RTU-310), the stream Configuration is only available in Dual Ports topology on Port 2. Stream generation tabs are not available when Through Mode is selected.
Stream Generation Tabs Overview Overview The Overview tab allows configuration and activation of up to 10 streams for Frame Analyzer test, and only one for RFC 2544 and BERT Ethernet tests. Click TEST, Stream Gen, and Overview. For Frame Analyzer test, see below. For BERT and RFC 2544 tests, see page 165. For Frame Analyzer test Note: The stream configuration is reset when the test is cleared.
Stream Generation Tabs Overview Note: The Individual stream can be enabled/disabled even when the test is started and running. The streams can be enabled one after the other, up to 10, as long as the maximum rate is not reached. For example, if the first stream is using the full rate available, then no other stream can be enabled. However, if the first enabled stream uses half rate, then at least another stream can be enabled using up to half rate.
Stream Generation Tabs Overview Copy Stream button To copy the stream configuration to one or several streams. 164 In the Copy from Stream No list, select the stream number the configuration will be copied from. Check all stream check boxes that will inherit the configuration from the selected stream. Click on OK to confirm the stream configuration copy for all selected streams.
Stream Generation Tabs Overview For BERT and RFC 2544 No: Indicates the stream identification number. Only one stream is available with BERT and RFC 2544. Stream Name: Indicates the stream name and is not editable. The default stream names are: RFC 2544 Stream for RFC 2544 test, and BERT Stream for BERT test. Rate: Indicates the stream rate. The rate is calculated according to the configured traffic shaping (from Transmit Mode and TX Rate fields on page 172).
Stream Generation Tabs Stream Configuration Stream Configuration Press TEST, Stream Gen, and Stream Config. Stream No. For Frame Analyzer, select the stream number from the list. Only stream number 1 is available for BERT test. Stream Profile Note: For Frame Analyzer test only, allows to emulate Voice ( Data ( ) streams. The default setting is Data. ), Video ( ), or For Voice: 166 Voice Codec: Choices are VoIP G.711, VoIP G.723.1, and VoIP G.729. The default setting is VoIP G.711.
Stream Generation Tabs Stream Configuration For Video: Video Codec: Choices are SDTV (MPEG-2), HDTV (MPEG-2), and HDTV (MPEG-4). Only SDTV (MPEG-2) is available with the 10 Mbps interface. The default setting is SDTV (MPEG-2). Nb Channels: Allows the selection of the equivalent number of channels that will be generated for the selected stream. The default setting is 1. Frame Configuration Note: Only data link frame size is available with BERT - Framed Layer 1 test.
Stream Generation Tabs Stream Configuration Transport: Select the transport traffic type (layer 4). Choices are UDP, TCP, and None. The default setting is UDP. Transport is automatically set to None when Network is set to None. Transport is automatically set to UDP when the stream profile is set to either voice or video. Size: Select the frame size for each traffic type. Only configurable when the stream profile is set to Data.
Stream Generation Tabs Stream Configuration The following table lists each component that may affect the minimum size values.
Stream Generation Tabs Stream Configuration For BERT test: For Framed Layer 1, only the Data Link (Ethernet) is configurable from 48 to 10000 for 10Mbps, and 16000 for 100Mbps/1000Mbps/10Gbps. For Framed Layer 2, choices are: Frame Size Traffic Type Minimum Maximum 10 Mbps Data Link 10000 16000 Network 46 a 9982 15982 Transport UDP TCP 26a 38a 9962 15962 a.
Stream Generation Tabs Stream Configuration The following table lists each component that may affect the minimum size values. Component Description VLAN 4 bytes per VLAN (up to 3 VLAN) UDP 8 bytes TCP 20 bytes Ethernet Header 14 bytes LLC and SNAP Headers 8 bytes IPv4 20 bytes IPv6 40 bytes Note: Changing one of the traffic type value will affect the two other traffic type values. Note: Sending traffic with frame size >1518 in switched network may result in losing all frames.
Stream Generation Tabs Stream Configuration Traffic Shaping Transmit Mode: Allows the selection of the Transmit Mode for Stream 1 only. Choices are Continuous, Burst, Ramp, n-Frame, n-Burst, and n-Ramp. The default setting is Continuous. Note: Stream 2 to 10 are not configurable and set to Continuous. Note: Transmit Mode is forced to Continuous with BERT test or with Frame Analyzer when the stream profile is set to either Voice or Video.
Stream Generation Tabs Stream Configuration TX Rate: Enter the transmission rate. The available stream transmission rate will be calculated according to the selected Transmit Mode. The default setting is 100% for 10/100/1000Mbps and 10Gig-E LAN, and 92.8% for 10Gig-E WAN. Unit choices are %, bps, Kbps, Mbps, Gbps, Bps, KBps, MBps, GBps, fps, and IFG. The default setting is %. Note: TX Rate is not configurable when the stream profile is set to either Voice or Video.
Stream Generation Tabs Stream Configuration For Ramp Traffic Shaping Note: Available for Stream 1 with Ramp and n-Ramp transmit modes. 174 Number of Steps: Enter the number of steps. Choices are 2 to 100. The default setting is 10. Step Time: Enter the time duration of each step. Choices are 100 to 8000 milliseconds. The default setting is 1000 milliseconds. Unit choices are ms (milliseconds) and s (seconds). The default setting is ms (milliseconds).
Stream Generation Tabs PBB-TE PBB-TE Allows configuration of PBB-TE streams including B-MAC (source and destination), B-VLAN and I-Tag (as per 802.1ah). Note: PBB-TE has to be enabled during the test setup (refer to PBB-TE on page 106) and the Data Link set to Ethernet/PBB-TE (see Stream Configuration on page 166) to give access to the PBB-TE configuration for the selected stream. Click TEST, Stream Gen, and PBB-TE. Stream No. Select the stream number from the list.
Stream Generation Tabs PBB-TE Destination B-MAC Address: Enter the destination Backbone MAC address for the selected stream. The default setting is 00:00:00:00:00:00. I-TAG (Backbone Service Instance Tag) SID (Service Instance Identifier): Enter the I-TAG SID which identifies the backbone service instance of the selected stream. Choices are 0 through 16777215. The default setting is 256. Priority: Select the B-VLAN user Priority Code Point (PCP). Choices are 0 to 7.
Stream Generation Tabs MAC MAC Note: Only available with Framed Layer 2. Click TEST, Stream Gen, and MAC. Stream No. For Frame Analyzer test, select the stream number from the list. Only stream number 1 is available for RFC 2544 and BERT tests. Frame Format OUI is available when the Data Link is set to 802.3 SNAP and allows the selection of the Organizationally Unique Identifier (OUI). Choices are RFC1042, 802.1H, and User Defined (when Network is set to None).
Stream Generation Tabs MAC Source MAC Address: Indicates the MAC address of the selected stream. Note: The source MAC Address is only configurable through the Network on page 150. Destination MAC Address: Enter the destination MAC address for the selected stream. The default setting is FE:FE:FE:FE:FE:FE. Note: The destination MAC Address field is not accessible when Resolve MAC Address is enabled.
Stream Generation Tabs MAC VLAN Note: For RFC 2544 test, VLAN is only configurable through the Network on page 150. Note: Enabling/disabling VLAN will affect the Data Link value (see Overview on page 162). Enable: When enabled, allows the configuration of VLAN. This setting is disabled by default. VLAN #1 (C-VLAN) / #2 (S-VLAN) / #3 ID (E-VLAN): Indicates the VLAN ID for each enabled VLAN layer. Possible values are 0 through 4095. The value 4095 is reserved while 0 and 1 have specific utility.
Stream Generation Tabs MPLS MPLS Allows MPLS configuration of streams with up to two layers of MPLS labels, COS/EXP and TTL parameters. Note: MPLS has to be enabled during the test setup (refer to MPLS on page 106) and the Network set to MPLS/IPv4, MPLS/IPv6, or MPLS/None (see Stream Configuration on page 166) to gives access to the MPLS configuration for the selected stream. Click TEST, Stream Gen, and MPLS. Stream No. Select the stream number from the list.
Stream Generation Tabs MPLS MPLS Configuration Stacked Headers: Allows the activation of up to two MPLS headers. The default setting is 1. Label: Allows the selection of the MPLS TX labels (0 to 1048575). The default label value is 16. COS/EXP (Class Of Service / Experimental): Select the class of service. The default value is 0 (0000 - Low).
Stream Generation Tabs IP/UDP/TCP IP/UDP/TCP Note: Only available when the network stream configuration is set to IPv4, MPLS/IPv4, IPv6, or MPLS/IPv6. Click TEST, Stream Gen, and IP/UDP/TCP. Stream No. For Frame Analyzer test, select the stream number from the list. Only stream number 1 is available for RFC 2544 and BERT tests. Source For IPv4: 182 IP Address: Enter the IP address for the selected stream. The default setting is 10.10.x.
Stream Generation Tabs IP/UDP/TCP For IPv6: Displays the Link-Local IPv6 Address, Global IPv6 Address, and Default Gateway Address. IPv6 Config button allows to configure the IPv6 addresses. Refer to IPv6 Address Configuration for more information. For both IPv4 and IPv6: IP Multiplicator:Allows changing the 7 LSB (Least Significant bit) of the source IP address as specified in the range. This setting is disabled by default. Range: Select the IP Multiplicator Range. Choices are 1-128 and 0-127.
Stream Generation Tabs IP/UDP/TCP IP TOS/DS for IPv4 or Traffic Class (TOS/DS) for IPv6 Enter the user defined value. Changing the TOS/DS value will affect the Advanced TOS/DS settings and vice versa. Choices are 00 to FF. The default setting is 00. Binary: Displays the user defined IP TOS/DS in binary when enabled. Advanced TOS/DS button: Allows the configuration of the TOS/DS settings. Changing the Advanced TOS/DS settings will affect the IP TOS/DS value and vice versa.
Stream Generation Tabs Payload Payload Note: Not available with BERT test.Not available when the Stream Tag (Frame Analyzer) check box is selected; in this case a PRBS is used as the payload.. Click TEST, Stream Gen, and Payload. Stream No. For Frame Analyzer test, select the stream number from the list. Only stream number 1 is available for RFC 2544 and BERT tests. Pattern Pattern: Allows the selection of the test pattern that will be repeated inside the entire data payload. Choices are 00 to FF.
Stream Generation Tabs Frame Configuration (Fibre Channel) Frame Configuration (Fibre Channel) Note: Frame Configuration is only available with Fibre Channel Framed Layer 1 or Framed Layer 2. Click TEST, Stream Gen, and Frame Config. Frame Delimiters SOF: The SOF represents the Start Of Frame delimiter. The default setting is SOFn3 for Framed Layer 1 and is the only choice for Framed Layer 2.
Stream Generation Tabs Frame Configuration (Fibre Channel) EOF: The EOF represents the End Of Frame delimiter. The default setting is EOFt for Framed Layer 1 and is the only choice for Framed Layer 2.
Stream Generation Tabs Frame Configuration (Fibre Channel) Frame Parameter Size: Allows the selection of the frame size. The default setting is 2148 bytes. The frame size is configurable by 4 byte steps. Choices are: Frame Size (bytes) From Framing 188 To Latency Tag not enabled Latency Tag enabled Framed Layer 1 12 36 2148 Framed Layer 2 40 64 2148 Rate: Allows the selection of the frame rate. Choices are from 0.1 to 100% when the selected rate unit is percentage.
Stream Generation Tabs Frame Configuration (Fibre Channel) FC Header Note: FC Header is only available with Fibre Channel Framed Layer 2 only. The frame header structure of a Framed Layer 2 is presented in the following table. Word Bits 31 ... 24 23 ... 16 0 R_CTL D_ID 1 CS_CTL S_ID 2 TYPE F_CTL 3 SEQ_ID 4 DF_CTL 7 ... 0 SEQ_CNT OX_ID RX_ID 5 15 ... 8 PARAM R_CTL: The Routing Control is set to hexadecimal 01.
Stream Generation Tabs Frame Configuration (Fibre Channel) D_ID: The Destination Identifier specifies the location (address) where an N-Port can find common services. The default setting is hexadecimal FFFFFE.
Stream Generation Tabs Frame Configuration (Fibre Channel) CS_CTL: The Class Specific Control field contains management information for the class of service identified by the SOF. The default setting is hexadecimal 00 corresponding to no preference and no specific DSCP.
Stream Generation Tabs Frame Configuration (Fibre Channel) Bit F_CTL: The Frame Control contains control information related to the frame content. The default setting is hexadecimal 380000.
Stream Generation Tabs Frame Configuration (Fibre Channel) Bit Field Description 9 Retransmitted Sequence 0 = Original Sequence transmission 1 = Sequence retransmission 8 Unidirectional Transmit (Class 1) or Remove Connection (Class 4 only) 0 = Bi-directional transmission (Class 1), or Retain or deactivate circuit (Class 4) 1 = Unidirectional Transmission (Class 1), or Remove circuit (Class 4) 7 6 Continue Sequence Condition Last Data frame - Sequence initiator 00 = No information 01 = Sequence
Stream Generation Tabs Frame Configuration (Fibre Channel) SEQ_ID: The Sequence Identifier specifies the sequence to which the frame belongs. Choices are from 00 to FF. The default setting is hexadecimal 01. DF_CTL: Data Field Control indicates whether any optional headers are included at the start of the data field and what the format is if there are any. The default setting is hexadecimal 00 (no optional headers present). Note: No optional headers are supported.
9 Stream Analyzer Tabs Note: Stream analyzer is only available with Frame Analyzer test. Stream analyzer tabs are not available when Through Mode (RTU-310) is selected. Overview For Frame Analyzer test only, the Overview tab gives stream analysis statistics and throughput for all streams. Click TEST, Stream Analyzer, and Overview. Stream: Indicates the stream identification number. Throughput Cur.
Stream Analyzer Tabs Overview 196 Latency Cur. (ms) indicates for each stream the current measured round trip latency (delay) for all valid frames (valid Latency tag, expected originator identifier value, and no FCS error) received in the last second. Out-Of-Sequence (OOS) indicates for each stream the total count of valid packets having its sequence number smaller than the previously received packet. Seconds, count, rate and percentage values are reported.
Stream Analyzer Tabs Stream Stream Click TEST, Stream Analyzer, and Stream. Note: Available with Frame Analyzer test only. Stream No. Select the stream number from the list. RX Frame Count Indicates the number of frame received matching the selected stream ID. Stream Errors Analysis Out-Of-Sequence (OOS) is declared when a packet has its sequence number smaller than the previously received packet. Frame Loss is declared when missing frames are detected.
Stream Analyzer Tabs Stream Throughput The throughput is measured for each stream on all valid frames (valid Throughput tag with no FCS error). The maximum, minimum, current, and average throughput results are reported. Unit choices are %, and Mbps. The default setting is %. Note: For the Current value, 0 is displayed when no RX rate has been measured in the last second.
10 Traffic Analyzer Tabs Note: The available Traffic Analyzer tabs depend on which test path is activated.
Traffic Analyzer Tabs Ethernet TX Ethernet TX Note: Available with BERT test with Framed Layer 1 and Framed Layer 2 only. Click TEST, Traffic Analyzer, and Eth. TX. PHY Alarm Generation Note: Available with 10Gig-E interface only. Type: The following alarms are available: Link Down: Generates a continuous PCS error (block error). Local Fault: Generates a local fault sequence. Remote Fault: Generates a remote fault sequence.
Traffic Analyzer Tabs Ethernet TX PHY Error Injection Type: The following error is available with both manual and automated injection modes: Symbol (100/1000Mbps) or Block (10Gbps). Amount: Allows the selection of the amount of manual error to be generated. Choices are 1 through 50. The default setting is 1. Send button: Click Send to manually generate error(s) according to the error type and the amount of error. Rate: Click the Rate field to select the rate for the automated error.
Traffic Analyzer Tabs Ethernet TX 202 Rate: Click the Rate field to select the rate for the automated error. Choices are: 1.0E-02, 1.0E-03, 1.0E-04, 1.0E-05, 1.0E-06, 1.0E-07, 1.0E-08, 1.0E-09 or user definable from 1.0E-09 to 1.0E-02. The default setting is 1.0E-04. Continuous: Generates the selected error for each generated frame when the Continuous check box is selected while the On/Off button is enabled (On). The Continuous check box is cleared by default.
Traffic Analyzer Tabs Ethernet RX Ethernet RX Click TEST, Traffic Analyzer, and Eth. RX. Configuration Oversize Monitoring Enables the monitoring of the Oversize error. Alarms Analysis Link Down: Indicates that the Ethernet connection is down. The Ethernet connection is down when there is a local or a remote fault condition.
Traffic Analyzer Tabs Ethernet RX Errors Analysis Block (10Gig-E): The number of frames received with an errored block condition. Symbol (100/1000 Mbps): A Symbol Error is declared when an invalid code-group in the transmission code is detected. Idle (100/1000Mbps): An Idle Error is declared when an error is detected between the end of a frame and the beginning of the next frame.
Traffic Analyzer Tabs Ethernet RX The following errors are only available with Half Duplex mode. Not available when Through Mode (RTU-310) is selected. Not available with RTU-310G. Collision (10/100/1000Mbps): Indicates the number of collisions on the link. Late Collision (10/100/1000Mbps): Indicates the number of collisions that have occurred after a 64 bytes transmission.
Traffic Analyzer Tabs Ethernet Statistics Ethernet Statistics Click TEST, Traffic Analyzer, and Eth. Stats. Valid Frame Counts Note: Valid Frame Counts is only available with Framed Layer 2. 206 Multicast: The number of Multicast frames transmitted/received without any FCS errors. Broadcast frames are not counted as multicast frames. Broadcast: The number of Broadcast frames transmitted/received without any FCS errors. Broadcast frames have a MAC address equal to FF-FF-FF-FF-FF-FF.
Traffic Analyzer Tabs Ethernet Statistics Frame Size Count: Gives the count of each received frame size (valid and invalid). Total: Gives the percentage ratio of each received frame size based on the total count of frames. < 64: frames with less than 64 bytes. 64: frames equal to 64 bytes. 65 - 127: frames from 65 to 127 bytes. 128 - 255: frames from 128 to 255 bytes. 256 - 511: frames from 256 to 511 bytes. 512 - 1023: frames from 512 to 1023 bytes.
Traffic Analyzer Tabs PBB-TE PBB-TE Analyzes streams with PBB-TE data traffic. Note: The PBB-TE check box has been selected during the test setup to give access to the PBB-TE analysis. Refer to PBB-TE on page 106 for more information. Click TEST, Traffic Analyzer, and PBB-TE. Valid PBB-TE Frame Counts Note: TX Count is not available when Through Mode is selected. 208 Unicast: The number of PBB-TE Unicast frames transmitted/received without any FCS errors.
Traffic Analyzer Tabs PBB-TE PPB-TE Frame Size Count: Gives the count of each received PBB-TE frame size (valid and invalid). Total: Gives the percentage ratio of each received PBB-TE frame size based on the total count of frames. < 82: PBB-TE frames with less than 82 bytes. 82 - 255: PBB-TE frames from 82 to 255 bytes. 256 - 511: PBB-TE frames from 256 to 511 bytes. 512 - 1023: PBB-TE frames from 512 to 1023 bytes. 1024 - 1536: PBB-TE frames from 1024 to 1536 bytes.
Traffic Analyzer Tabs Higher Layers Higher Layers Click TEST, Traffic Analyzer, and Higher Layers. Higher Layer Protocol Note: When MPLS is enabled, the following statistics does not include the MPLS frames. IP Header Checksum: Indicates that IP datagrams received have invalid IP header checksum. IP Header Checksum is only available with IPv4. UDP Checksum: Indicates that the UDP segments received have invalid UDP checksum.
Traffic Analyzer Tabs Higher Layers MPLS Note: MPLS is only availabe when enabled from the test setup. Frame Count: Indicates repectively the count of transmitted (TX) and received (RX) MPLS EtherType (0x8847 or 0x8848) frames regardless if FCS is good or not. RX Throughput Bandwidth: Gives the receiving MPLS data rate expressed in Mbps. Utilization: Gives the percentage of MPLS line rate utilization.
Traffic Analyzer Tabs Flow Control Flow Control Click TEST, Traffic Analyzer, and Flow Control. Note: One Quanta equals 512 bits-time. For 1 Gbps interface, one Quanta equal 0.512 μs; for 10 Gbps interface, one Quanta equal 51.2 ns. Injection Note: Flow Control Injection is available with Frame Analyzer test only. Not available when Through Mode (RTU-310) is selected. Packet Pause Time: Enter the pause time value to be transmitted. The default setting is 100 Quanta.
Traffic Analyzer Tabs Flow Control Note: When entering a value in μs/ns it will be rounded to the closest multiple of 0.512 μs for 1000 Mbps, 5.12μs for 100 Mbps, 51.2μs for 10 Mbps, and 51.2 ns. Unit: Select the measurement unit. Choices are Quanta and μsns (nanoseconds). The default setting is Quanta. Inject Pause button: Injects the defined packet pause time. Destination MAC Address Enable: Allows enabling the destination MAC address. This setting is disabled by default.
Traffic Analyzer Tabs Flow Control Statistics 214 Pause Time: Indicates the total number of pause time received from the link partner. Last Pause Time: Indicates the last pause time received from the link partner. Max. Pause Time: Indicates the maximum pause time received from the link partner. Min. Pause Time: Indicates the minimum pause time received from the link partner. Unit: Allows the selection of the measurement unit. Choices are Quanta, ns, μs, ms, and s.
Traffic Analyzer Tabs Traffic Filters Traffic Filters Allows gathering statistics according to the programmed filters. Up to 10 filters can be enabled and defined. Note: The Filters tab is only available when the Advanced Traffic Filtering software option (SK-ADV-FILTERS) is not enabled. Refer to Software Options on page 347. Click TEST, Traffic Analyzer, and Filters. Filter Number (Filter No.) Allows the selection of the filter number (1 to 10).
Traffic Analyzer Tabs Traffic Filters Filter Configuration Allows to configure the criteria for the selected filter. The configuration is only possible when the Enable check box is not selected. Filter Allows the selection of the filter to be used. The default setting is None. Choices are None and: Category Filter Comment Ethernet MAC Destination Address MAC Source Address IPv4 EtherType Apply only to the last EtherType occurrence when VLAN is used. Frame Format Choices are Ethernet II, 802.
Traffic Analyzer Tabs Traffic Filters Category Filter a IPv6 Destination Address IPv6 Comment IPv6 Source Address IPv6 Flow Label IPv6 Next Header Apply only to the last next header occurrence when extension headers are used. IPv6 Traffic Class IPv6 Precedence IPv6 DiffServ Higher Layer TCP Destination Port Apply to IPv4 and IPv6.
Traffic Analyzer Tabs Traffic Filters Value Allows entering the value associated to the selected filter. See Overview on page 162 for more information on possible values. Mask Allows masking the defined filter value. A bit mask of 1 indicates that the corresponding bit in the value is compared for the match. A bit mask of 0 indicates that the corresponding bit in the value is ignored. For binary values, enter the mask value in binary format.
Traffic Analyzer Tabs Traffic Filters Frame Count Indicates the number of frame matching the configured filter’s criteria. Throughput Indicates throughput statistics of frame matching the configured filter’s criteria. Bandwidth: Gives the receiving data rate expressed in Mbps. Utilization: Gives the percentage of line rate utilization. Frame Rate: Gives the receiving number of frames (including bad frames) in fps (Frame Per Second).
Traffic Analyzer Tabs Traffic Filter Configuration Traffic Filter Configuration Allows gathering statistics according to the programmed filters. Up to 10 filters having up to four operands each can be defined and enabled. Note: The Filter Cfg tab is only available when the Advanced Traffic Filtering software option (SK-ADV-FILTERS) is enabled. Refer to Software Options on page 347. Click TEST, Traffic Analyzer, and Filters Cfg. Filter Number (Filter No.
Traffic Analyzer Tabs Traffic Filter Configuration Filter: Allows the selection of the filter to be used. The default setting is None. See Filter on page 216 for the filter list. Value: Allows entering the value associated to the selected filter. See Overview on page 162 for more information on possible values. Mask: Allows masking the defined filter value. A bit mask of 1 indicates that the corresponding bit in the value is compared for the match.
Traffic Analyzer Tabs Traffic Filter Stats Traffic Filter Stats Allows gathering statistics according to the programmed filters (see Traffic Filters on page 215). Note: The Filter Stats tab is only available when the Advanced Traffic Filtering software option (SK-ADV-FILTERS) is enabled. Refer to Software Options on page 347. Click TEST, Traffic Analyzer, and Filters Stats. Filter Number (Filter No.) Allow the selection of the filter number (1 to 10).
Traffic Analyzer Tabs Traffic Filter Stats Throughput Indicates throughput statistics of frame matching the configured filter’s criteria. Bandwidth: Gives the receiving data rate expressed in Mbps. Utilization: Gives the percentage of line rate utilization. Frame Rate: Gives the receiving number of frames (including bad frames) in fps (Frame Per Second).
Traffic Analyzer Tabs Capture Capture Capture is a troubleshooting tool used to capture received data traffic and save complete or truncated frames into a file. It allows to precisely observe network data, to understand errors, and unwanted behavior. Note: The Capture tab is only available with Frame Analyzer application type on Port 1 when the data capture software option (SK-DATA-CAPTURE) is enabled. Refer to Software Options on page 347. Not supported in through mode.
Traffic Analyzer Tabs Capture Frame Length Allows to select the length of the frame that will be saved in the capture buffer. Complete captures the entire frames. Truncated captures only the first specified number of bytes per frame. Use either the Bytes field to manually enter the number of bytes per frame or click on the Truncation Calculator button for automatic bytes per frame calculation.
Traffic Analyzer Tabs Capture Trigger Trigger Type: Allows to define the trigger source criterion that will be used to automatically start/stop the capture when a received frame matches the filter and the trigger criteria. Manual: Automatically start the frame capture when the Capture button is on (green LED) and the test is started (see Global Test Status and Controls on page 44). On Error: Select the error that will be used as the trigger to start the frame capture.
Traffic Analyzer Tabs Capture Trigger Position: Allows the selection of the triggered frame position within the buffer. Post-Trigger: The trigger frame is located at the beginning of the buffer meaning that the buffer will contain the triggered frame with the following frames. Mid-Trigger: The trigger frame is located at the middle of the buffer meaning that the buffer will contain the triggered frame with the preceding and following frames.
Traffic Analyzer Tabs Capture Capture button: Allows to start/stop the data capture. The test must be running (refer to Global Test Status and Controls on page 44) in order to start capturing and recording data into the buffer. The Capture button is not available when the trigger on field match is selected while its trigger parameters are not valid. No data will be recorded in the buffer if no frame matches the filter and the trigger criteria during the data capture.
Traffic Analyzer Tabs Graph Graph Gives the graph showing the test measurement results. Click TEST, Traffic Analyzer, and Graph. The X axis shows the time in seconds while the Y axis shows the percentage utilization.
Traffic Analyzer Tabs FC TX FC TX Click TEST, Traffic Analyzer, and FC TX. Alarm Generation 230 Type: The following error is available: Link Down. Note that a Pattern Loss alarm will be detected when injecting a Link Down while the PSP (Link Protocol) check box is selected (Refer to PSP (Link Protocol) on page 146). On/Off button: The On/Off button is used to activate/deactivate the selected automated error continuously. This setting is disabled (Off) by default.
Traffic Analyzer Tabs FC TX PHY Error Injection Type: The following errors are available with both manual and automated injection modes: Symbol Error. Amount: Allows the selection of the amount of manual error to be generated. Choices are 1 through 50. The default setting is 1. Send button: Click Send to manually generate error(s) according to the error type and the amount of error. Rate: Click the Rate field to select the rate for the automated error. Choices are: 1.0E-02, 1.0E-03, 1.
Traffic Analyzer Tabs FC TX FC Error Injection Note: FC Error Injection is available with Framed Layer 2 only. 232 Type: The following errors are available with both manual and automated injection modes: FCS (RTU-310), C, Oversize, and Undersize. Amount: Allows the selection of the amount of manual error to be generated. Choices are 1 through 50. The default setting is 1. Send button: Click Send to manually generate error(s) according to the error type and the amount of selected error.
Traffic Analyzer Tabs FC RX FC RX ClickTEST, Traffic Analyzer, and FC RX. Alarm Analysis Link Down: Indicates that the fibre channel connection is down. The fibre channel connection is down if there is a local or a remote fault condition including LOS, loss of code-group synchronization, and PSP failure (when enabled). Note: Alarms/Errors are updated only during test execution.
Traffic Analyzer Tabs FC RX Error Analysis Symbol (FC 1x, and 2x): A Symbol error is declared when an invalid symbol excluding the SOF and EOF is detected. FCS: The number of received Framed Layer 2 or Framed Layer 1 (with xPAT) having an invalid FCS. Oversize: An Oversize error is declared when a Framed Layer 2 with a valid FCS exceeds 2148 bytes in length. Undersize: An Undersize error is declared when a Framed Layer 2 with a valid FCS is smaller than 36 bytes in length.
Traffic Analyzer Tabs FC Latency FC Latency Note: Available with FC Framed Layer 1 and FC Framed Layer 2 only. ClickTEST, Traffic Analyzer, and Latency. Latency is only available when the two following conditions are met: Framed Layer 1 or Framed Layer 2 has been selected from the BERT Configuration panel on both TX and RX Configuration. The test pattern should be different than CRPAT, CSPAT, and CJTPAT.
Traffic Analyzer Tabs FC Latency Latency Measurements Round Trip Delay Maximum: Indicates the maximum time taken for a bit to travel from the RTU-310/310G transmitter back to its receiver after crossing a far-end loopback test set. Minimum: Indicates the minimum time taken for a bit to travel from the RTU-310/310G transmitter back to its receiver after crossing a far-end loopback test set.
Traffic Analyzer Tabs FC Statistics FC Statistics Note: Available with FC Framed Layer 1 and FC Framed Layer 2 only. ClickTEST, Traffic Analyzer, and FC Stats. Traffic Statistics TX Frames: Indicates the number of Fibre Channel frames transmitted including frames with errors and aborted frames. RX Frames: Indicates the number of Fibre Channel frames received including frames with errors and aborted frames.
11 WIS Tabs Note: The WIS tabs are only available with 10 GigE WAN transceiver mode. Not available with Smart Loopback test. Not available with RTU-310. Available with Tab Ethernet Fibre Channela Page WIS TX X 239 WIS RX X 243 WIS OH RX X 246 a. Not available with RTU-310G. WIS TX Press TEST, WIS, and WIS TX.
WIS Tabs WIS TX Alarm Generation Note: Alarm generation is available with BERT test only. 240 Type: The following alarms are available. The default setting is SEF. SEF (Severely Errored Framing): Generates more than four consecutive errored framing patterns. LOF (Loss Of Frame): Generates a non-valid framing pattern. AIS-L (Alarm Indication Signal - Line): Generates a “111” pattern for the bits 6, 7 and 8 of the K2 byte.
WIS Tabs WIS TX ERDI-PCD (Enhanced RDI - Path Connectivity Defect): Generates a “110” pattern for bits 5, 6 and 7 of the G1 byte. ERDI-PPD (Enhanced RDI - Path Payload Defect): Generates a “010” pattern for bits 5, 6 and 7 of the G1 byte. On/Off button: The On/Off button is used to activate/deactivate the selected alarm. This setting is disabled (Off) by default. Note: For the SEF alarm, the On/Off button turns Off automatically once the SEF alarm has been sent.
WIS Tabs WIS TX Path Signal Label (C2) The C2 byte is allocated to indicate the content of the STS SPE, including the status of the mapped payload. The default setting is 1A : 10 Gbps Ethernet (IEEE 802.3). J0 Trace Message: Enter the J0 trace value in 16 bytes format. The default message is EXFO 10GigE. J1 Trace Message: Enter the J1 trace value in 16 bytes format. The default message is EXFO 10GigE.
WIS Tabs WIS RX WIS RX Click TEST, WIS, and WIS RX. Error Analysis B1 (BIP-8, Bit-Interleave Parity - 8 bits): The B1 (BIP-8) error indicates a Section parity error by performing a routine even-parity check over all Section bits of the previous frame of a composite signal (located in the first STS-1 of an STS-n signal).
WIS Tabs WIS RX REI-L (Remote Error Indicator - Line): The REI-L error is declared when bits 5 through 8 of the M0 byte contain one pattern from the following binary range: “0001” through “1000” (1 to 8) (located in the first STS-1 of an STS-n signal). REI-P (Remote Error Indicator - Path): The REI-P error is declared when bits 1 through 4 of the G1 byte contain one pattern from the following binary range: “0001” through “1000” (1 to 8) (located in every STS-1 of an STS-n signal).
WIS Tabs WIS RX LOP-P (Loss Of Pointer - Path): For non-concatenated payloads, the LOP-P alarm indicates that a valid pointer is not found in N consecutive frames (where 8 N 10), or N consecutive NDFs (“1001” pattern) are detected. ERDI-PSD (Enhanced RDI - Path Server Defect): The ERDI-PSD alarm is declared when bits 5, 6 and 7 of the G1 byte contain the “101” pattern in five to ten consecutive frames.
WIS Tabs WIS OH RX WIS OH RX Allows verification of the transport overhead information received. Click TEST, WIS, and WIS OH RX. Binary Allows displaying all overhead values either in binary (when enabled) or hexadecimal (when disabled). This setting is disabled by default.
WIS Tabs WIS OH RX Section Overhead Note: Monitor the first timeslot only. A1 and A2: Framing. The value should be hexadecimal F6 for A1 and 28 for A2. J0: Trace: STS-1 #1 of an electrical or OC-N signal. B1: BIP-8. E11: Orderwire. F11: User. D11, D21 and D31: Data Communications Channel (DCC). Line Overhead Note: Monitor the first timeslot only.
WIS Tabs WIS OH RX Path Overhead J11: Trace. B31: BIP-8 C2: Signal Label G1: Status F2: User Channel H41: Multiframe Indicator Z3 and Z4: Growth N1: Tandem Connection Path Signal Label (C2) The C2 byte is allocated to indicate the content of the STS SPE, including the status of the mapped payloads. 1. Not supported in 10GigE standard..
12 IPTV Tabs Note: The IPTV tabs are available with Frame Analyzer application type on the RTU-310 module only. IPTV testing is supported on Port 1 only. In order to operate the IPTV functionality, the IPTV software option must be enabled. Refer to Available Options on page 348. IGMP is not available when Through Mode is selected.
IPTV Tabs IPTV Testing with the RTU-310 IPTV Testing with the RTU-310 The RTU-310 module provides the capability to monitor 10 (default) streams in parallel when the SK-IPTV-MON option is enabled. The IPTV monitoring capacity can be increased to 100 streams when the SK-IPTV-MAXSTREAM is also enabled. The RTU-310 IPTV software option provides over 45 different metrics and statistics including Media Delivery Index (MDI) and TR 101 290 metrics. The TR 101 290 includes PCR jitter and Priority 1 metrics.
IPTV Tabs IPTV Testing with the RTU-310 The RTU-310 module equipped with the IPTV option can be used at different points in the network to collect data and help isolate a fault affecting the IPTV service quality as described in the figure below. While monitoring the selected stream (via its IP address) in the IPTV network, all the functions supported via the Frame Analyzer application are also simultaneously available.
IPTV Tabs Discovery Discovery The Discovery page allows the auto-discovery function to automatically scans the network test point and displays a real-time list of all valid IPTV streams carrying MPEG-2 TS traffic. From the discovered stream list, the user can add the streams to collect statistics from. To access the Discovery tab, click TEST, IPTV, and Discovery. Discovered stream list Each discovered stream is represented by its IP Address and stream name.
IPTV Tabs Discovery The status of each stream, active or inactive, is visually presented as follow: Active: Streams on which MPEG-2 TS data is currently being received. Active streams are listed using black characters. Inactive: Streams that are no longer receiving MPEG-2 TS data. Inactive streams are listed using grey characters. Monitored streams are streams that have been added for IPTV monitoring in the overview page. Monitored streams are highlighted with a light blue background.
IPTV Tabs Discovery Stream Monitoring The Add function adds the streams to the stream monitoring list in the overview page. The IGMP Auto-Join function configures the system to issue join request to join a multicast group once a stream is added while the test is running or when the test will be started. 254 Auto-Add automatically adds all active streams present in the discovered list to the stream monitoring list. This includes all the streams already in the discovered list and the incoming streams.
IPTV Tabs Discovery Selection Options Note: Selection Options is not available when Auto-Add is selected. Only non-monitored streams can be selected. Select Range selects all streams located between two selected streams including the boundaries. To select a range, select a first stream from the list, select a second stream from the list, and click Select Range to complete the selection. Select All selects all the non-monitored streams in the list.
IPTV Tabs Overview Overview The Overview tab provides a summary of the key statistics that can be used as first alert information to evaluate the Quality of Experience (QoE) each monitored stream delivers to the end-user. This tab automatically organizes the Stream Name, its IP Address, MDI (Delay Factor, Medial Loss Rate), TR 101 290, IP rate, and Bandwidth Utilization using sorting criteria. All information presented in the Overview page is updated in real-time.
IPTV Tabs Overview To organize the streams key statistics presentation, the Overview page supports several sorting criterion levels. The main sorting criterion is the Stream Alarm Status that automatically sorts the streams from the most important alarm group to the least (Red-Yellow-Green-White). The second sorting criterion is the Stream Activity Status that can either be Active (stream information is black) or Inactive (stream information is gray).
IPTV Tabs Overview Column Description Join Status: Indicates the join status for each multicast stream only. The join status icons become grayed out when the test is stopped. Icon 258 Status Description Joining The joining state is reported following a join request until the desired stream is received or the join timeout expires. Joined The joined state is reported when the desired stream is received before the join timeout expires.
IPTV Tabs Overview DF (ms): The Delay Factor (DF) provides a measure of the maximum packet delay variation over a period of 1 second. In other words, the metric presents in milliseconds how much buffer would be required in the next downstream network element to compensate for the media packet jitter. Note that by definition (as detailed in RFC 4445) a DF value representing a minimum of one line packet (in ms) is reported when no jitter exists in the network.
IPTV Tabs Overview Stream Status The status of each stream, active or inactive, is visually presented as follow: Active: Streams on which MPEG-2 TS data is currently being received. Active streams are listed using black characters. Inactive: Streams that are no longer receiving MPEG-2 TS data. Inactive streams are listed using grey characters.
IPTV Tabs Overview Add Button The Add button adds streams to the stream monitoring list. The Add button is disabled when the maximum number of monitored stream is reached. Alias map list Streams can be sorted using IP address or Stream Name. Column Description Stream Name: Indicates the configured name associated to an IP address in the Alias Map. See for more details. Dest IP Address: Indicates the IP address associated to the stream presents in the Alias Map.
IPTV Tabs Overview Deselect All deselects all the streams in the list. Manual Entry, when selected, adds one specific stream. Destination IP Address: Enter the IP address of the stream to be added. Manual Range Entry, when selected, adds a range of streams. Dest IP Address From: Enter the first IP address of the range. Dest IP Address To: Enter the last IP address of the range. The range only applies to the last portion of the IP addresses.
IPTV Tabs Overview Delete Button The Delete button removes streams from the stream monitoring list. Streams can be sorted using IP address or Stream Name. Column Description Stream Name: Indicates the configured name associated to an IP address in the Alias Map. See for more details. Dest IP Address: Indicates the IP address associated to the monitored stream. From Monitored List, when selected, allows the deletion of stream(s) from the current monitored list.
IPTV Tabs Overview Manual Entry, when selected, removes one specific stream. Destination IP Address: Enter the IP address of the stream to be deleted. Manual Range Entry, when selected, removes a range of streams. Dest IP Address From: Enter the first IP address of the range. Dest IP Address To: Enter the last IP address of the range. The range only applies to the last portion of the IP addresses. The following example removes all streams IP addresses from 224.10.10.25 to 224.10.30 inclusively.
IPTV Tabs Overview IGMP Button The IGMP button facilitates the management of the IGMP capabilities associated to the multicast streams presented in the Overview stream monitoring list. It provides specific controls (on a stream basis or for a range) that are adapted to the test case running status: stopped or started.
IPTV Tabs Overview Streams can be sorted using Stream Name, Dest IP address, Auto Join, or Join Status. When sorting using Auto Join, the stream will be sorted in the following order: enabled-disabled or disabled-enabled. When sorting using Join Status, the streams will be sorted in the following order: Failed-Joined-Joining-Idle or Idle-Joining-Joined-Failed (see Join-Status on page 258 for more details).
IPTV Tabs Overview Disable Auto-Join / Leave Button: This button toggles from Disable Auto-Join to Leave when the test is started. Disable Auto-Join, available when the test is stopped, disables the IGMP auto-join function. Leave, available when the test is started, issues a leave request for the selected multicast streams and disables the IGMP auto-join function for these streams. Selection Options Select Range selects all streams located between two selected streams including the boundaries.
IPTV Tabs Overview Join Status: The Join-Status is represented by the following icons. Icons become grayed out when the test is stopped. Icon Status Description Auto-Join Indicates the number of monitored streams currently configured for auto-join. Joined Indicates the number of monitored streams currently in joined state. Failed Indicates the number of monitored streams currently in failed state. Idle Indicates the number of monitored streams that have not the IGMP join request active.
IPTV Tabs Overview Alias Map Allows the creation of a table establishing the relation between a destination IP address and a stream name. From the Overview tab, click the Alias Map button. File New clears the current IPTV alias map list. Import allows to import a csv formatted file containing the list of stream name and associated IP address. Note that importing an alias map, will clear the currently used map.
IPTV Tabs Overview Alias Add allows a new alias map entry to the IPTV alias map list. Use the Stream Name and Dest IP Address fields from Edit Selected to enter the required information in order to complete the addition. Delete removes the selected alias. Edit Selected Stream Name: Enter or change the stream name of the selected alias stream. A maximum of 20 characters are allowed. Dest IP Address: Enter or change the destination IP address of the selected alias stream.
IPTV Tabs MDI/TR 101 290 MDI/TR 101 290 The MDI/TR 101 290 page contains the detailed statistics associated to first alert information provided in the Overview page for the Media Delivery Index and DVB Technical Report (TR) 101 290 (PCR Jitter and Priority 1) metrics. This page can be used to better understand the stream behavior over time. It also provides the global configuration associated to each of the supported threshold related to pre-defined metrics.
IPTV Tabs MDI/TR 101 290 Stream The Select Stream pop up allows the selection of a stream to see its statistics/thresholds. Select a stream from the list by clicking on it, or perform a search in the stream list by entering either its Stream Name or Destination IP Address. When entering a Stream Name or the Destination IP Address the search is performed immediately when clicking OK. After a search, the stream is highlighted when found, otherwise the previous selection is kept.
IPTV Tabs MDI/TR 101 290 MDI (Media Delivery Index) The use of the Media Delivery Index as a testing metric provides the tools to measure and diagnose network induced impairments for IPTV streaming media. The Delay Factor (DF) and Media Loss Rate (MLR) together provide a measure of the quality (quality-of-service) of a delivered media stream which can be directly correlated the end users ultimate Quality of Experience (QoE).
IPTV Tabs MDI/TR 101 290 Note: The Delay Factor (and associated Virtual Buffer Size) value behavior can change depending on the stream type: Constant Bit Rate (CBR) or Variable Bit Rate (VBR). For CBR, the streams should have relatively stable inter-arrival time values for each stream while VBR will have widely varying values depending on the media rate variability of the stream. In the case of VBR streams the DF may not be a direct indicator of the end-user experience.
IPTV Tabs MDI/TR 101 290 TR 101 290 The TR 101 290 determines the integrity of the MPEG-2 Transport Stream across the network. Measurable impairments on the MPEG-2 transport stream can occur at the source or while in transit in the network. PCR Jitter (ms) (Program Clock Reference Jitter): Indicates the absolute difference between a known reference and the PCR value decoded from the MPEG-2 Transport Stream packets in the last second. Average, Minimum, and Maximum values are also displayed.
IPTV Tabs MDI/TR 101 290 PMT Error2: Indicates that any of the following conditions appear during a 1 second interval for a stream: Scrambling_control_field is not 00 for all packets containing information of sections with table_id 0x02 on each program_map_PID which is referred to in the PAT. Sections with table_id 0x02 do not occur for the user defined period (See TR 101 290 Threshold on page 277) on each program_map_PID which is referred to in the PMT.
IPTV Tabs MDI/TR 101 290 TR 101 290 Threshold TR 101 290 Threshold parameters apply to all streams. PCR Jitter (ms): Defines the value at which an alarm is declared when crossed. Choices are from 1 to 1000 ms. The default setting is 10 ms. The PCR Jitter (ms) check box is selected by default. Clearing the PCR Jitter (ms) check box will disable alarm reporting for this metric. PAT Error2 (s): Defines the value at which an alarm is declared when crossed. Choices are from 0.1 to 5.0s.
IPTV Tabs IGMP IGMP The IGMP functions associated to all streams currently support Version 2 of the IGMP standard (RFC 2236). The IGMP page provides the ability to control and configure the IGMP capabilities associated to one specific stream defined by a multicast IP address. It provides specific controls that are adapted to the test case running status: stopped or started.
IPTV Tabs IGMP To access the IGMP tab, click TEST, IPTV, and IGMP. Multicast Group Stream The Select Stream pop up allows the selection of a stream to see its statistics/thresholds.
IPTV Tabs IGMP Select a stream from the list by clicking on it, or perform a search in the stream list by entering either its Stream Name or Destination IP Address. When entering a Stream Name or the Destination IP Address the search is done immediately when clicking OK. After a search, the stream is highlighted when found, otherwise the previous selection is kept.
IPTV Tabs IGMP Enable Auto-Join, available when the test is stopped, enables the IGMP auto-join function. The IGMP Auto-Join function configures the system to issue join request to join multicast groups when the test is started. Join, available when the test is started, issues a join request for the selected multicast streams and enables the IGMP auto-join function for these steams. Disable Auto-Join / Leave button: This button toggles from Disable Auto-Join to Leave when the test is started.
IPTV Tabs IGMP Summary (All Multicast Groups) The following gives statistics on all monitored multicast streams. Multicast Group: Indicates the total number of multicast streams. Join Status Icon Status Description Joined Indicates the number of monitored streams currently in joined state. Failed Indicates the number of monitored streams currently in failed state. Joining Indicates the number of monitored streams currently in joining state.
IPTV Tabs IGMP Configuration IGMP Version: Indicates the supported IGMP version which is IGMP version 2. Note that version 2 is interoperable with version 3 as per RFC 3376. Join Timeout (s): The join timeout is the maximum period for the requested stream to be received before it is declared failed. Choices are 1 to 1000 seconds. The default Join Timeout is 5 seconds.
IPTV Tabs Stream Information Stream Information The Stream Info tab completes the information provided by the MDI/TR 101 290 tab by presenting the structure of the stream i.e. encapsulation used, transport stream type, etc. It also gives insights about the stream presence which may help understand the nature of certain metrics obtained from the MDI/TR 101 290 page. To access the Stream Info tab, click TEST, IPTV, and Stream Info.
IPTV Tabs Stream Information Stream The Select Stream pop up allows the selection of a stream to see information about its structure. Select a stream from the list by clicking on it, or perform a search in the stream list by entering either its Stream Name or Destination IP Address. When entering a Stream Name or the Destination IP Address the search is done immediately when clicking OK. After a search, the stream is highlighted when found, otherwise the previous selection is kept.
IPTV Tabs Stream Information Duration Start Time: Indicates the time at which the stream monitoring has started. The stream monitoring start time corresponds either to the time the stream has been added while the test was running or the time the test has been started while the stream was already added to the monitoring list. Elapsed Time: Indicates the number of seconds elapsed since the beginning of the selected stream test.
IPTV Tabs Stream Information IP Rate (Mbps): Indicates the number of megabits received in the last second (Mbps) for the selected stream ID address. Average, Minimum, and Maximum rate values are also displayed. Packet Size (Bytes): Indicates the Average, Minimum, and Maximum IP packet size received during the monitoring period. Packet Count: Indicates the number of IP packets received during the monitoring period excluding packets containing FCS error.
13 Pattern Tabs Note: The Pattern tabs are only available with BERT test. Available with Tab Ethernet Fibre Channela Pattern TX Pattern RX Performance Monitoring (PM) a. b. b Page X X 290 X X 293 X X 359 Not available with RTU-310G. Available with Ethernet/FC Framed Layer 1 and Framed Layer 2, and LAN transceiver mode.
Pattern Tabs Pattern TX Pattern TX Click TEST, and Pattern. Configuration 290 Test Pattern: Select the test pattern from the list. The default setting is PRBS 2^31-1.
Pattern Tabs Pattern TX Invert: The generated test pattern will be inverted if the Invert check box is selected meaning that every 0 will be changed for 1 and every 1 for 0. For example, the pattern 1100 will be sent as 0011. The Invert check box is cleared by default. Coupled: Coupled allows coupling both the TX and RX signal with the same pattern configuration. This setting is enabled by default. User Pattern User Pattern is available when User Pattern is selected as the test pattern.
Pattern Tabs Pattern TX Error Injection Allows selection and configuration of a manual or automated pattern error that will be generated. Type: The only available type of pattern error is Bit Error. Amount: Select the amount of error to be generated. Choices are 1 through 50. The default setting is 1. Send button: Click Send to manually generate the pattern error according to the pattern error type and the amount. Rate: Click the Rate field to select the rate for the selected pattern error. Choices are: 1.
Pattern Tabs Pattern RX Pattern RX Click TEST, and Pattern. Configuration Note: See Configuration on page 290 for more information on Test Pattern, Invert, and User Pattern. Alarm Analysis Pattern Loss For Ethernet, a Pattern Loss is declared when the test sequence and the reference sequence can be unambiguously identified as out of phase.
Pattern Tabs Pattern RX Error Analysis Bit Error: A Bit Error indicates that there are logic errors in the bit stream (i.e., zeros that should be ones and vice versa). Mismatch ‘0’: A Mismatch ‘0’ Error indicates a bit error on a binary “0” (for example ones that should be zeros) found in the test pattern only. Mismatch ‘1’: A Mismatch ‘1’ Error indicates a bit error on a binary “1” (for example zeros that should be ones) found in the test pattern only.
14 RFC 2544 Tabs Note: The RFC 2544 tabs are only available with RFC 2544 test. Tab Configurationa Global Configuration nd Results Throughput a. Available with Ethernet Fibre Channela Page X 296 X 299 Back-to-Back X 304 Frame Loss X 308 Latency X 312 Graph X 317 Not available with RTU-310G. Note: The RFC 2544 measurements are based on all valid Ethernet FCS frames received regardless of their MAC and IP addresses.
RFC 2544 Tabs Global Configuration Global Configuration Click TEST, RFC 2544, and Global. Configuration 296 Frame Size Distribution Distribution: Select the frame size distribution from the list. Choices are RFC 2544 and User Defined. The default setting is RFC 2544. Quantity: Quantity is only available when User Defined has been selected for distribution. Select the quantity of frame size to be used for the test. Choices are 1 through 7. The default setting is 7.
RFC 2544 Tabs Global Configuration Frame Size (Bytes): RFC 2544 gives predefined frame size distribution values. For User Defined distribution, enter up to seven frame size values. Distribution Frame Size a RFC 2544 64 ,128, 256, 512, 1024, 1280, and 1518 User Defined 64a to 16000b a. b. The minimum frame size will be adjusted according to the frame structure and components selected. The maximum frame size is limited to 10000 for 10Mbps interface.
RFC 2544 Tabs Global Configuration Test Procedure Test: Enables the RFC 2544 sub-tests to be performed. Choices are Throughput, Back-to-Back, Frame Loss, and Latency. All tests are selected by default unless otherwise set during the test setup. For FTB-8120NGE and FTB-8130NGE in Dual Test Set round-trip latency measurement mode, the Latency sub-test is not available when the flow direction is set to either Local to Remote or Remote to Local.
RFC 2544 Tabs Throughput Throughput The objective of this test is to find the throughput of the device under test for which there is no frame loss. Starting at full media speed, the rate converges towards the highest throughput without frame loss with the test having a predefined duration (Test Time). The search is done with a basic halving/doubling method until a final value is reached. The test performs the number of trials defined (Number of trials to average).
RFC 2544 Tabs Throughput Configuration Test Time (MM:SS): Enter the test time value. Possible values are 1 second to 30 minutes. The default setting is 1 second (00:01). Accuracy: Enter the accuracy value. The accuracy is not based on the the configured Maximum Rate but on the Ethernet line rate. The default setting is 1%. Possible values are: Interface Accuracy % Gbps MBps 10 Mbps 0.1 to 10 0.00001 to 0.001 0.00125 to 0.125 100 Mbps 0.1 to 10 0.0001 to 0.01 0.0125 to 1.
RFC 2544 Tabs Throughput Maximum Rate: TX-to-RX/P1-to-P2/P2-to-P1/Local to Remote/Remote to Local: Select the maximum rate for the test. The default setting is 100% for 10/100/1000 Mbps and 10 Gig-E LAN, and 92.8571428571429% for 10 Gig-E WAN. P1-to-P2/P2-to-P1 is only available with RTU-310. Choices are: Interface 10 Mbps 100 Mbps 1000 Mbps 10 Gig-E LAN Rate Unit from to % 0.005 100.0 Mbps 0.0005 10.0 % 0.005 100.0 Mbps 0.005 100.0 % 0.005 100.0 Mbps 0.05 1000.0 % 0.005 100.
RFC 2544 Tabs Throughput Results Test State --: Indicates that the test has not run yet. In Progress: Indicates that the test is running. Completed: Indicates that the test is completed. Aborted: Indicates that the test has been interrupted (stopped). Status Message: Gives the test status. Following is the list of status messages.
RFC 2544 Tabs Throughput Throughput Results Frame Size: Indicates the frame sizes used for the test. Up to seven different frame sizes can be displayed. Note: The “--” indicates that the result is not available because the test has not run yet or the measured value is not valid. TX-to-RX/P1-to-P2/P2-to-P1/Local to Remote/Remote to Local: Gives the number of frames for the corresponding direction. P1-to-P2/P2-to-P1 is only available with RTU-310.
RFC 2544 Tabs Back-to-Back Back-to-Back The objective of this test is to find the maximum number of frames that can be sent at maximum throughput without frame loss. A burst of frames (Max. time worth of frames) is sent with minimum inter-frame gaps to the device under test and the number of forwarded frames is counted. If the count of transmitted frames is equal to the number of forwarded frames, the length of the burst is increased and the test is rerun.
RFC 2544 Tabs Back-to-Back Configuration Max. time worth of frame (MM:SS): Choices are 1 to 5 seconds. The default setting is 1 second (00:01). Accuracy (Frames): Enter the Accuracy measurement value in frames. Choices are 1 to 50 frames. The default setting is 1. Nb of Acceptable Errors: Select the number of acceptable errors for the test. Choices are 0 to 10 errors. The default setting is 0 error. Nb of Trials to Average: Select the number of times the throughput test will be generated.
RFC 2544 Tabs Back-to-Back Results Test State --: Indicates that the test has not run yet. In Progress: Indicates that the test is running. Completed: Indicates that the test is completed. Aborted: Indicates that the test has been interrupted (stopped). Status Message: Gives the test status. Following is the list of status messages.
RFC 2544 Tabs Back-to-Back Current Trial: Indicates the current trial number. Unit: Select the throughput result unit. Choices are bps, Bps, Kbps, KBps, Mbps, MBps, Gbps, GBps, fps, %, Bytes/Burst, and Frames/Burst. Default unit is Frames/Burst. Layer: Select the layers used for the Back-to-Back test. Choices are Layer 1,2,3, Layer 2,3, and Layer 3. The default setting is Layer 1,2,3. Layer 1,2,3 contains the Idle, Preamble, Start of Frame Delimiter, MAC address, IP address, and data.
RFC 2544 Tabs Frame Loss Frame Loss The objective of this test is to find the percentage of frames that are lost due to lack of resources. Starting at full media speed, the test is performed for a specific frame size and for the specified duration (Test Time). The test is repeated by decreasing the throughput by the specified granularity (Test granularity), then the test is repeated again until there are two successive trials in which no frames are lost.
RFC 2544 Tabs Frame Loss Test Granularity (%): Select the test granularity. The test granularity is the percentage interval between each throughput value used for the test. For example, 10% granularity means that the test will be performed for 100%, 90%, 80%... of the throughput value. Choices are 1 to 10% (RFC). The default setting is 10%. Nb of trials to average: Select the number of times the test will be generated. Choices are 1 to 50 trials. The default setting is 1 trial.
RFC 2544 Tabs Frame Loss Results Test State --: Indicates that the test has not run yet. In Progress: Indicates that the test is running. Completed: Indicates that the test is completed. Aborted: Indicates that the test has been interrupted (stopped). Status Message: Gives the test status. Following is the list of status messages.
RFC 2544 Tabs Frame Loss Frame Loss Results Frame Size: Indicates the frame sizes used for the test. Up to seven different frame sizes can be displayed. Note: The “--” indicates that the result is not available because the test has not run yet or the measured value is not valid. TX-to-RX/Local to Remote/Remote to Local: Gives the number of frames for the corresponding direction. Current Trial: Indicates the current trial number.
RFC 2544 Tabs Latency Latency The objective of this test is to find the time required for the sent frame to go through the device under test and return to the RTU-310/310G. Starting by sending a stream of frames for the predefined duration (Test Time) and throughput (% Util.) at a particular frame size (Frame Size), an identifying dependent tag is included in one frame. The time at which this frame is transmitted is recorded (timestamp A).
RFC 2544 Tabs Latency Configuration Test Time (MM:SS): Select the test time value. Choices are 1 second to 2 minutes (RFC). The default setting is 1 second (00:01). Nb. of Trials to Average: Select the number of trials to average. Choices are from 1 to 50 trials. The default setting is 1 trial. Minimum Test Time (Seconds): Indicates the minimum time the test requires to run at best condition. The minimum test time is calculated and updated once the test is started.
RFC 2544 Tabs Latency Set All To: Enter a value in the Set All To and click OK to apply the value to all frame sizes. Choices are listed in the above table. Unit: Select the rate’s unit. Choices are %, and Mbps/Gbps. The default setting is %. Copy From Throughput Test: Enable Copy From Throughput Test to get values from the Throughput test results. This check box is selected by default. Margin (%) allows to subtract a relative value to the maximum throughput test values.
RFC 2544 Tabs Latency Results Test State --: Indicates that the test has not run yet. In Progress: Indicates that the test is running. Completed: Indicates that the test is completed. Aborted: Indicates that the test has been interrupted (stopped). Status Message: Gives the test status. Following is the list of status messages.
RFC 2544 Tabs Latency Latency Results Note: The “--” indicates that the result is not available because the test has not run yet or the measured value is not valid. Frame Size: Indicates the frame sizes used for the test. Up to seven different frame sizes can be displayed. TX-to-RX/P1-to-P2/P2-to-P1/Local to Remote/Remote to Local: Gives the latency for the corresponding direction. P1-to-P2/P2-to-P1 is only available with RTU-310.
RFC 2544 Tabs Graph Graph Gives the graph showing the Throughput, Back-to-Back, Frame Loss, or Latency measurement. Click TEST, RFC 2544, and Graph. The X axis shows the frame sizes for Throughput, Back-to-Back, Latency or the TX Rate for Frame Loss. The Y axis shows the subtest results. Data Configuration Graph Displayed: Select the test that has to be displayed. Choices are Throughput, Back-to-Back, Frame Loss, and Latency. Direction: Allows the selection of the test traffic direction.
RFC 2544 Tabs Graph Unit: Select the result unit. Choices are: Sub-test Unit Default unit Throughput bps, Bps, Kbps, KBps, Mbps, MBps, Gbps, GBps, fps, and %. bps Back-to-Back bps, Bps, Kbps, KBps, Mbps, MBps, Gbps, GBps, fps, %, Frames/Burst Bytes/Burst, and Frames/Burst. Frame Loss % Loss frames. % Loss Latency s, ms, μs, and ns. μs Layer/Displayed Step/Mode Layer (Throughput and Back-to-Back): Select the Layer that will be used to compute the results.
RFC 2544 Tabs Graph Displayed Results: Select the displayed results mode: Current, Minimum, Maximum, or Average. The default setting is Current. Legend: Indicates the legend used for the graph according with the direction selected.
15 EtherSAM Tabs Note: The EtherSAM tabs are only available with EtherSAM (Y.1564) test. The EtherSAM tabs are not available on the module set as remote dual test set. Tab Available with Ethernet Fibre Channela Page Overview (Configuration) X 322 Services (Configuration) X 327 Ramp (Configuration) X 333 Burst (Configuration) X 335 Overview (Results) X 338 Service Configuration Test (Results) X 343 Service Performance Test (Results) X 346 a. Not available with RTU-310G.
EtherSAM Tabs Overview (Configuration) Overview (Configuration) The Overview tab allows the activation of up to 10 services and displays a summary of the service settings. Click TEST, EtherSAM Configuration, and Overview. Service Overview Table The overview table allows the activation of up to 10 services and displays some service settings. See Services (Configuration) on page 327 for more information. 322 The Service check boxes allow enabling the corresponding service to be part of the test.
EtherSAM Tabs Overview (Configuration) When the Service Performance Test is enabled, up to 10 services can be enabled one after the other, as long as the total TX Rate (bandwidth) is not reached (Committed). For example, if the first service is using the full bandwidth available, then no other service can be enabled. If the first enabled service uses half bandwidth, then at least another service can be enabled using up to half bandwidth.
EtherSAM Tabs Overview (Configuration) In the third stage of the test, when the Ramp Traffic Policing Rate check box is enabled, the throughput will be increased one step over the CIR+EIR if enabled otherwise over the CIR to compare against expected maximum throughput threshold to declare a pass/fail verdict. The ramp test procedure is generated for each enabled service. The Ramp Test check box is selected by default.
EtherSAM Tabs Overview (Configuration) Sub-Tests Duration Service Configuration Test displays the Service Configuration Test duration in days:hours:minutes:seconds format based on Services, Ramp, and Burst settings (see Services (Configuration) on page 327, Ramp (Configuration) on page 333, and Burst (Configuration) on page 335). Service Performance Test sets the Service Performance Test duration in days:hours:minutes:seconds format. The default setting is 10 minutes.
EtherSAM Tabs Overview (Configuration) Total TX Rate (%) Note: Only available when the Service Performance Test check box is selected. Committed displays the total enabled TX rate (bandwidth) that will be generated by the selected service(s). Available displays the total TX rate (bandwidth) available for traffic generation. Note: For dual test sets, the committed and available TX rate are displayed for both Local and Remote directions.
EtherSAM Tabs Services (Configuration) Services (Configuration) Click TEST, EtherSAM Configuration, and Services. Service No. select the service number from the list. Service Name displays and allows to modify the service name. Click the service name field to change the name of the service. Up to 16 characters are allowed. The default service names are Service 1 to Service 10. Copy Service button allows to copy the configuration of a service to one or several services.
EtherSAM Tabs Services (Configuration) Framing indicates and allows to change the selected framing. The framing is displayed as follow: Data Link/Network/Transport. Refer to Framing Configuration on page 498 for more information. Frame Size indicates and allows to change the selected frame size. Refer to Frame Size Configuration on page 499 for more information. Frame Format indicates and allows to change the selected frame format. Frame format is available when the Data Link is set to 802.
EtherSAM Tabs Services (Configuration) PBB-TE indicates and allows to change the selected frame PBB-TE destination address. PBB-TE is only displayed when PBB-TE has been enabled. Refer to PBB-TE Interface configuration on page 487 for more information. MPLS indicates and allows to change the selected frame label. MPLS is only displayed when MPLS has been enabled. Refer to MPLS Configuration on page 503 for more information.
EtherSAM Tabs Services (Configuration) CIR+EIR sets the best effort allowed traffic for the service. The EIR (Excess Information Rate) value is equal to the “CIR+EIR” value minus “CIR”. The CIR+EIR check box is cleared by default. Rate Unit allows the selection of Mbit/s (default) or Gbit/s as the rate unit for CIR, CIR+EIR, Ramp Traffic Policing Rate, and Burst Max Rate.
EtherSAM Tabs Services (Configuration) Performance Criteria Max Jitter allows to set the maximum jitter value in millisecond (0.015 to 8000 ms), allowed for the service. The default setting is 2 ms. Max Round-Trip Latency allows to set the maximum round-trip latency value in millisecond (0.015 to 8000 ms), allowed for the service. The default setting is 15 ms. For Dual Test Set, the Max Round-Trip Latency is only configurable when the Local to remote direction is selected.
EtherSAM Tabs Services (Configuration) Test Parameters Ramp Traffic Policing Rate allows to stress the rate limiting of the network by sending traffic at higher rate than committed by the SLA. The Ramp Traffic Policing Rate check box is selected by default. Burst Max Rate allows to set the rate that will be used for the CBS and EBS burst tests. Burst Max Rate is only available when the Burst Test is enabled; see Burst Test on page 324.
EtherSAM Tabs Ramp (Configuration) Ramp (Configuration) Note: The Ramp tab is only available when the ramp test is enabled (see Ramp Test on page 323). Click TEST, EtherSAM Configuration, and Ramp. Note: The ramp template is defined globally for all services but the presence of the CIR, CIR+EIR, and Traffic Policing steps are as per each Services configuration. For example a stream may be configured to use CIR, another one to use CIR+EIR, and another one to use both CIR and CIR+EIR with Traffic Policing.
EtherSAM Tabs Ramp (Configuration) Step List Step indicates the step number. Up to 10 steps may be configured; up to 7 pre-CIR, CIR, CIR+EIR, and Traffic Policing. Steps are automatically sorted by the % of CIR value. Value (% of CIR) indicates a percentage of CIR, CIR+EIR, and/or Traffic Policing RX rate (throughput) level. CIR+EIR is part of the step list as soon as it is enabled for at least one service.
EtherSAM Tabs Burst (Configuration) Burst (Configuration) Note: The Burst configuration is only available when the burst test is enabled (see Burst Test on page 324). Click TEST, EtherSAM Configuration, and Burst. Note: The burst template is defined globally for all services but CBS, EBS, and Burst Max Rate parameters are as per each Services configuration.
EtherSAM Tabs Burst (Configuration) Burst Frame represents the burst frame ratio in percentage that is equal to the substraction of 100% - Burst/IR Frame Ratio. Refill Delay represents the post-burst recuperation time in percentage that is equal to the configured Refill Delay Ratio. CIR or CIR+EIR Frames represents the percentage of transmission at CIR or CIR+EIR rate. The CIR or CIR+EIR Frames percentage is equal to the configured Burst/IR Frame Ratio. The “. . .
EtherSAM Tabs Burst (Configuration) Table Note: Result values are only available for enabled services. Services No indicates the service number. Dir.: Direction is displayed for dual test set test case providing bidirectional data. L -> R indicates results from local to remote direction. R -> L indicates results from remote to local direction. CBS Test Time (s) indicates the total time required to perform all burst sequence iterations of the CBS test for this service.
EtherSAM Tabs Overview (Results) Overview (Results) Click TEST, EtherSAM Results, and Overview. Global Progress and Alarms Progress indicates the sub test progress message including the running sub test name and the step number. Test Status indicates the test status message. Test Status Description Pending (--) No sub test is started. Running... A sub test is currently running. Data Transfer... A sub test is running but no test traffic is being transmitted.
EtherSAM Tabs Overview (Results) Test Status Aborted, Description A sub test has been aborted either manually (Stop) or by an alarm. represents the reason why the test has been aborted. Possible reasons are: Link down alarm LOS alarm DTS connection failed Timeout during execution Invalid Configuration (DTS) Unresolved addresses No test enabled Stopped CIR disabled for all services Invalid Burst Configuration Excessive Refill Timea a.
EtherSAM Tabs Overview (Results) Alarms Link Down: Indicates that the Ethernet connection is down due to a local or a remote fault condition. LOS (Loss Of Signal): A LOS indicates that there is no optical input signal. Frequency Alarm: The frequency alarm indicates that the received signal rate meets the standard rate specifications (green) or not (red). For electrical port, refer to Electrical RX on page 136. For optical ports, refer to Optical RX on page 140.
EtherSAM Tabs Overview (Results) Verdict indicates that the performance metrics (Jitter, Latency, and Frame Loss) comply (pass) or not (fail) to the SLA configuration. The verdict is based on the results from all the ramp steps excluding the Traffic Policing step. Max RX Rate indicates the measured maximum utilization RX rate (throughput).
EtherSAM Tabs Overview (Results) Service Performance Test Overview Displays an overview of the service performance test results. Service No indicates the service number. Dir.: Direction is displayed for dual test set test case providing bidirectional data. L -> R indicates results from local to remote direction. R -> L indicates results from remote to local direction. Avg. RX Rate (Mbit/s or Gbit/s) indicates the measured average utilization throughput in either Mbit/s or Gbit/s.
EtherSAM Tabs Service Configuration Test (Results) Service Configuration Test (Results) Click TEST, EtherSAM Results, and Service Configuration Test. Service No allows the selection of the service number. Service name indicates the name of the selected service number. Service Verdict indicates the pass or fail verdict for the selected service, including metrics and maximum throughput, once all the ramp steps and burst tests have been performed on this service.
EtherSAM Tabs Service Configuration Test (Results) Ramp and Burst Tests Table 344 Step, for ramp test, indicates the ramp step number or name. CIR %, for ramp test, indicates the percentage of CIR used for each step (see SLA Parameters on page 329). Burst Test: indicates the two burst tests: CBS and EBS. Burst Size indicates the size of the burst used for the test (see SLA Parameters on page 329).
EtherSAM Tabs Service Configuration Test (Results) Verdict indicates that the performance metrics (Jitter, Latency, and Frame Loss) comply (pass) or not (fail) to the SLA configuration for each ramp’s step and for CBS burst test. Verdict is not available for EBS burst test. Average RX Rate (Mbit/s) indicates the measured average utilization rate (throughput). Note: Each metric with a fail verdict will be displayed with a red background.
EtherSAM Tabs Service Performance Test (Results) Service Performance Test (Results) Click TEST, EtherSAM Results, and Service Performance Test. This tab allows to see two EtherSAM result services simultaneously in loopback and to see the local and remote units simultaneously for dual test sets. 346 Service No allows the selection of the service number. Remote to Local and Local to Remove indicates for dual test set, the service results respectively for remote to local and local to remote.
EtherSAM Tabs Service Performance Test (Results) Sequence Tracking Out-Of-Sequence (OOS) is declared when a valid packet has its sequence number smaller than the previously received packet. Seconds, count, rate, and percentage values are reported. The Out-Of-Sequence will not be considered in the global verdict. Frame Loss is declared when a sequence number is missing.
EtherSAM Tabs Service Performance Test (Results) Round Trip Latency The round trip latency (delay) is measured for each stream on all valid frames. The maximum, minimum, current, and average delay values are reported. The pass or fail verdict is also displayed for the maximum round trip latency. For Dual Test Set, the Round Trip Latency is only displayed on the Remote to Local page. Note: Delay measurements smaller than 15 μs will be discarded, not used for the sampling process, and “< 0.
16 TCP Throughput Tabs Note: The TCP Throughput tabs are only available with TCP Throughput test. Available with RTU-310 only. Tab Page TCP Throughput Configuration 349 TCP Throughput Analysis 353 Note: TCP Throughput software option needs to be enabled to be available. Refer to Available Options on page 348. TCP Throughput Configuration The objective of this test is to find the TCP throughput based on the successfully transported bytes over the test time.
TCP Throughput Tabs TCP Throughput Configuration Click TEST, TCP Throughput, and TCP Throughput Configuration. TCP Mode Since two units are required to perform a TCP Throughput test, one unit must be the source (Local) unit and the other one the destination (Remote). Set the TCP Mode on both units. Choices are Local and Remote. The default setting is Local. TCP Connection Configuration 350 Remote IP Address (Available with Local TCP Mode): On the local unit, enter the IP Address of the remote unit.
TCP Throughput Tabs TCP Throughput Configuration Port: Enter the TCP port number. The default setting is 50201. For the local unit, the specified TCP port will be used for the TCP initialization algorithm with the remote unit. The following TCP segments sent by the local unit will use the TCP port number replied by the remote unit. IP TOS/DS: Enter the IP TOS/DS value. Choices are 00 to FF. The default setting is 00. Binary: Displays the IP TOS/DS value in binary when enabled.
TCP Throughput Tabs TCP Throughput Configuration TCP Throughput Configuration Note: TCP Throughput Configuration is only available on the local unit. Initial Window Size: Enter the window size that will be used when the test is started. Choices are from 1024 Bytes to 65536 KBytes. The entered value will be rounded to the closest multiple of 1024 Bytes. The default setting is 2048 Bytes. The Initial Window Size value must be between the Minimum Window Size and the Maximum Window Size values.
TCP Throughput Tabs TCP Throughput Analysis TCP Throughput Analysis Note: Only available on the local unit. Click TEST, TCP Throughput, and TCP Throughput Analysis. TCP Throughput Statistics Throughput Last: Indicates the last TCP Throughput measurement. Minimum: Indicates the smallest TCP Throughput measurement. Maximum: Indicates the highest TCP Throughput measurement. Average: Indicates the average TCP Throughput measurement over the TCP Throughput test duration.
TCP Throughput Tabs TCP Throughput Analysis Window Size Last: Indicates the last TCP window size. Minimum: Indicates the smallest TCP window size. Maximum: Indicates the highest TCP window size. Unit: Select the window size unit. Choices are Bytes, KBytes, and MBytes. The default setting is KBytes. TCP Statistics TCP Statistics are gathered from packets having good Ethernet FCS, IP header checksum, TCP header checksum, and socket.
17 Advanced Tab Note: The available Advanced tab depends on which test path is activated. Tab Service Disruption Time (SDT) a. Available with Ethernet Fibre Channela X Page 355 Not available with RTU-310G. Service Disruption Time (SDT) Note: Service Disruption Time is only available with BERT test. The Service Disruption Time (SDT) corresponds to the time during which there is a disruption of service due to the absence of traffic or the detection of defects. Click TEST and SDT.
Advanced Tab Service Disruption Time (SDT) Configuration Select the criteria that will be used for the SDT measurement. Note: The service disruption measurements are cleared when changing the criteria. Measurement Mode: Select the SDT measurement mode. Choices are Defect Mode and No Traffic Mode. The default setting is Defect Mode. Defect Mode is based on the detection of defects including LOS, Link down, Invalid FCS, LSS, and Bit errors in the payload.
Advanced Tab Service Disruption Time (SDT) the Test Period value is set to its maximum value: 300000000 μs). The default setting is 20 μs for 10/100/1000Mbps and 10 μs for 10Gbps. Unit measurement selections are μs, ms, and s. Test Period: Represents the period of time used to calculate the SDT measurement. Choices are 20 μs to 5 minutes for 10/100/1000Mbps and 10000 μs to 5 minutes for 10Gbps. Unit choices are μs, ms, s, and min. The default setting is 100 ms.
Advanced Tab Service Disruption Time (SDT) Service Disruption: Indicates the time (in seconds) during which there is a disruption of service due to the absence of traffic or to the detection of defects. The H and C LEDs indicate respectively the current (C) and history (H) SDT measurement states. The C (Current) LED is red if there is an SDT, and lasts until the next No Defect Time period for Defect Mode, and until the next frame for the No Traffic Mode.
18 Common Tab Tab Performance Monitoring (PM) a. Available with Ethernet Fibre Channela X X Page 359 Not available with RTU-310G. Performance Monitoring (PM) The Performance Monitoring tab gives error performance events and parameters for the circuit under test. Note: Performance Monitoring (PM) is only available with BERT test. Not available with 10Gig-E WAN transceiver mode.
Common Tab Performance Monitoring (PM) Standard Select the desired standard from the list. Choices are: Framed Layer 2 Framed Layer 1 G.826 ISM X Xa G.826 OOSM X X G.821 X X Standard Traffic Analyzer Pattern Unframed X a. Available with xPAT test pattern only. xPAT patterns are available with BERT 1000Mbps optical test using Framed Layer 1. Statistics EFS (Error Free Second): Gives the number of seconds within which no bit error occurred. EC (Error Count) (G.
Common Tab Performance Monitoring (PM) SES (Severely Errored Second) For G.821: Gives the number of seconds within which a bit error ratio is 10-3, or during which Loss Of Signal (LOS), Link down, or Pattern Loss is detected. For G.826: Gives the number of seconds within which EB count is SES threshold (30%), or at least one NE defect occurred. BBE (Background Block Error) (G.826 only): Gives the count of Errored Block not occurring as part of a SES.
Common Tab Performance Monitoring (PM) UAS (Unavailable Second): Gives the count of the seconds corresponding to the periods of time within which SES errors occurred for at least 10 consecutive seconds. The unavailable period ends at the beginning of the next available period represented by ten consecutive seconds within which no SES errors are detected. ESR (Errored Second Ratio): Gives the ratio of the number of ES in available time (AS) during a fixed measurement interval.
19 Expert Mode Tabs Note: The Expert Mode tabs are only available with BERT and RFC 2544 Ethernet tests (not available with Fibre Channel). Tab Available with Ethernet Fibre Channela Page Expert Mode (RFC 2544) X 364 Throughput (RFC 2544) X 366 Back-to-Back (RFC 2544) X 368 Frame Loss (RFC 2544) X 370 Latency (RFC 2544) X 372 Expert Mode (BERT) X 374 Port (BERT) X 375 Ethernet (BERT) X 377 Pattern (BERT) X 379 a. Not available with RTU-310G.
Expert Mode Tabs Expert Mode (RFC 2544) Expert Mode (RFC 2544) Expert Mode allows the configuration of the thresholds for which each statistic will be compared to declare a PASS or FAIL verdict. Click TEST and Expert Mode. Expert Mode Allows enabling/disabling the Expert Mode. This setting is disabled by default.
Expert Mode Tabs Expert Mode (RFC 2544) Expert Mode Status Gives the verdict, Pass or Fail, of the Throughput, Back-to-Back, Fame Loss, and Latency tests according to the Expert Mode settings. Pass is declared if all result values meet the configured criteria. Fail is declared if any result value does not meet the configured criteria.
Expert Mode Tabs Throughput (RFC 2544) Throughput (RFC 2544) Click TEST, Expert Mode, and Throughput. Enable Criteria: Allows to enable Throughput Pass/Fail criteria. This setting is disabled by default. Note: Both Enable Criteria and the test itself (see Global Configuration on page 296) have to be enabled for a specific test to be able to change its criteria values. Frame Size: Indicates the frame sizes selected for the test.
Expert Mode Tabs Throughput (RFC 2544) Layer: Select the Layer. Choices are Layer 1,2,3, Layer 2,3, and Layer 3. The default setting is Layer 1,2,3. Layer 1,2,3 contains the Preamble, Start of Frame Delimiter, MAC address, IP address, and data. Layer 2,3 contains the MAC address, IP address, and data. Layer 3 contains the IP address, and data. Displayed Results: Select the displayed results mode. Choices are Current, Minimum, Maximum and Average. The default setting is Current.
Expert Mode Tabs Back-to-Back (RFC 2544) Back-to-Back (RFC 2544) Click TEST, Expert Mode, and Back-to-Back. Enable Criteria: Allows to enable Back-to-Back Pass/Fail criteria. This setting is disabled by default. Note: Both Enable Criteria and the test itself (see Global Configuration on page 296) have to be enabled for a specific test to be able to change its criteria values. Frame Size: Indicates the frame sizes selected for the test.
Expert Mode Tabs Back-to-Back (RFC 2544) Layer: Select the Layer. Choices are Layer 1,2,3, Layer 2,3, and Layer 3. The default setting is Layer 1,2,3. Layer 1,2,3 contains the Preamble, Start of Frame Delimiter, MAC address, IP address, and data. Layer 2,3 contains the MAC address, IP address, and data. Layer 3 contains the IP address, and data. Displayed Results: Select the displayed results mode. Choices are Current, Minimum, Maximum, and Average. The default setting is Current.
Expert Mode Tabs Frame Loss (RFC 2544) Frame Loss (RFC 2544) Click TEST, Expert Mode, and Frame Loss. Enable Criteria: Allows to enable Frame Loss Pass/Fail criteria. This setting is disabled by default. Note: Both Enable Criteria and the test itself (see Global Configuration on page 296) have to be enabled for a specific test to be able to change its criteria values. Frame Size: Indicates the frame sizes selected for the test.
Expert Mode Tabs Frame Loss (RFC 2544) Displayed Step: Indicates the last percentage of the speed used for the test. Possible values are 100% (or % of the maximum speed) to 0% with increment set by the Test granularity from the Frame Loss on page 308. The default setting is 100% (or % of the maximum speed). Displayed Step is only available once the Frame Loss test is running or completed. Displayed Results: Select the displayed results mode. Choices are Current, Minimum, Maximum, and Average.
Expert Mode Tabs Latency (RFC 2544) Latency (RFC 2544) Click TEST, Expert Mode, and Latency. Enable Criteria: Allows to enable Latency Pass/Fail criteria. This setting is disabled by default. Note: Both Enable Criteria and the test itself (see Global Configuration on page 296) have to be enabled for a specific test to be able to change its criteria values. Frame Size: Indicates the frame sizes selected for the test.
Expert Mode Tabs Latency (RFC 2544) Mode: Select the Mode. Choices are Cut Through and Store and Forward. The default setting is Store and Forward. Cut Through allows the calculation of the propagation time of a bit. Store and Forward allows the calculation of the propagation time of a frame. Displayed Results: Select the displayed results mode. Choices are Current, Minimum, Maximum, and Average. The default setting is Current.
Expert Mode Tabs Expert Mode (BERT) Expert Mode (BERT) Expert Mode allows the configuration of the thresholds for which each statistic will be compared to declare a PASS or FAIL verdict. Click TEST and Expert Mode. General Properties Expert Mode: Allows enabling/disabling the Expert Mode. This setting is disabled by default. Expert Mode Status Verdict: Gives the verdict, Pass or Fail, of the Port, Ethernet and Pattern tests according to the Expert Mode settings.
Expert Mode Tabs Port (BERT) Port (BERT) Click TEST, Expert Mode, and Port. Enable Criteria: Enable Criteria enables configuring the port (Port 1 and Port 2 for Dual Ports on RTU-310) Pass/Fail threshold values. This setting is disabled by default. Alarms LOS (Optical interface only): Enter the count of the seconds in which one or more LOS alarms can occur before declaring a Fail condition. Choices are 0 to 1800 seconds. The default setting is 0 second.
Expert Mode Tabs Port (BERT) Frequency Enter the minimum and maximum frequency offsets either in ppm or bps according to the unit selection. Frequency (bps): Indicates the frequency of the input signal. Offset Max: Enter the frequency maximum value allowed before declaring a Fail condition. Choices are from 0 to 120 ppm. The default setting is 100 ppm. Offset Min: Enter the frequency minimum value allowed before declaring a Fail condition. Choices are from -120 ppm to 0 ppm.
Expert Mode Tabs Ethernet (BERT) Ethernet (BERT) Click TEST, Expert Mode, and Ethernet. Enable Criteria: Enable Criteria enables configuring the Ethernet Pass/Fail threshold values (Port 1 and Port 2 for Dual Ports on RTU-310). This setting is disabled by default. Alarms Enter the threshold value for Link Down. Choices are 0 to 1800 seconds. The default setting is 0 second.
Expert Mode Tabs Ethernet (BERT) Errors Enter the threshold value for each error. Error Second Count Rate Default Block (10Gbps) 0 to 1800 0 to 18000000000000 1.0E-20 to 0 second seconds 1.0E-00 FCS Error (Framed Layer 2) 0 to 1800 0 to 27000000000 seconds 4.0E-11 to 0 second 1.0E-00 Symbol 0 to 1800 0 to 2250000000000 1.0E-14 to 0 second (10/100/1000Mps) seconds 1.0E-00 Idle 0 to 1800 0 to 2250000000000 1.0E-14 to 0 second (10/100/1000Mps) seconds 1.
Expert Mode Tabs Pattern (BERT) Pattern (BERT) Click TEST, Expert Mode, and Pattern. Enable Criteria: Enable Criteria enables configuring the Pattern pass/fail threshold values and parameters (Port 1 and Port 2 for Dual Ports on RTU-310). This setting is disabled by default. Alarms Enter the threshold value for each alarm: Pattern Loss and No Traffic. Status: Indicates the real-time pass/fail condition. Grey LED: Indicates that Expert Mode is disabled or the test did not run yet.
Expert Mode Tabs Pattern (BERT) Errors Enter the threshold value for Bit Error. Error Second Count Rate Default Bit Error 0 to 1800 seconds 0 to 18000000000000 1.0E-14 to 0 second 1.0E-00 Status: Indicates the real-time Pass/Fail condition. Grey LED: Indicates that Expert Mode is disabled or the test did not run yet. Green LED: Indicates that the threshold is respected (Pass). Red LED: Indicates that the threshold is not respected (Fail). 380 Unit: Select the unit.
20 System Tabs The System tab gives access to tabs containing general functions related to the RTU-310/310G operation.
System Tabs Preferences Preferences Click System, and Preferences/Default Perference. Time Options Time Format: Sets the absolute time format of the EX-Vu (current time and timers). The default setting is ISO. Choices are: ISO displays the time and timers with the yyyy-mm-dd hh:mm:ss format. USA displays the time and timers with the mm/dd/yy hh:mm:ss AM/PM format. Time Zone Display Mode: Allows the selection of the time zone source. The default setting is Local.
System Tabs Preferences Page Management Ethernet Test Module Reset to Display Default Pages Layout when enabled, resets the page layout to its default layout each time a test is modified.
System Tabs Default/Ethernet Test Preferences Default/Ethernet Test Preferences Click Default/System and Preferences/Default Test Preferences/Eth. Test Preferences. For RTU-310 For RTU-310G Allows setting the Ethernet default test parameters that will be applied every time a test is created manually using Test Setup. Changes to the default test preferences will only apply when a new test case is created.
System Tabs Default/Ethernet Test Preferences Interface Configuration Note: The following interface configuration parameters are available for both ports (RTU-310) and apply only to IPv4 at the exception of Sequence Tag in TX that also apply to IPv6. Auto-Negotiation: The Auto-Negotiation check box should be selected if the connected switch is also set to Auto-Negotiation, otherwise the Auto-Negotiation check box should be cleared.
System Tabs IPv6 Test Preferences IPv6 Test Preferences Click System and Preferences/IPv6 Test Preferences. Note: The following configuration parameters apply to both the stream and the interface. Port Selector (RTU-310): Allows the selection of the port number to see or change its parameters. Choices are Port 1 and Port 2. The default setting is Port 1. IP Version: Allows the selection of the IP version (IPv4 or IPv6) that will be selected by default when creating a test case.
System Tabs IPv6 Test Preferences Global IPv6 Address: The Global IPv6 Address (GUA) is used to communicate with on-link neighbors and for global communication with hosts outside the subnet. Mode None disables the Global IPv6 address and the Default Gateway address. Stateless Auto allows automatic generation of the IPv6 address based on the Link-local address interface ID and the prefix obtained from router advertisements.
System Tabs IPv6 Test Preferences Default Gateway Address: The Default Gateway Address is used to forward packets outside the subnet. Default Gateway Address is not available when the Global IPv6 address Mode is set to None. Mode 388 Automatic allows automatic selection of the default gateway. Static allows entering the default gateway IP address. The default address is FE80::.
System Tabs FC Test Preferences FC Test Preferences Note: Not available with RTU-310G. Click System and Preferences/FC Test Preferences. For RTU-310 Allows setting the default test parameters that will be applied every time a test is created manually using Test Setup. Changes to the default test preferences will only apply when a new test case is created. The default test preferences can be overwritten by the test setup configuration.
System Tabs FC Test Preferences Advertised BB_Credit: Advertised BB_Credit is the number of frame buffers that a local port has available to receive frames from another port, and is advertised to the remote port through the login process. Enter the Advertised BB_Credit value. Choices are from 1 to 65535. The default setting is 10. 390 WWN Source: The Worldwide name is only available when Login is selected with Fabric network topology. Enter the Worldwide name source address.
System Tabs RTU Information RTU Information The RTU Information provides details of the RTU-310/310G hardware and the software installed on the RTU platform. Click System and RTU Information. RTU Description Product Name indicates the name of the RTU platform. Hardware Assembly Revision indicates the product assembly hardware revision. Serial Number indicates the RTU serial number. Calibration Date indicates the RTU’s last calibration date.
System Tabs RTU Information Hardware Options Provides hardware information related to the SFP. Available only with RTU-310. The following information is available for the inserted SFP: Port Number Vendor Name Part Number Serial Number Revision Number Connector Type: LC, MT-RJ, etc. Speed: 1000Base-SX, FC-1X, FC-2X. Type: FC: Intermediate Distance Wavelength: 850 nm, 1310nm, and 1550nm. Mode: FC: Multimode(M6) Fiber, FC: Multi-Mode(M5) Fiber.
System Tabs RTU Setup RTU Setup Click System and the RTU Setup. LAN Interface The following interface configuration parameters are available for the LAN Interface port. To apply the changes to the IP parameters, click Apply. To reset any changes to the IP parameters, click Cancel. Automatic IP Address: Allows the unit to obtain a LAN IP address automatically using the DHCP network application protocol. This setting is enabled by default.
System Tabs RTU Setup Default Gateway: Sets the Default Gateway for the LAN Interface port.If Automatic IP Address is selected, it displays the granted Default Gateway. The default value is blank. Acquired Server Address: Displays the current DHCP server address value. Lease Obtained: Displays the current DHCP lease obtained value. Lease Expires: Displays the current DHCP lease expiry value.
System Tabs RTU Setup Current Date and Time: Allows the selection of the specific date (YYYY-MM-DD) and time (HH:MM:SS) when the IP address of a NTP server is not specified. Time Zone: Allows the selection of the time zone from the drop-down list. Daylight Saving: Allows automatic adjustment of clock for daylight saving changes. BrixWorx Server You can configure RTU-310 in BrixWorx. The following tests can run on RTU-310 for BrixWorx.
System Tabs Software Options Software Options Allows the installation of software options. A software option key will be generated by EXFO for each option bought. Click System, and Software Option. Note: Software option installation is only possible when no test case is created. Software options for RTU-310 Configuration The software license key can be either entered (typed) or loaded (using the Load Key button). Software Option key allows typing the software option key.
System Tabs Software Options Available Options The available software options are listed with the Status indicating what software options are installed (enabled) or not (disabled) on the module. For RTU-310 Category Name Interface SK-10M-E-AP Description The 10Mbps Ethernet interface is enabled on both ports. SK-100M-E-AP The 100Mbps Ethernet interface is enabled on both ports. SK-1000M-E The electrical 1000Mbps Ethernet interface is enabled on port #1.
System Tabs Software Options Category Feature Name Description SK-802-3AH The 802.3ah OAM Protocol is enabled. SK-TCP-THPUT The TCP Throughput measurement application is enabled. SK-IPTV-MON The IPTV testing is enabled with a testing capacity of 10 streams. SK-IPTVMAXSTREAM Increases the IPTV testing capacity to 100 streams.
System Tabs Software Options For RTU-310G Category Interface Name Description SK-ADV-FILTERS Advanced Traffic Filtering SK-ETHERSAM Ethernet Service Activation Methodology Application Type SK-IPV6 Internet Protocol Version 6 (IPv6) SK-LAN LAN testing capabilities SK-WAN WAN testing capabilities SK-PBB-TE Provider Backbone Bridge with Traffic Engineering SK-MPLS Multi-Protocol Label Switching Ethernet Test Module 399
System Tabs Clock Synchronization Clock Synchronization Note: Clock Synchronization is only available for Ethernet 10G. Click System and Clock Synchronization. RX Configuration: Allows the selection and configuration of the input clock. This clock will be used for test synchronization if External clock has been selected during test setup and/or for the backplane configuration when External clock mode is selected Interface Type: Allows the selection of the clock interface. Choices are None, DS1, and E1.
System Tabs Clock Synchronization For E1: PCM30, PCM30 CRC-4, PCM31, and PCM31 CRC-4. The default setting is PCM30. Alarm Analysis LOS (Loss Of Signal): The LOS alarm indicates absence of an input signal or an all-zeros signal is received. AIS (Alarm Indication Signal): The AIS alarm is declared when an unframed all-ones signal is received.
System Tabs Clock Synchronization Frequency: The Frequency alarm indicates if the received signal rate meets (green) or not (red) the following rate specifications. Signal Rate specification DS1 1544000 ±15 bps (±9.2 ppm) E1 2048000 ±19 bps (±9.2 ppm) 2MHz 2048000 ±19 Hz (±9.2 ppm) Frequency Analysis Frequency (bps) displays the received DS1/2M/E1signal rate in bps.
System Tabs Clock Synchronization REF Out Note: Ref Output is only available with RTU-310G, the REF OUT signal is automatically enabled on the REF OUT port (SMA connector) when the laser is turned ON. Configuration Divider Ratio: Allows the selection of the transmit test clock divider. Choices are 16 and 32. The following table shows the corresponding output frequency in MHz. Divider Ration Ethernet Test Module LAN transceiver WAN transceiver mode mode 16 644.53 MHz 622.08 MHz 32 322.
System Tabs Alarms & Log Alarms & Log Provides information on the system alarm status and system alarm logger. Click System and Alarms & Log. System Alarms Maintains the history and current alarm status as per the critical, major or minor severity levels. 404 Critical High Temperature: Indicates high temperature fault conditions. Internal Error: Indicates software related internal errors Major Power Failure: Indicates power failure. Unit Reset: Indicates a system restart.
System Tabs Alarms & Log Minor Fan Failure: Indicates that one of the internal fan’s rotation speed has decreased below 50 percent of the normal operating speed. This alarm is cleared when the fans rotation speed goes above 60 percent of normal operating speed for at least 10 seconds. Battery A/B Failure: Indicates that the DC power input (Battery A or Battery B) is lost. Clear Alarms/Log: Provides a single control to delete the System Alarm Logger content and clear all System Alarm statuses.
21 Tools Tabs Note: The Tools tabs are only available when a test is created. Tab Script Available with Ethernet Fibre Channela Page X 408 Ping & Trace Ping Configuration Routeb Trace Route Configuration X 412 X 417 ENIU OAMbc ENIU Configuration X 421 ADC Configuration X 422 Traffic Scan X 433 Traffic Scan a. b. c. Script Not available with RTU-310G. Not available when Through Mode is selected. ENIU OAM is only available with Framed Layer 2. ENIU OAM is not available with 10Gig-E.
Tools Tabs Script Script The scripting tool allows a user to automate test process by creating scripts containing test setup configuration and actions. The scripting tool allows creating, saving, loading, modifying, and running script files. The script creation can be done manually or using the integrated recorder tool (Script Tool). Creating and editing a script is only recommended for users with writing knowledge of Visual Basic .NET (Visual Basic) programming language. Click Tools and Script.
Tools Tabs Script Edit Lists the content of the current script and allows its edition. Users with writing knowledge of Visual Basic .NET (Visual Basic) programming language will be able to customize their scripts by inserting delays for example. Note that delays are not automatically inserted during recording. Output Gives status of the running script. File Allows loading, saving, and generating a new script file.
Tools Tabs Script Script Tools Allows automatic generation of scripts by setting step by step the parameters from the Test Setup tab and related test tabs. Click Record to start the recording of the script. Click the File Name field, a pop-up keyboard is displayed, enter a file name for the new script followed by the scp extension, and click Save. The scp extension is automatically added when omitted. The record button LED is red while recording.
Tools Tabs Script Note: However, for RFC 2544, all selected tests (Throughput, Back-to-Back, Frame Loss, and/or Latency) must complete before stopping the recording because tests that didn’t run will not be part of the script. Click Play to run the script that generates the connection and sets the parameters as recorded. The Edit tab automatically switches to the Output tab when playing a script allowing to see the script running status.
Tools Tabs Ping Configuration Ping Configuration The Ping tool is used to determine if a network device is reachable. Ping is not available when no test is created Click Tools, Ping, Configuration, and in the Tool list, click Ping. Note: For Trace Route, see Trace Route Configuration on page 417. Setup IP Address/IPv6 Address: Enter the IP address of the network device to be detected. The IP address version is as per the version selected during the test setup.
Tools Tabs Ping Configuration Delay (ms): Available for ping only. Enter the delay between each attempt (PING). Choices are 100 to 10000 ms. The default setting is 1000 ms. Data Size (Bytes): Available for ping only. Enter the buffer size that will be sent to the network device to be detected. Choices are 0 to 1472 bytes. Default value is 32 bytes. Time To Live (TTL) for IPv4 Hop Limit (TTL) for IPv6 Enter the maximum number of hops the packet can go through. Choices are 1 to 255.
Tools Tabs Ping Results Ping Results Click Tools, Ping, in the Tool list, click Ping, and click Result. Note: For Trace Route, see Trace Route Configuration on page 417. To succeed, a Ping command shall be acknowledged by the network device within a given delay. Typically a Ping command can fail for the following reasons: The IP address is unavailable or unknown. The time allowed to perform the Ping command is too short The remote device is not supporting ICMP messaging.
Tools Tabs Ping Results Status Description Time Out When an ICMPv4/ICMPv6 echo reply was not received within the defined timeout. Destination Specified is invalid With reserved IP addresses: For IPv4: 0.0.0.0, 127.0.0.0, and all addresses above 240.0.0.0 (Class E and above). For IPv6: 0::/8 (reserved/unspecified), 0::1/128 (Loopback), FF00::/8 (Multicast). TTL Expired When the number of TTL was insufficient to reach the destination host.
Tools Tabs Ping Results For IPv4: Replied From: Indicates the IP address of the replier. Bytes: Indicates the buffer size of the ICMP echo response. Time (ms): Indicates the time of response in milliseconds. TTL: Indicates the TTL of the ICMP echo response. For IPv6: Replied Details: Indicates the IP address of the replier, the buffer size of the ICMP echo response (bytes), the time of response in milliseconds, and the TTL of the ICMP echo response (Hop Limit).
Tools Tabs Trace Route Configuration Trace Route Configuration Trace Route is used to obtain the list of all routers identified between the local port (RTU-310/310G) and the destination IP port. Click Tools, Configuration, and in the Tool List, click Trace Route. For Ping, see Ping Configuration on page 412. Setup IP Address: Enter the IP address of the network device to be detected. The IP address version is as per the version selected during the test setup.
Tools Tabs Trace Route Results Trace Route Results Click Tools, Ping, Configuration, in the Tool list, click Trace Route, and click Results. For Ping, see Ping Results on page 414. To succeed, a Trace Route command shall be acknowledged by the network device within a given delay. Typically a Trace Route command can fail for the following reasons: The IP address is unavailable or unknown. The time allowed to perform the Trace Route command is too short.
Tools Tabs Trace Route Results Status: Indicates the status of the attempt. Status Description Successful Valid ICMPv4/ICMPv6 echo reply received. User Aborted When a user has manually stopped the Ping function before the end of attempts. Time Out When an ICMPv4/ICMPv6 echo reply was not received within the defined timeout. Destination Specified is invalid With reserved IP addresses: For IPv4: 0.0.0.0, 127.0.0.0, and all addresses above 240.0.0.0 (Class E and above).
Tools Tabs Trace Route Results Replied From: Indicates the IP address of the replier. Time (ms): Indicates the time of response in milliseconds. Statistics 420 Packets Transmitted: Indicates the number of sent packets. Packets Received: Indicates the number of received packets.
Tools Tabs ENIU Configuration ENIU Configuration Allows supporting the Operation, Administration, and Maintenance (OAM) layer between a RTU-310/310G and a third party ENIU (Ethernet Network Interface Unit). Not available with RTU-310. Note: Only one RTU-310 module can be connected at once on an ENIU. Click Tools, ENIU, and ENIU Config. ENIU Type Available with RTU-310: Allows the selection of the ENIU Type. Choices are ADC, and 802.3ah. For 802.
Tools Tabs ADC Configuration ADC Configuration Note: The ADC Config tab is only available when ADC is selected as the ENIU type. In order for the configuration to work, the ADC ENIU needs to be set to EXFO mode. Not available with 10Gig-E. Click Tools, ENIU, and ADC Config. Remote ENIU List Lists the detected ENIUs on the network or part of the RTU-310/310G VLAN domain when VLAN is enabled. Up to 20 ENIUs can be listed. 422 ID: Indicates the ENIU number.
Tools Tabs ADC Configuration ENIU Status: Indicates the ENIU status. Possible statuses are: Valid: The remote ENIU satisfies the following conditions: support loopback, no events detected, ENIU stable, and OAM PDU version of both ENIU and EXFO are compatible. Rejected: The remote ENIU is rejected because it is sending critical event notification. The remote ENIU does not support loopback. The remote ENIU is not stable. Incompatible: The ENIU and OAM protocol versions are incompatible.
Tools Tabs ADC Configuration Selected ENIU Indicates the information related to the selected ENIU. MAC Address: Indicates the MAC address of the selected ENIU. Copy MAC to Stream: Allows copying the MAC and VLAN destination parameters for the test/stream. For Performance Analyzer test: The MAC destination address, VLAN ID, and VLAN Priority from the Interface Setup panel will be replaced with the selected ENIU parameters.
Tools Tabs ADC Configuration Loopback Allows sending a loopback request to the selected ENIU. Note: If the selected ENIU becomes invalid, the loopback request cannot be sent. Request: Allows the selection of the loopback request. Choices are Enabled and Disabled. Send: Sends an Enable or Disable Loopback request as selected in the Request field. Loopback Status: Indicates the loopback status of the selected ENIU.
Tools Tabs 802.3ah Configuration 802.3ah Configuration Note: The 802.3ah Config tab is only available when 802.3ah is selected as the ENIU type. Click Tools, ENIU, and 802.3ah Config. OAM Mode The OAM Mode is set to Active mode and is not configurable. In Active mode, the RTU-310/310G will initiate the discovery process and will not respond to variable request and loopback command received.
Tools Tabs 802.3ah Configuration Loopback Request allows the selection of the loopback request to be sent to the remote OAM link partner. Choices are Enabled and Disabled. The default setting is Enabled. The request will only be sent when clicking the Send button. Send allows sending the selected request to the remote OAM link partner. Remote Status: Indicates the status of the remote OAM link partner. OAM Discovery Statistics Local Status indicates the local OAM link discovery status.
Tools Tabs 802.3ah Statistics 802.3ah Statistics Note: The 802.3ah Stats tab is only available when 802.3ah is selected as the ENIU type. Click Tools, ENIU, and 802.3ah Stats. The 802.3ah Statistics window provides remote OAM link partner MAC address and OAM statistics. MAC Address indicates the remote OAM link partner MAC address. OAM Statistics provides the following remote OAM link partner statistics. OAM Version: Indicates the protocol version supported by the DTE.
Tools Tabs 802.3ah Statistics Parser Action: Bits 0 and 1 of the State byte report the Parser Action. Forward (bits 1 and 0 are set to “00”): Device is forwarding non-OAMPDUs to the higher sublayer. Loopback (bits 1 and 0 are set to “01”): Device is looping back non-OAMPDUs to the lower sublayer. Discard (bits 1 and 0 are set to “10”): Device is discarding non-OAMPDUs. Max OAMPDU Size: Bits 0 to 10 of the OAMPDU Configuration two-byte field report the maximum OAMPDU size.
Tools Tabs 802.3ah Statistics OUI: The 24-bit IEEE Organizationally Unique Identifer field identifies the vendor. Variable Request: Bit 4 of the OAM Configuration byte reports variable retrieval capability. Supported (bit 4 is set to “1”): DTE supports sending Variable Response OAMPDUs. Unsupported (bit 4 is set to “0”): DTE does not support sending Variable Response OAMPDUs. Link Events: Bit 3 of the OAM Configuration byte reports link event capability.
Tools Tabs 802.3ah Events 802.3ah Events Note: The 802.3ah Events tab is only available when 802.3ah is selected as the ENIU type. Click Tools, ENIU, and 802.3ah Events. Date Stamp: The date the last event was received. Time Stamp: The time the last event was received. Window.
Tools Tabs 802.3ah Events Threshold. Symbol Period Errored symbol threshold in second Frame Errored frame event threshold in second Frame Period Errored frame period threshold in second Frame Seconds Errored frame seconds summary threshold in second Error Count.
Tools Tabs Traffic Scan Traffic Scan The traffic scan tool provides the capability to discover and monitor VLAN or MPLS traffic flows on the network. Note: In order to access traffic scan, a test must be created but not running. If the test is started while the traffic scan is running, the traffic scan will automatically stops. Click Tools, and Traffic Scan. Scan Starts/stops the traffic scan test. Mode Allows the selection of VLAN or MPLS traffic scan mode. The default setting is VLAN.
Tools Tabs Traffic Scan Level Allows the selection of the criteria that will be used to filter the incoming VLAN or MPLS traffic flows. The default setting is All. Choices are: Mode Level VLAN C-VLAN Description Discovers/monitors only frames where the outer VLAN is a C-VLAN (TPID of 0x8100).
Tools Tabs Traffic Scan Link Rate (Mbps) Indicates the network link rate based on the received frames with a valid FCS regardless if the frame matches or not the traffic flows and filters, and regardless if the traffic flow was ignored due to the limit reached (see Limit Reached on page 435). The rate is expressed either in Line Utilization or Ethernet Bandwidth (see Rate Layer). Rate Layer Allows the selection of the rate unit used for Link Rate and Rate statistics.
Tools Tabs Traffic Scan Monitored Frames Table Statistics are gathered for each different traffic flow matching the scan criteria and filters. Each different traffic flow creates a separate entry in the scan table. When the limit is reached, new traffic flows are not considered but the existing traffic flows are still monitored. Note: Scan statistics are cleared when restarting the scan or when the test is cleared.
Tools Tabs Traffic Scan For MPLS Mode, the level of MPLS (Unlabeled, 1 Label, 2 Labels), and the values of Label ID and COS are used to identify a traffic flow. Any difference in one of these values, except for those set to Ignore (see Filters below), will create a separated entry in the table.
Tools Tabs Traffic Scan Filters The column’s All/Ignore toggle buttons are used to set the filtering criteria. Only parameters set to All will be considered to identify each traffic flow. The availability of filters depends on the VLAN or MPLS Level selected. Scan Level Filters VLAN All and E-VLAN E-VLAN priority, S-VLAN ID and Priority, C-VLAN ID and Priority. S-VLAN S-VLAN Priority, C-VLAN ID and Priority. C-VLAN C-VLAN Priority. Untagged Not applicable.
Tools Tabs Traffic Scan Frame Count indicates for each traffic flow, the number of frames matching the selected scan criteria and filters. Total indicates the number of frames matching the selected scan criteria and filters. Rate (Mbps) indicates for each traffic flow, the rate of frames received matching the selected scan criteria and filters. The rate is expressed either in Line Utilization or Ethernet Bandwidth (see Rate Layer on page 435).
22 Maintenance To help ensure long, trouble-free operation: Always inspect fiber-optic connectors before using them and clean them if necessary. Keep the unit free of dust. Clean the unit casing and front panel with a cloth slightly dampened with water. Store unit at room temperature in a clean and dry area. Keep the unit out of direct sunlight. Avoid high humidity or significant temperature fluctuations. Avoid unnecessary shocks and vibrations.
Maintenance Recalibrating the Unit Recalibrating the Unit Manufacturing and service center calibrations are based on the ISO/IEC 17025 Standard, which states that calibration documents must not contain a recommended calibration interval, unless this has been previously agreed upon with the customer. Validity of specifications depends on operating conditions.
Maintenance Replacing Fuses Replacing Fuses The RTU-310/310G contains two fuses (T4A, 5 mm x 20 mm (0.197 in x 0.787 in), slow-blow, low-breaking capacity, 250 V). The fuse holder is located at the front of the RTU-310/310G, just below the power inlet. CAUTION For continued protection against risk of fire, replace only with same type and rating of fuse. CAUTION DOUBLE POLE/NEUTRAL FUSING. To replace a fuse: 1. Unplug the power cord. 2.
Maintenance Replacing Fuses 4. Insert the new fuse into the fuse holder. Fuse Fuse holder 5. Make sure the fuses are placed firmly in the holder prior to reinsertion. 6. Firmly push the fuse holder into place.
23 Warranty General Information EXFO Inc. (EXFO) warrants this equipment against defects in material and workmanship for a period of one year from the date of original shipment. EXFO also warrants that this equipment will meet applicable specifications under normal use.
Warranty Liability Liability EXFO shall not be liable for damages resulting from the use of the product, nor shall be responsible for any failure in the performance of other items to which the product is connected or the operation of any system of which the product may be a part. EXFO shall not be liable for damages resulting from improper usage or unauthorized modification of the product, its accompanying accessories and software.
Warranty Service and Repairs Service and Repairs EXFO commits to providing product service and repair for five years following the date of purchase. To send any equipment for service or repair: 1. Call one of EXFO’s authorized service centers (see EXFO Service Centers Worldwide on page 448). Support personnel will determine if the equipment requires service, repair, or calibration. 2.
Warranty EXFO Service Centers Worldwide EXFO Service Centers Worldwide If your product requires servicing, contact your nearest authorized service center. EXFO Headquarters Service Center 400 Godin Avenue Quebec (Quebec) G1M 2K2 CANADA EXFO Europe Service Center Omega Enterprise Park, Electron Way Chandlers Ford, Hampshire S053 4SE ENGLAND EXFO Telecom Equipment (Shenzhen) Ltd. 3rd Floor, Building 10, Yu Sheng Industrial Park (Gu Shu Crossing), No.
24 Troubleshooting Solving Common Problems Before calling EXFO’s technical support, please read the following common problems that can occur and their respective solution. Problem Possible Cause Solution Optical Laser LED is off and There is a configuration Ensure that the SFP is the SFP is not generating a mismatch between the supporting the rate used signal. inserted SFP and the for the test case. rate selected for the test case. The SFP is not compatible with the RTU-310.
Troubleshooting Contacting the Technical Support Group Contacting the Technical Support Group To obtain after-sales service or technical support for this product, contact EXFO at one of the following numbers. The Technical Support Group is available to take your calls from Monday to Friday, 8:00 a.m. to 7:00 p.m. (Eastern Time in North America). For detailed information about technical support, visit the EXFO Web site at .
Troubleshooting Transportation Transportation Maintain a temperature range within specifications when transporting the unit. Transportation damage can occur from improper handling. The following steps are recommended to minimize the possibility of damage: Pack the unit in its original packing material when shipping. Avoid high humidity or large temperature fluctuations. Keep the unit out of direct sunlight. Avoid unnecessary shocks and vibrations.
A Specifications Specifications for RTU-310 Optical Interfaces 100Base-FX 100Base-LX 1000Base-SX 1000Base-LX 1000Base-ZX Wavelength (nm) 1310 TX level (dBm) 1310 1550 -20 to -15 -15 to -8 -9 to -3 -9.5 to -3 0 to +5 RX level sensitivity (dBm) -31 -28 to -8 -20 -22 -22 Maximum reach 2 km 15 km 550 m 10 km 80 km Transmission bit rate (Gbps) 0.125 0.125 1.25 1.25 1.25 Reception bit rate (Gbps) 0.125 0.125 1.25 1.25 1.
Specifications Specifications for RTU-310 100Base-FX 100Base-LX 1000Base-SX 1000Base-LX 1000Base-ZX Transceiver type SFP SFP SFP SFP SFP Electrical Interfaces 10Base-T 454 100Base-T 1000Base-T TX bit rate 10 Mbps 125 Mbps 1 Gbps TX accuracy (ppm) ±100 ±100 ±100 RX bit rate 10 Mbps 125 Mbps 1 Gbps RX measurement accuracy (ppm) ±4.6 ±4.6 ±4.6 Duplex mode Half and full duplex Half and full duplex Full duplex only Jitter compliance IEEE 802.3 ANSI X3.263-1995 IEEE 802.
Specifications Specifications for RTU-310 Ethernet Cables Minimum Category 3 cable is required for 10Base-T connection while Category 5 cable is required for 100Base-T and 1000Base-T connections. Maximum cable length (between two nodes) for 10Base-T, 100Base-T, or 1000Base-T connection is 328 feet (100 meters). Straight Through Cable (10/100 Mbps) An Unshielded Twisted Pair (UTP) straight through cable is required to connect a 10/100Base-T RTU-310/310G port to a layer 1 or 2 device (ex: HUB, switch).
Specifications Specifications for RTU-310 456 Straight Through Cable (1000 Mbps) Crossover Cable (1000 Mbps) RTU-310/310G
Specifications Specifications for RTU-310 Functional Specifications Communication Interfaces LAN Port RJ-45 Rates: 10/100 Mbps CRAFT Port RJ-45 Rates: 10/100 Mbps Test Interfaces Electrical RJ-45 rates: 10/100/1000 Mbps Optical SFP Rates: 100/1000 Mbps Other Interfaces 4 X USB ports Console port (RS-232 DB-9) and VGA port Unit LEDs Power/status (green) Critical alarm (red) Major alarm (orange) Minor alarm (yellow) Parallel Monitoring Capacity Ethernet Test Module
Specifications Specifications for RTU-310 IPTV Statistics RFC 4445 delivery index Delay factor (current, average, min, max) Media loss rate (current, average, min, max) Virtual buffer size (current, average, min, max) ETSI TR 101 290 (Priority 1) TS sync loss, Sync byte error, PAT error 2, Continuity counter error, PMT error 2, PID error, PCR jitter (current, average, min, max) Stream Information 458 Stream name Source and destination IP address Source and destination UDP port numb
Specifications Specifications for RTU-310 Stream Statistics Ethernet Bandwidth utilization IP IP rate (current, average, min, max) IP packet size IP packet count Media Media rate (current, average, min, max) Packet count Packet loss Ethernet Statistics Valid frame counts for multicast, broadcast.unicast, and n-unicast. Frame size distribution, bandwidth, utilization, and frame rate.
Specifications Specifications for RTU-310 Additional Features Stream auto discovery Stream alias map Configurable alarm thresholds 460 MDI DF MDI MLR PCR jitter PID error PAT PMT error Data storage capabilities Last 48 hours of sample measurements Metrics include: delay factor, media loss rate, PCR jitter, CC error System event and alarm logs User management: unique user name password Remote configurations: thresholds, alias map, monitored streams
Specifications Specifications for RTU-310 General Specifications Size (H x W x D) 1U rack-mount chassis (19 and 23 in. rack-mount supported) Weight (without transceivers) 6 kg (13.23 lb.) Temperature - operating - storing 0 °C to 50 °C (32 °F to 122 °F) -40 °C to 70 °C (-40 °F to 158 °F) AC Input Power 100 - 240 Vac (+6% / -10%); 50 - 60 Hz; 0.
Specifications Specifications for RTU-310G Specifications for RTU-310G Optical Interfaces 10GBASE-S 10GBASE-S 10GBASE-LW 10GBASE-LR 10GBASE-EW 10GBASE-ER W R Wavelength (nm) 850 850 1310 1310 1550 1550 TX level (dBm) -7.3 to -1 -7.3 to -1 -8.2 to 0.5 -8.2 to 0.5 -4.7 to 4 RX level sensitivity (dBm) -9.9 to -1 -9.9 to -1 -14.4 to 0.5 Transmission bit rate (Gbps) 9.95328 10.3125 9.95328 10.3125 9.95328 10.3125 Gbit/s ± Gbit/s ± Gbit/s ± Gbit/s ± Gbit/s ± Gbit/s ± 4.6 ppm* 4.6ppm* 4.6 ppm* 4.
Specifications Specifications for RTU-310G 10GBASE-S 10GBASE-S 10GBASE-LW 10GBASE-LR 10GBASE-EW 10GBASE-ER W R Eye safety CLASS 1 CLASS 1 CLASS 1 CLASS 1 CLASS 1 CLASS 1 Connector Duplex LC Duplex LC Duplex LC Duplex LC Duplex LC Duplex LC Transceiver type XFP XFP XFP XFP XFP XFP Synchronization Interfaces DS1/E1 external input clock interface Parameter DS1 E1 Rx level sensitivity (short haul only) For 772 kHz: TERM: 6 dB (cable loss only) For 1024 kHz: TERM: 6 dB (cable loss only)
Specifications Specifications for RTU-310G Electrical Interfaces Electrical Interfaces External clock DS1/E1 External clock DS1/E1 and clock output Line coding DS1: AMI and B8ZS E1: AMI and HDB3 Termination mode DS1/E1: Term Framing DS1: SF and ESF E1: PCM30, PCM30CRC, PCM31 and PCM31CRC Clock output 464 Clocking Internal, external (BITS) and recovered REF out Clock out divider: 16, 32 and 64 RTU-310/310G
Specifications Specifications for RTU-310G REF out interface Parameter Value Tx pulse amplitude 600 mVpp ± 130 mV Transmission frequency LAN WAN Clock divider (MHz) 16 644.53 622.08 Clock divider (MHz) 32 322.266 311.04 Clock divider (MHz) 64 161.133 155.
Specifications Specifications for RTU-310G Ethernet Cables Minimum Category 3 cable is required for 10Base-T connection while Category 5 cable is required for 100Base-T and 1000Base-T connections. Maximum cable length (between two nodes) for 10Base-T, 100Base-T, or 1000Base-T connection is 328 feet (100 meters). Straight Through Cable (10/100 Mbps) An Unshielded Twisted Pair (UTP) straight through cable is required to connect a 10/100Base-T RTU-310/310G port to a layer 1 or 2 device (ex: HUB, switch).
Specifications Specifications for RTU-310G Straight Through Cable (1000 Mbps) Crossover Cable (1000 Mbps) Ethernet Test Module 467
Specifications Specifications for RTU-310G Functional Specifications Communication Interfaces LAN Port RJ-45 Rates: 10/100 Mbps CRAFT Port RJ-45 Rates: 10/100 Mbps Test Interfaces Optical XFP Rates: 10 GigE Other Interfaces 4 X USB ports Console port (RS-232 DB-9) and VGA port Unit LEDs 468 Power/status (green) Critical alarm (red) Major alarm (orange) Minor alarm (yellow) RTU-310/310G
Specifications Specifications for RTU-310G Stream Statistics Ethernet Bandwidth utilization IP IP rate (current, average, min, max) IP packet size IP packet count Media Media rate (current, average, min, max) Packet count Packet loss Ethernet Statistics Valid frame counts for multicast, broadcast.unicast, and n-unicast. Frame size distribution, bandwidth, utilization, and frame rate.
Specifications Specifications for RTU-310G Additional Test and Measurement Functions Power measurement Supports optical power measurement, displayed in dBm. Frequency measurement Supports clock frequency offset generation and measurements (i.e., received frequency and deviation of the input signal clock from nominal frequency). Frequency offset generation Range (ppm) ±120 Resolution (ppm) ±1 Accuracy (uncertainty) (ppm) ±4.
Specifications Specifications for RTU-310G Module Specifications RTU-310G-LAN RTU-310G-WAN RTU-310G-LAN/WAN Port One 10 Gigabit Ethernet port One 10 Gigabit Ethernet port One 10 Gigabit Ethernet port Connector type LC LC LC Optical transceiver 850 nm optics (10GBASE-SR) 850 nm optics (10GBASE-SW) 850 nm optics (10GBASE-SR/-SW) 1310 nm optics (10GBASE-LR) 1310 nm optics (10GBASE-LW) 1310 nm optics (10GBASE-LR/-LW) 1550 nm optics (10GBASE-ER) 1550 nm optics (10GBASE-EW) 1550 nm optics (10
Specifications Specifications for RTU-310G General Specifications Communication Interface LAN port RJ-45 Rates: 10/100 Mbit/s Craft port RJ-45 Rates: 10/100 Mbit/s Test interfaces Optical XFP Rates: 10 Gbit/s Other interfaces 4 X USB ports Size (H x W x D) 1U rack-mount chassis 44 mm x 445 mm x 292 mm (1 ¾ in x 17 ½ in x 11 ½ in) Console port (RS-232 DB-9) and VGA port (19-inch and 23-inch rack-mount supported) Weight Temperature Power 5.
B Using VNC to access the RTU-310/310G VNC is a graphical desktop sharing software that allows a computer to remotely control another network device. VNC allows remote control of a computer from two different clients: the TightVNC client application or a web browser capable of running Java applets. The software load package contains the TightVNC client software, the TightVNC server is available on the RTU-310/310G. Note: The web capability of VNC is called http VNC.
Using VNC to access the RTU-310/310G Remote Connection using TightVNC Remote Connection using TightVNC Connect to the RTU-310/310G using TightVNC: 1. From the Programs menu, select TightVNC and click TightVNC Viewer. 2. Enter the IP address of the RTU-310/310G unit in the VNC server field and click Connect. The local RTU-310/310G screen is displayed. You can control the RTU-310/310G using this screen.
Using VNC to access the RTU-310/310G Transferring files using TightVNC Transferring files using TightVNC To transfer files from the local computer to the RTU-310/310G: 1. Create a folder on the local drive of the RTU-310/310G. 2. Right-click the task bar of the TightVNC Viewer screen and select Transfer files. Ethernet Test Module Local Computer displays the local drives available on your computer. TightVNC Server displays the local drive of the RTU-310/310G.
Using VNC to access the RTU-310/310G Transferring files using TightVNC 3. Navigate to the new folder on the RTU-310/310G from the TightVNC Server field. 4. Locate the files that you need to transfer from the Local Computer field and click the button. The files are transferred to the selected folder on the local drive of the RTU-310/310G.
Using VNC to access the RTU-310/310G Transferring files using TightVNC To transfer files from the RTU-310/310G to the local computer: 1. Create a folder on your computer. 2. Right-click the task bar of the TightVNC Viewer screen and select Transfer files. Ethernet Test Module Local Computer displays the local drives available on your computer. TightVNC Server displays the local drive of the RTU-310/310G.
Using VNC to access the RTU-310/310G Transferring files using TightVNC 3. Navigate to the new folder on your machine from the Local Computer field. 4. Select the files on the RTU-310/310G local drive from the TightVNC Server field that you need to transfer and click the button.
C Acronym List ? Help A Ampere AC Alternating Current AM a.m.
Acronym List DHCP Dynamic Host Configuration Protocol EMC Electromagnetic Compatibility EMS Element Management System ESD Electrostatic Discharge EULA End User License Agreement FAQ Frequently Asked Questions FCC Federal Communications Commission FCS Frame Check Sequence fps frame per second Gbps GigaBit Per Second GMT Greenwich Mean Time hr hour Hz Hertz E F G H 480 RTU-310/310G
Acronym List I IC Industry Canada ID Identification IEC International Electrotechnical Commission IEEE Institute of Electrical & Electronics Engineers in Inch IN Input IP Internet Protocol IPTV Internet Protocol Television IPv4 Internet Protocol version 4 ISO International Organization for Standardization ITE Information Technology Equipment Kbps KiloBit Per Second Kg Kilogram LAN Local Area Network LED Light-Emitting Diode lb.
Acronym List M m Meter MAC Media Access Control Mbps Megabit Per Second MDI Media Delivery Index min.
Acronym List PCR Program Clock Reference PID Packet Identifier PM p.m.
Acronym List T TX Transmit UDP User Data Protocol UI User Interface URL Uniform Resource Locator USA United States of America USB Universal Serial Bus UTC Universal Time Coordinated UTP Unshielded Twisted Pair V Volts Vac Volts Alternating Current VBF Virtual Buffer Size Vdc Volts Direct Current VID VLAN Identifier VLAN Virtual Local Area Network VoD Video on Demand U V 484 RTU-310/310G
D Pop-Up Windows Note: The following Pop-Up windows are available throughout the user interface.
Pop-Up Windows VLAN Configuration VLAN Configuration 486 Enable VLAN appears only for EtherSAM service configuration, for all other cases, VLAN is already enabled once the VLAN Configuration pop-up window is available. Enable VLAN, when selected, allows the configuration of VLAN. The VLAN check box is not selected by default. Stacked VLAN: Enables up to 3 stacked VLAN. Binary: When enabled, displays the VLAN ID in binary. This setting is disabled by default.
Pop-Up Windows PBB-TE Interface configuration PBB-TE Interface configuration The PBB-TE Interface window allows to configure the source and destination parameters for PBB-TE network testing capability. This pop-up window is displayed when clicking on the PBB-TE Config button. B-MAC Source Address: Enter the source Backbone MAC address. The default address is the same as the source MAC address. B-MAC Destination Address: Enter the destination Backbone MAC address.
Pop-Up Windows PBB-TE Interface configuration B-VLAN (Backbone Virtual Local Area Network) ID: Enter the B-VLAN identifier. Choices are 0 through 4095 (refer to VLAN/B-VLAN on page 464 for more information). Priority: Select the B-VLAN user Priority Code Point (PCP). Choices are 0 to 7; (refer to VLAN/B-VLAN on page 464 for more information). The default setting is 0 (000 - Low).
Pop-Up Windows IPv4 Configuration IPv4 Configuration Source Note: For EtherSAM Dual Test Set, the source IP address is only configurable through the Network on page 150. Automatic IP Address: Allows to dynamically obtain an IP address from a DHCP (Dynamic Host Configuration Protocol) server. IP Address: Enter the IP address for the selected service. The default setting is 10.10.x.x, where x and y are respectively the two least significant bytes of the port default MAC address.
Pop-Up Windows IPv4 Configuration Resolve MAC Address: When enabled, will send a request to the network to retrieve the MAC address corresponding to the selected destination IP address. This setting is disabled by default. MAC Address Status: Indicates the Resolve MAC address status. Possible status are: Status 490 Description -- The Resolve MAC address is not enabled. Resolving The MAC address is being resolved. Resolved The MAC address is resolved. Failed The MAC address cannot be resolved.
Pop-Up Windows IPv6 Address Configuration IPv6 Address Configuration Note: The default IPv6 address parameters are set from the IPv6 Test Preferences on page 339. Link-Local IPv6 Address The Link-Local IPv6 Address (LLA) is used for local communication between on-link neighbors. Mode Stateless Auto allows automatic generation of the IPv6 address based on the MAC address. The mode Stateless Auto is selected by default. Static allows to enter the IP address.
Pop-Up Windows IPv6 Address Configuration Global IPv6 Address The Global IPv6 Address (GUA) is used for global communication with hosts outside the subnet and to communicate with on-link neighbors. Mode None disables the Global IPv6 address and the Default Gateway address. Stateless Auto allows automatic generation of the IPv6 address based on the MAC address and the prefix obtained from router advertisements. If no prefix has been obtained, the Global address will not be generated.
Pop-Up Windows IPv6 Address Configuration Link-Local/Global IPv6 Address Status Mode Status Stateless -Auto Generating Static Description Undefined Stateless address auto configuration in progress. Successful IP address has been generated and no duplication has been detected. Duplication Detected IP address has been generated but duplication has been detected. Failed IP address has not been generated. -- Undefined DAD Checking Duplication address detection in progress.
Pop-Up Windows IPv6 Address Configuration Default Gateway Address The Default Gateway Address is used to forward packets outside the subnet. Default Gateway Address is not available when the Global IPv6 address Mode is set to None. Mode Automatic allows automatic selection of the default gateway. Static allows entering the default gateway IP address. The default address is FE80::.
Pop-Up Windows IPv6 Address Configuration Destination IPv6 Address Note: Destination IPv6 address is only available for EtherSAM services configuration. IP Address: Enter the destination IP address for the selected service. Ping button: Click Ping to automatically start the quick Ping utility for the service destination IP address using the Ping parameters from the Setup on page 412. Refer to Ping on page 508 for more information.
Pop-Up Windows Copy Service Network Configuration Copy Service Network Configuration This pop-up window is only available with EtherSAM (Y.1564) test case. To copy the service configuration to one or several services. 1. In the Copy from Service No list, select the service number the configuration will be copied from. 2. Check all service check boxes that will inherit the configuration from the selected service. 3. Click on OK to confirm the service configuration copy for all selected services.
Pop-Up Windows Service Profile Configuration Service Profile Configuration This pop-up window is only available with EtherSAM (Y.1564) test case. Service profile allows the selection and configuration of the Voice, Video, or Data service profile. The default setting is Data. There is no parameter to set for Data. For Voice: Voice Codec choices are VoIP G.711, VoIP G.723.1, and VoIP G.729. The default setting is VoIP G.711.
Pop-Up Windows Framing Configuration Framing Configuration This pop-up window is only available with EtherSAM (Y.1564) test case. Data Link: Select the data link type (layer 2). Choices are Ethernet II, and 802.3 SNAP. PBB-TE/Ethernet II and PBB-TE/802.3 SNAP are also available when PBB-TE is enabled. Network: Select the network traffic type (layer 3). The default setting is either IPv4 or IPv6 when MPLS is not enabled and either MPLS/IPv4 or MPLS/IPv6 when MPLS is enabled.
Pop-Up Windows Frame Size Configuration Frame Size Configuration This pop-up window is only available with EtherSAM (Y.1564) test case. Type: For Data profile, select Fixed (default), Random, or EMIX frame size. The Type is set to Fixed for Video and Voice profiles. Size and EMIX Frame Sizes: For Fixed type with Data service profile, select the frame size. The size is not configurable and set to 1374 for Video and 138 for Voice.
Pop-Up Windows Frame Size Configuration The following table lists each component that may affect the minimum size value. Component Description VLAN 4 bytes per VLAN (up to 3 VLAN) PBB-TE 18 bytes B-VLAN 4 bytes MPLS 4 bytes per label (up to two labels) UDP 8 bytes TCP 20 bytes Ethernet Header 14 bytes LLC and SNAP Headers 8 bytes IPv4 20 bytes IPv6 40 bytes For Random type, the frame size range is from 64 to 1518 bytes.
Pop-Up Windows Frame Format Configuration Frame Format Configuration This pop-up window is only available with EtherSAM (Y.1564) test case. Frame Format OUI is available when the Data Link is set to 802.3 SNAP and allows the selection of the Organizationally Unique Identifier (OUI). Choices are RFC1042, 802.1H, and User Defined (when Network is set to None). When User Defined is selected, enter the OUI hexadecimal value (000000 to FFFFFF).
Pop-Up Windows MAC Configuration MAC Configuration This pop-up window is only available with EtherSAM (Y.1564) test case. Source MAC Address: Indicates the MAC address of the selected service. Note: The source MAC Address is only configurable through the Network on page 150. Destination MAC Address: Enter the destination MAC address for the selected service. The default setting is FE:FE:FE:FE:FE:FE. Note: The destination MAC Address field is not accessible when Resolve MAC Address is enabled.
Pop-Up Windows MPLS Configuration MPLS Configuration This pop-up window is only available with EtherSAM (Y.1564) test case. Allows MPLS configuration of services with up to two layers of MPLS labels, COS/EXP and TTL parameters. Note: MPLS has to be enabled during the test setup (refer to MPLS on page 106) and the Network framing configuration set to MPLS/IPv4, MPLS/IPv6, or MPLS/None to gives access to the MPLS configuration for the selected service.
Pop-Up Windows MPLS Configuration COS/EXP (Class Of Service / Experimental): Select the class of service. The default value is 0 (0000 - Low). 0 (000 - Low) 1 (001 - Low) 2 (010 - Low) 3 (011 - Low) 4 (100 - High) 5 (101 - High) 6 (110 - High) 7 (111 - High) TTL (Time To Live): Select the TTL value. Choices are 0 to 255. The default setting is 128.
Pop-Up Windows UDP Configuration UDP Configuration This pop-up window is only available with EtherSAM (Y.1564) test case. Allows the selection of the source and destination UDP port number. Choices are 0 to 65535. The default setting is 49184 for the source port and 7 (echo) for the destination port. TCP Configuration This pop-up window is only available with EtherSAM (Y.1564) test case. Allows the selection of the source and destination UDP port number. Choices are 0 to 65535.
Pop-Up Windows Advanced TOS/DS Advanced TOS/DS Enable Differentiated Services Allows enabling the Differentiated Services (DS). This setting is disabled by default. DS Note: DS is available when Enable Differentiated Services is enabled. 506 DSCP Codepoints: Select the DSCP Codepoints.
Pop-Up Windows Advanced TOS/DS TOS Note: TOS is available when Enable Differentiated Services is not enabled. Precedence: Select the Precedence value. Choices are: 000 (Routine) 001 (Priority) 010 (Immediate) 011 (Flash) 100 (Flash Override) 101 (CRITIC/ECP) 110 (Internet Control) 111 (Network Control) The default setting is 000 (Routine). Throughput: Allows the selection of the throughput level. Choices are Normal and High. The default setting is Normal.
Pop-Up Windows Ping Ping The Ping is used to determine if a network device is reachable. Note: The Ping button is not available when an RFC 2544 test is running, or when a Ping or Trace Route command is running (refer to Ping Configuration on page 412). Click TEST, Stream Gen, IP, and Ping. IPv4 IPv6 Results: Refer to Ping Results on page 414 for more information. Statistics: Refer to Statistics on page 420 for more information. OK: Click OK to exit the Ping/Trace Route window.
Pop-Up Windows Ping Delay (ms): Available for ping only. Enter the delay between each attempt (PING). Choices are 100 to 10000 ms. The default setting is 1000 ms. Data Size (Bytes): Available for ping only. Enter the buffer size that will be sent to the network device to be detected. Choices are 0 to 1472 bytes. Default value is 32 bytes. Time To Live (TTL) for IPv4 Hop Limit (TTL) for IPv6 Enter the maximum number of hops the packet can go through. Choices are 1 to 255.
Pop-Up Windows Filter Selection Filter Selection This pop-up window is only available from Traffic Analyzer - Capture tab. Allows to select the filter number that will be used to select what frames are saved in the buffer. Only enabled filters are selectable. To configure and enable filters, see Traffic Filters on page 215 or Traffic Filter Configuration on page 220. None indicates that there is no filter selected meaning that all received frames will be captured.
Pop-Up Windows Truncation Calculator Truncation Calculator This pop-up window is only available from Traffic Analyzer - Capture tab. Allows to easily determine at what byte to truncate the frame that will be captured by selecting the desired frame header components. Header Layer: Select the header layer level. Choices are Layer 2 (Ethernet), Layer 3 (IP), and Layer 4 (TCP/UDP). IP Version: Select the IP version. Choices are IPv4 and IPv6.
Pop-Up Windows Field Match Configuration Field Match Configuration This pop-up window is only available from Traffic Analyzer - Capture tab. Allows to define the trigger criteria that will be used to automatically start the capture when a received frame matches the trigger’s criteria. Filter Configuration “(“ and “)“: The open and close parenthesis may be useful to control the precedence of operands when more than two operands are used. Only one level of parenthesis is supported.
Pop-Up Windows Field Match Configuration Mask: Allows masking the defined filter value. A bit mask of 1 indicates that the corresponding bit in the value is compared for the match. A bit mask of 0 indicates that the corresponding bit in the value is ignored. For binary values, enter the mask value in binary format. For decimal values, enter the mask value in hexadecimal format. For IP address field, enter the mask in decimal format.
Pop-Up Windows Triggered Frame Details Triggered Frame Details This pop-up window is only available from Traffic Analyzer - Capture tab. This pop-up indicates the details on the captured trigger frame. The triggered frame corresponds to the first received frame that matches the filter and the trigger settings (see Trigger on page 226). 514 Frame Number indicates the triggered frame position in the buffer. The framing MAC/IP/UDP/TCP source and destination addresses are displayed in a table.
Pop-Up Windows Data Capture Export Data Capture Export This pop-up window is only available from Traffic Analyzer - Capture tab. Allows to export the data capture into a .pcap file format and to view the file using Wireshark. Save In: Allows to select the folder to save the capture file. The capture file is saved in the following folder by default: C:\ProgramFiles\EXFO\Applications\RTU\\UserFiles\Capture Data..
Pop-Up Windows Data Capture Export Once generated, the capture file will be automatically opened in Wireshark when the View File After Generation check box is selected. The capture file report may also be manually opened within Wireshark typically using Windows Explorer.
Index Index -- status Expert Mode ........................................ 122 RFC 2544 ............................................. 124 -- ............................................................... 374 # Ping results table ................................... 414 802.3 SNAP .. 78, 93, 100, 107, 112, 114, 177, 328 802.3ah..................................................... 421 802.3ah Configuration .............................. 426 802.3ah Events.......................................... 431 802.
Index B3.............................................. 241, 243, 248 Back ............................................................ 69 Back-to-Back ................................. 85, 90, 368 Back-to-Back results .................................. 306 Bandwidth ........ 173, 207, 209, 211, 219, 223 Bandwidth Utilization (%) ......................... 286 BBE............................................................ 361 BBER.......................................................... 362 BERT ..........
Index CIR............................................. 329, 334, 497 CIR %......................................................... 344 CIR disabled for all services ....................... 339 CIR or CIR+EIR Frames .............................. 336 CIR+EIR............................................. 330, 334 class 1 ........................................................x, 9 class 1M .....................................................x, 9 cleaning front panel..........................................
Index Dest Port ................................................... 258 Destination........................ 178, 286, 489, 502 destination ................................................ 183 Destination B-MAC Address ...................... 176 Destination IP Address ...................... 262, 264 Destination IPv6 Address........................... 495 Destination MAC Address.......... 213, 426, 502 DF_CTL ...................................................... 194 Dir. ....................................
Index Errors ........................................................ 223 ES .............................................................. 360 ESD.............................................................. 10 ESR ............................................................ 362 Estimated BB_Credit .................................. 236 Ethernet ............................................ 129, 286 Ethernet (BERT) ......................................... 377 Ethernet cable crossover ....................
Index Filter Configuration ................... 216, 220, 512 Filter .................................... 216, 221, 512 Mask.................................... 218, 221, 513 Oper. ........................................... 221, 513 Value ................................... 218, 221, 512 Filter No .................................... 215, 220, 222 Finish........................................................... 69 Fixed.......................................................... 499 Flow Control ...........
Index I IC...................................................................ix ID ...................................... 176, 422, 486, 488 id............................................................... 132 Identification............................................. 285 identification label .................................... 450 Idle ............................................ 204, 258, 268 IGMP ................................................. 265, 278 IGMP Auto-Join ...............................
Index Latency...................................................... 312 Latency (RFC 2544).................................... 372 Latency Results.......................................... 316 Latency Tag ............................................... 235 Layer ......................... 303, 307, 318, 367, 369 Layer 1 ...................................................... 369 Layer 1,2,3 ........................ 303, 307, 318, 367 Layer 2,3 ........................... 303, 307, 318, 367 Layer 3 ..........
Index Max RX Rate...................................... 341, 343 Max RX Rate L -> R ................................... 343 Max RX Rate R -> L ................................... 343 max. hop count ................................. 417, 509 max. negative offset.......................... 137, 141 Max. Pause Time ....................................... 214 max. positive offset ........................... 137, 141 max. time worth of frame ......................... 305 maximum rate.............................
Index OK ............................................................... 60 OOS........................................................... 347 Oper. ................................................. 221, 513 optical interface ................................ 453, 462 Optical RX ................................................. 140 Optical TX ................................................. 138 option ........................................................... 5 Other.......................................
Index Port (BERT) ................................................ 375 Port Link .................................................... 122 port selection ............................................ 386 Port Status ................................................ 148 Failed ................................................... 148 In Progress........................................... 148 Logged-in ............................................ 148 Logged-out..........................................
Index Maximum ............................................ 236 Minimum............................................. 236 Samples ............................................... 236 Unit ..................................................... 236 Round Trip Latency.................................... 348 Round Trip Time (ms) ................................ 354 run .................................................... 412, 417 runt ........................................................... 204 RX .............
Index Stacked VLAN............................................ 486 standard.................................................... 360 Start ............................................................ 45 Start application.......................................... 37 Start Time.................................. 122, 126, 286 Starting Window Size................................ 352 State --.......................................................... 298 Aborted ...............................................
Index Expert Mode - Latency (RFC 2544) ....... 372 Expert Mode - Throughput (RFC 2544) 366 Expert Mode (BERT) ............................. 374 Expert Mode Ethernet (BERT)............... 377 Expert Mode Pattern (BERT)................. 379 Expert Mode Port (BERT)...................... 375 Expert Mode RFC 2544 ........................ 364 FC Latency ........................................... 235 FC RX ................................................... 233 FC Statistics .....................................
Index Test ..................................................... 71, 129 test case report ........................................... 53 test configuration...................................... 124 Test controls................................................ 45 Test global status ........................................ 44 test granularity.......................................... 309 Test Name ................................................. 124 Test Pattern .............................................
Index TX Frames ................................................. 237 TX Rate...................................................... 173 TX-to-RX... 301, 302, 303, 306, 309, 310, 311, 313, 315, 316, 366, 368, 370, 372 Type ... 59, 138, 191, 200, 201, 230, 231, 232, 291, 292, 486, 499 Type of Service .................................. 413, 509 U UAS ........................................................... 362 UDP ........................................................... 329 UDP Checksum ...............
NOTICE 抩⛙ CHINESE REGULATION ON RESTRICTION OF HAZARDOUS SUBSTANCES ₼⦌␂ℝ☀⹂䓸德棟Ⓟ䤓屓⸩ NAMES AND CONTENTS OF THE TOXIC OR HAZARDOUS SUBSTANCES OR ELEMENTS CONTAINED IN THIS EXFO PRODUCT ▔⚺⦷㦻 EXFO ℶ❐₼䤓㦘㹡㦘⹂䓸德㒥⏒侯䤓⚜䱿✛⚺摞 O X Indicates that this toxic or hazardous substance contained in all of the homogeneous materials for this part is below the limit requirement in SJ/T11363-2006 嫷䯉年㦘㹡㦘⹂䓸德⦷年捷ↅ㓏㦘⧖德㧟㠨₼䤓⚺摞⧖⦷ SJ/T11363-2006 㪖屓⸩䤓 棟摞尐㻑ⅴₚᇭ Indicates that this toxic or hazardous substance contained in at least one of the
MARKING REQUIREMENTS 㪖㽷尐㻑 Product Environmental protection use period (years) Logo ℶ❐ 䘾⬒≬㔳∎䞷㦮棟 ( ) 㪖㉦ This Exfo product 㦻 EXFO ℶ❐ Batterya 䟄㻯 a a. If applicable.
P/N:1062500 www.EXFO.com · info@exfo.com CORPORATE HEADQUARTERS 400 Godin Avenue Quebec (Quebec) G1M 2K2 CANADA Tel.: 1 418 683-0211 · Fax: 1 418 683-2170 EXFO AMERICA 3701 Plano Parkway, Suite 160 Plano TX, 75075 USA Tel.: 1 972 907-1505 · Fax: 1 972 836-0164 EXFO EUROPE Omega Enterprise Park, Electron Way Chandlers Ford, Hampshire S053 4SE ENGLAND Tel.: +44 2380 246810 · Fax: +44 2380 246801 EXFO ASIA-PACIFIC 151 Chin Swee Road #03-29, Manhattan House SINGAPORE 169876 Tel.