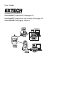
User Guide Model 42265 Temperature Datalogger Kit Model 42275 Temperature and Humidity Datalogger Kit Model SW276 Datalogging Software SW276
Introduction Congratulations on your purchase of Extech Instrument’s Datalogging instrumentation and software. This User Guide serves three purposes, refer to the list below: 1.
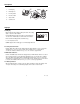
Description 1. LCD display 2. Mounting hole 3. Docking station 4. Interface Cable 5. Status LEDs 6. Software CD Displays LCD Display REC: Displayed while logging readings. Read the ‘Recording Status’ section for further details. HI and LOW: Displayed when the High or Low Alarm limit is exceeded. See ‘Alarm Status’ below for further information. REC HI LOW COMM RH% °C °F RH%: Relative Humidity (42270 and 42275 only) C or F: Temperature units.
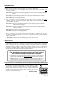
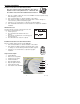
Software Installation Installation instructions for models 42266 and 42276 Note: The software program and USB driver must both be installed in order for the printer/meter to communicate with the software. Please follow the installation instructions below. 1. 2. 3. 4. 5. Place the supplied software CD in the PC CD-ROM. The Data Acquisition Setup Menu will appear (see below). Click on “Install Software” to start the installation of the software.
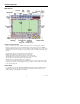
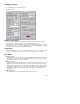
Software Operation Main Screen Diagram A: Main Screen Cursor 1 and 2 Control Click on a cursor line to select it. When the red cursor line is clicked, it turns bold red. When you click the green cursor, it turns bold green (colors may vary). The CURSOR STATUS field (lower left) shows the cursor positions. As the Arrow keys are used to select the last record or the next record, the cursor location numbers change to reflect their new position. Left arrow key: Moves to previous point on the current plot.
Zoom and Pan on Graphs To zoom in, press the key and click the left mouse button over the desired point; release the key after the mouse button is pressed. The view resolution increases until the mouse button is released. To zoom out, click the right mouse button. To pan, press the keys and click the left mouse button over the desired point, and then drag the mouse to another point. The graph view scrolls so that the original point now appears under the new mouse cursor location.
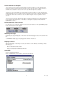
Retrieve File Click on RETRIEVE FILE to retrieve a previously saved file. To aid in reading a graph, a grid can be drawn on the graph. A dialogue box at the bottom left hand corner shows the grid (CONTROL LOCATION Cursor 1 and 2) After retrieving a file containing Humidity records, the labels "Temperature" and "Humidity" will appear at the beginning of the curves. If no Humidity data is transferred, only the Temperature curve will appear.
Com Port Setup Select "Com. Set". Select the COM port, Baud rate (9600), Data bits (8), Parity (None) and Stop bits (1). Select OK to accept settings, press Cancel to abort and exit. 8 V7.
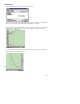
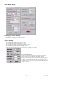
Datalogger Settings Press LOGGER to access the menu page Sample Rate Setup Number of Data Points Select the desired number of data samples to log: 1000 / 2000 / 4000/ 8000 / 12000 / 16000. Scroll up or down to located the value and then click OK to save. For example, to select 1,000 samples, the logger will stop logging (and will power off) when 1000 data points have been collected. Datalogging ceases when the datalogger is full. The yellow LED will stop flashing when datalogging ceases.
Start Mode Setup Datalogger Clock Setting Click OK to set logger to PC system time. Alarm Setting The default High Alarm temperature is 85 C The default Low Alarm temperature is -40 C The default High Alarm for Relative Humidity is 100% The default Low Alarm Relative Humidity is 0% Select the desired High value or Low value by scrolling up or down. The ALM LED flashes: a. If the measured Temperature is higher than the HI Alarm setting or lower than the LO Alarm setting. b.
Unit Setting Temperature can be displayed in "C" or "F" Data Logger ID Setting The datalogger's ID setting allows the user to provide a unique name for each datalogger (up to 8-digits). Sleep Mode Setting In Sleep Mode the Datalogger turns the display off after Datalogging has been completed. Select the Sleep Mode in software by moving the slide switch to the right for SLEEP then click OK. If NON-SLEEP is selected, the logger will continually display the current Temperature / Relative Humidity.
Data Table Press the DATA TABLE icon to view data GO Channel Condition Error Usage Counter Process the data using the conditions selected. Selects Temperature or Humidity for analysis. Selects if range values are “AND” (both occur) or “OR” (either occurs). Selects and counts all the error codes in the file. Indicates the number of records that exceeded the limit condition selected. Indicates the number of times a record or group of records exceeds the limit condition selected.
Statistics Press the STATISTICS icon to view histograms of data based on the "Whole Range" or the "Cursor Range". See (Diagram I) Whole Range - All of the logged readings. Cursor Range - Only the readings between the two cursors. 1. Click and drag the knobs’ yellow line (shown in the left side of Diagram I-1) to equally divide all sample readings into 4 divisions (up to 130). This can also be done by clicking on the UP/DOWN arrows or by keying in the value directly. 2.
4. Diagram I-2 is another example of setting the cursor range; it has been set to 100 divisions. 5. Diagram J-1 shows that cursor 1 is used for the temperature readings and the lower region shows the Relative Humidity records. In Diagram J-2 the divisions are set to 130. 6. Diagram I is a Temperature example using Diagrams I-1 and I-2 as data sources. Diagram J is a Temperature and Humidity example using Diagrams J-1 and J-2 as data sources. 7.
Group Files Click GROUP FILES to view the "Multi-Logger Monitor" designed to view and compare data files. Diagram M shows the screen as it appears before the icon is clicked. Select the color of the curve by clicking the color block. Print the data by clicking the printer icon at the right-most top corner. Note: To retrieve a file to replace the current file shown on the graph: a. Select the file to replace b. Choose transparent from the color selections (graph disappears) c.
Click to select the file that will be used for comparison, click the color icon box to select the desired color. Each file is represented by a capital letter (A through H) with the file name following the letter. Diagram N When comparing data files: Diagram M shows the main screen before a file is retrieved. Diagram N shows the main screen with an example file loaded. The offset and range settings can be changed by moving the indicator on the yellow rotating knob (refer to Diagram O).
Previous Setting Previous setting records are listed in this column for reference. To download data from another datalogger without exiting the current screen: a) Click “PREVIOUS SETTING" to replace the last logger data with a new one. b) Close and reopen the program. Note: Clicking on "Retrieve File" will not download from a new datalogger; Follow the above instructions. 17 V7.
Message The message area is blank if no file has been retrieved. After a file is retrieved the message will display as follows: "Retrieve file completed" Download Commands Start - To begin downloading data (See below diagram) Stop - To manually stop downloading data. Exit - To exit the Download utility. Display Control Offset - Allows the user to select a point in the reading log to begin viewing the data. See the examples below.
Example 2: Set the Offset to "4000" (refer to Diagram S and S1). The screen shows 4000 as the starting point for the 8,000 record total. Display Control (for X-Axis records) Range - Allows the user to configure the data range. 19 V7.
Example 1: Set the Range by clicking & dragging the red indicator (Diagram T) to "1K" (Diagram T-1 shows data records from 0001 to 1000). Example 2: Set the Range to "4K" as in Diagram U. Diagram U-1 shows the data records from 0001 to 4001. 20 V7.
Battery Replacement Follow these steps to remove and replace the battery: 1. Remove the four (4) rear Phillips-head screws 2. Ensure that the o-ring remains in its groove. 3. Remove the expired battery. 4. Insert a new battery (CR2) ensuring correct polarity. 5. Fasten the four rear screws. Specifications Display 3-digit multi-function LCD Front panel status LEDs Two (2): RECORD and ALARM Temperature range -40 to 185 F (-40 to 85 C) Temperature resolution Temperature accuracy o o o o o o 0.
Warranty EXTECH INSTRUMENTS CORPORATION warrants this instrument to be free of defects in parts and workmanship for one year from date of shipment (a six month limited warranty applies to sensors and cables). If it should become necessary to return the instrument for service during or beyond the warranty period, contact the Customer Service Department at (781) 890-7440 ext. 210 for authorization or visit our website www.extech.com for contact information.