
Weather Radio User Manual

V7.1 1/08
13
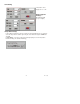
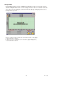
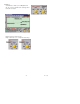
Statistics
Press the STATISTICS icon to view histograms of data based on the "Whole Range" or the
"Cursor Range". See (Diagram I)
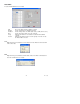
Whole Range - All of the logged readings.
Cursor Range - Only the readings between the two cursors.
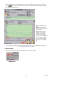
1. Click and drag the knobs’ yellow line (shown in the left side of Diagram I-1) to equally
divide all sample readings into 4 divisions (up to 130). This can also be done by clicking on
the UP/DOWN arrows or by keying in the value directly.
2. Refer to the top of Diagram I-1, notice that there are 1021
logged readings at 44°C.
There are also 213 readings between the two cursors at 62.7°C
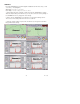
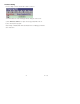
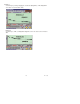
3. If all of the logged readings are placed into 100 divisions, the histogram for the Whole
Range will reflect the change.