Software Help Utility VB300 3-Axis G-Force Datalogger Version 1.0 November 2010 Software Introduction The datalogger software is a program that collects data from the VB300 Datalogger when it is connected to a desktop or notebook PC. The data can be displayed graphically in Microsoft Excel TM format or in similar programs. The major functions are listed in the main window.
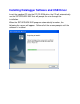
Installing Datalogger Software and USB Driver Insert the supplied CD into the PC CD-ROM drive, the CD will automatically run the SETUPGUIDE.EXE that will prompt the user through the installation. When the SETUPGUIDE.EXE program automatically launches, the following the screen will appear. Follow all of the screen prompts until the software is installed.
The USB Driver installation window will then appear: Click “Install” to finish the driver installation When the Software and Drivers are successfully installed plug the VB300 into the PC USB port and double click the datalogger program icon to run the datalogger software.
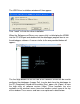
Main Menu File Save Open Print Setup Print Preview Print Exit Save the recorded data to the PC hard drive Open a saved file Edit the printing options Preview the Graph or List Print the Graph or List Close the software program Instrument Datalogger Setup Configure the Datalogger Sampling Rate, Motion Detection Threshold, LED, and Record Mode Download Data Transfer the data from the Datalogger to the PC Run Begin reading the real-time data from the Datalogger Stop Reading Stop reading the data
Window Instrument Data Summary Display or hide the instrument window Display or hide the Data Summary window Help About Help Topics Displays the software’s version information Opens the software HELP Utility
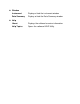
Operation Datalogger Setup Click the setup icon on the menu bar. The Setup window will appear as shown below; descriptions for each field in the Setup window are listed directly below: Sampling Setup: Set the Datalogger to record readings at a specific rate. Rate and units are selectable. LED Flash Cycle Setup: Set to No Light, 10, 20, or 30 seconds. By selecting the “No Light” option, the LEDs will not flash, thereby conserving the battery life.
Manual or Automatic Start: Select Automatic to start datalogging immediately when the Setup window is exited or Manual by using the datalogger button at a later time. Click the SETUP button to save changes. Click the DEFAULT button to set the Datalogger to its factory default condition. Click the CANCEL button to abort the setup. Notes: All stored data will be permanently erased when Setup is clicked. To save data, click Cancel and download the data first and then re-enter the Setup mode.
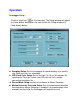
Once the data is successfully downloaded, the window shown below will appear. Run Click the run icon to read realtime data from the Datalogger. Click to pause the recording. First, configure the sampling rate and sample data point allotment, and then click RUN to begin reading data.
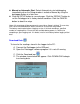
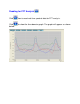
Reading for FFT Analysis Click icon to read real-time spectral data for FFT analysis. Click below: to show the time-domain graph.
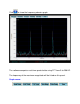
Click to show the frequency-domain graph. The software computes real-time spectral data using FFT from 0 to 256 HZ. The frequency of the maximum magnitude will be listed on this panel.
Zoom in: 1. Click the left mouse button and drag a rectangle around the area to be expanded. 2. Release the mouse button. 3. In zoom mode, use the vertical and horizontal scroll bars to navigate the graph. : Click to return to full view. : Set the scale to reflect on-screen values. : Set the scale to the Max and Min value. Set Maximum and Minimum vertical & horizontal axis values.
: Set the color for Background, Grid Axis, X/Y/Z values, and Vector Sum. : Click to select the parameters and Axis to be displayed The field at the bottom of the graph window will display the Data Point Number, Time, and X/Y/Z/Vector Sum value at the cursor location.
Data summary:
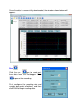
Data List Click the list icon to import data to the list format.
Note that frequency/magnitude are shown in the frequency-domain mode
File save and open 1. Click the icon to open the file save dialog box. 2. Name the file and save it using the default extension. The file will be saved with the “. vibration” extension to be reopened in the Vibration Datalogger software program and also as a “.xls” file to be opened in spreadsheet program or other program. 3. Click the icon to open an existing data file for viewing on the data graph window. When prompted, select a previously saved vibration file to open.