® ExtremeAnalytics User Guide Version 8.4 12/2019 9036581-00 Rev.
Copyright © 2020 Extreme Networks, Inc. All Rights Reserved. Legal Notices Extreme Networks, Inc., on behalf of or through its wholly-owned subsidiary, Enterasys Networks, Inc., reserves the right to make changes in specifications and other information contained in this document and its website without prior notice. The reader should in all cases consult representatives of Extreme Networks to determine whether any such changes have been made.
l l l GTAC Knowledge — Get on-demand and tested resolutions from the GTAC Knowledgebase, or create a help case if you need more guidance. The Hub — A forum for Extreme customers to connect with one another, get questions answered, share ideas and feedback, and get problems solved. This community is monitored by Extreme Networks employees, but is not intended to replace specific guidance from GTAC.
Extreme Networks® Software License Agreement This Extreme Networks Software License Agreement is an agreement ("Agreement") between You, the end user, and Extreme Networks, Inc. ("Extreme"), on behalf of itself and its Affiliates (as hereinafter defined and including its wholly owned subsidiary, Enterasys Networks, Inc. as well as its other subsidiaries). This Agreement sets forth Your rights and obligations with respect to the Licensed Software and Licensed Materials.
2. TERM. This Agreement is effective from the date on which You install the License Key, use the Licensed Software, or a Concurrent User accesses the Server Application. You may terminate the Agreement at any time by destroying the Licensed Materials, together with all copies, modifications and merged portions in any form. The Agreement and Your license to use the Licensed Materials will also terminate if You fail to comply with any term of condition herein. 3. GRANT OF SOFTWARE LICENSE.
above those specifically granted to You. From time to time, the Licensed Software will upload information about the Licensed Software and the associated devices to Extreme. This is to verify the Licensed Software is being used with a valid license. By using the Licensed Software, you consent to the transmission of this information.
Extreme (its "Affiliates"), and/or their suppliers. This Agreement conveys a limited right to operate the Licensed Materials and shall not be construed to convey title to the Licensed Materials to You. There are no implied rights. You shall not sell, lease, transfer, sublicense, dispose of, or otherwise make available the Licensed Materials or any portion thereof, to any other party. b.
valuable confidential information and trade secrets, and that unauthorized use, copying and/or disclosure thereof are harmful to Extreme or its Affiliates and/or its/their software suppliers. 9. MAINTENANCE AND UPDATES. Updates and certain maintenance and support services, if any, shall be provided to You pursuant to the terms of an Extreme Service and Maintenance Agreement, if Extreme and You enter into such an agreement.
For Department of Defense units, the Licensed Materials are considered commercial computer software in accordance with DFARS section 227.7202-3 and its successors, and use, duplication, or disclosure by the U.S. Government is subject to restrictions set forth herein. 13. LIMITED WARRANTY AND LIMITATION OF LIABILITY.
law. You waive any objections to the personal jurisdiction and venue of such courts. None of the 1980 United Nations Convention on the Limitation Period in the International Sale of Goods, and the Uniform Computer Information Transactions Act shall apply to this Agreement. 15. GENERAL. a.
Table of Contents ExtremeAnalytics® User GuideVersion 8.
ExtremeAnalytics Application Data Collection 39 Data Collection Overview 39 Collection Targets 40 Collection Statistics 41 Collection Intervals 42 Using Sites to Collect In-Network Traffic 44 Data Collector Types 45 General Usage Collectors 45 Hourly General Usage Collectors 46 High-Rate General Usage Collectors 49 End-System Details Collector 49 Flow Information Sources 50 Enabling ExtremeControl Integration Reports 51 52 Dashboard Report 52 Browser Reports 53 ExtremeAnalytics
Insights Dashboard Reports 58 Client/Server Dashboard Reports 59 Applications Browser Dashboard Report 59 Industry Dashboards 59 Enterprise Dashboard 59 Education Dashboard 59 Healthcare Dashboard 60 Venue Dashboard 60 IP Reputation Dashboard 60 Response Time Dashboard 61 Network Service Dashboard 61 Tracked Applications Dashboard 62 ExtremeAnalytics Insights Dashboard Insights 63 63 Ring Chart 63 Custom Dashboard 65 How to Create an ExtremeAnalytics Insights Custom Dashboard
Application 70 Top 71 Tracked Applications 71 Filters 72 Network Response Time Graph 72 Application Response Time Graph 73 ExtremeAnalytics Network Service Dashboard 74 Overview 74 Expected Response Time 75 Historical Response Time 77 ExtremeAnalytics Tracked Applications Dashboard 78 Overview 78 Expected Response Time 79 Historical Response Time 81 ExtremeAnalytics Browser Overview 82 Overview 82 Data Aggregation 83 Options 84 Bookmark 88 Save to Report Designer 88 E
Bidirectional Flows 92 Unidirectional Flows 93 Report Features 93 ExtremeAnalytics Bidirectional Flow Table 94 ExtremeAnalytics Unidirectional Flow Table 98 ExtremeAnalytics Historical Flow Table 101 ExtremeAnalytics Fingerprints Overview 105 ExtremeAnalytics Custom Fingerprints 106 Fingerprint Table 106 Menu 106 Column Definitions 107 Delete Custom Fingerprints 110 Deleting a Custom Fingerprint 110 Custom Fingerprint Examples 112 Fingerprints Based on a Flow 112 Fingerprints B
Engines 125 Status 126 Configuration 126 Virtual Sensors 126 Fingerprints 126 Licenses 127 Status 128 Configuration 128 Virtual Sensors 132 Virtual Sensors 132 Virtual Machines 132 ExtremeAnalytics Engine Advanced Configuration 133 Flow Collection Type 135 Collection Privacy Levels 135 Client Aggregation 136 Slow Client Data 136 Max End-Systems in Hourly Details 136 Sensor Log Levels 136 Store Application Site Data 137 ExtremeControl Integration 137 Flow Sources/Appli
Network Settings 140 DNS 140 NTP 141 SSH 142 SNMP 144 Interfaces 145 ExtremeAnalytics Reports 146 Reports 146 ExtremeAnalytics Report Descriptions 149 Report Descriptions 149 Analytics Events 150 Bandwidth for a Client Over Time 150 Interface Top Applications Treemap 150 Sites Using the Most Bandwidth 150 Most Popular Applications 150 Most Used Applications for a Client 151 Most Used Applications for a User Name 151 Network Activity by Site 151 Network Activity by Client
Top Applications for Server 152 Top Clients by Interface 153 Top Interfaces by Application 153 Top N Applications 153 Top N Clients 153 Top N Servers 154 Add and Modify Fingerprints 155 Adding a Fingerprint 155 Modifying a Fingerprint 158 Enabling or Disabling a Fingerprint 159 Deleting a Custom Fingerprint 160 Updating Fingerprints 161 Perform a Fingerprint Update 161 Schedule Fingerprint Updates 163 Add Fingerprints 165 Add a Fingerprint 165 Enable or Disable Fingerprints
Fingerprints Based on a Flow 176 Fingerprints Based on an Application or Application Group 177 Fingerprints Based on a Destination Address 179 How to Deploy ExtremeAnalytics in an MSP or MSSP Environment 181 Configuring Extreme Management Center Behind a NAT Router 181 ExtremeAnalytics Virtual Sensor Configuration in Extreme Management Center 183 Prerequisites 184 Installing the Virtual Sensor Using the Extreme Management Center Server 186 Install Using Extreme Management Center 187 Config
$SPLUNK/etc/apps/splunk_app_stream/default/streams/netflow (additions) Stream Flow Data from ExtremeAnalytics into Elastic Stack Environment 204 207 207 Overview 207 Part 1 – Installing and Configuring ElastiFlow and Elastic Stack 208 Part 2 – Configuring each Analytics Engine to export IPFIX data to the Elastic Stack server 213 Appendix: Files 214 Additions to ipfix.yml in extr_elastiflow_3.4.2.tar.gz 214 Additions to elastiflow.template.json and elastiflow_ dynamic.template.
Document Version ExtremeAnalytics™ Help ExtremeAnalytics provides Layer 7 application visibility on your network. Combining Extreme Management Center, S-Series and/or K-Series devices, and the ExtremeAnalytics engine, this feature integrates application, user, and device data to give you a full understanding of the applications on your network and who's using those applications.
Document Version Date Revision Number Description 12-19 8.4 Revision -00 Extreme Management Center 8.4 release 06-17 8.0 Revision -00 Extreme Management Center 8.0 release 04-16 7.0 Revision -00 Extreme Management Center 7.
Document Version ExtremeAnalytics Licensing Since its inception, ExtremeAnalytics has tracked the flow rates across all configured ExtremeAnalytics engines and enforced restrictions on the data if the aggregate of these rates exceeded the licensed limit too many times. Beginning in Extreme Management Center version 8.4, ExtremeAnalytics licensing now allows deployment flexibility by also granting end-system flow capacity to an entire deployment, regardless of the number of ExtremeAnalytics engines.
Using Licenses to Establish Flow Rate Capacity PV-FPM-3M 3,000,000 NETSIGHTEVAL 3,000,000 The following list shows the NAC end-system licenses and their limits: ExtremeAnalytics End-System License Name Maximum End-System Limit NMS-ADV-XXX 100 2,000 NETSIGHTEVAL / Subscription Note: If no flow rate license is applied, nms/netsighteval/subscription uses this end-system limit rather than the flow rate limits for licensing purposes.
Using Licenses to Establish Flow Rate Capacity increased by the amount provided by the added licenses, up to the system-wide maximum of 3 million FPM. For example, if you add the PV-FPM-100K license, then you would have a total flow capacity of 103,000. 3,000 + 100,000 = 103,000 FPM If you then add the PV-FPM-50K license, you would have a total end-system capacity of 153,000.
Using Licenses to Establish Flow Rate Capacity l Generates an ExtremeAnalytics License Violation alarm. The second enforcement level causes the following actions when the system is in violation for 7 days or more: l l ExtremeAnalytics replace the application name and group of a random 50% of identified flows with License Violation in the ‘live’ flows in the Flow Grid. Appliances also replace future flow report data including records with License Violation.
Getting Started with ExtremeAnalytics Clearing License Violations Extreme Management Center resets the license violation count only after 7 consecutive days without a violation. When this happens, it triggers an ExtremeAnalytics License Violation Clear event and alarm. Getting Started with ExtremeAnalytics This topic provides information to help you get started using Extreme Management Center ExtremeAnalytics to view network application data in the Analytics tab.
Enable Flow Collection The ExtremeAnalytics engine must be installed and running on your network. For instructions, see the ExtremeAnalytics Engine Installation Guide. Following installation, the ExtremeAnalytics engine must be added to Extreme Management Center and enforced via the Configuration tab in the Analytics tab.
Enable Jumbo Frames Configuring Enhanced Netflow for Extreme Analytics and Extreme Wireless Controller Version 10.21 When adding a Wireless Controller as a flow source in Extreme Management Center, a mirror port is automatically created. Wireless Controllers on which a firmware version of 10.21 or higher is installed use IPFIX, so the mirror port is unnecessary. NOTE: Wireless Controllers on which a firmware version lower than 10.21 is installed still require the mirror port be configured.
Enable Jumbo Frames 2. Select the Controllers tab. The Controllers tab opens.
Enable Jumbo Frames 3. Click the IP address for the controller, located in the Controller column. The Wireless Controller Summary page opens.
Enable Jumbo Frames 4. Click the WebView icon ( ) at the top right of the Wireless Controller Summary page. The WebView opens for the controller.
Enable Jumbo Frames 5. Click the VNS tab. The VNS tab opens. 6. Select Netflow/MirrorN from the left-panel. The Netflow/MirrorN Configuration page opens. 7. Select None from the Traffic Mirror L2 Port drop-down list. 8. Click the Save button. NOTE: The Mirror Port in the Wireless Control Flow Sources section of the Analytics > Configuration > Configuration tab is not available once the Traffic Mirror L2 Port is disabled. 9. Select WLAN Services from the left-panel. The WLAN Services page opens.
Enable Jumbo Frames 34 of 218
Enable Jumbo Frames 10. Click a wireless LAN in the table. The WLAN page opens for the selected wireless LAN. 11. Click the Advanced button. The Advanced window opens.
Enable Jumbo Frames 12. Scroll to the bottom of the window and ensure the Netflow drop-down list is set to Enable. 13. Click the Apply button. The wireless controller is now configured. NOTE: Rx Packets and Rx Bytes may incorrectly be 0 when flow data is gathered via a wireless controller running version 10.21 or higher. Additionally, application response times and some meta data may be blank. This is a known issue and will be addressed in a future release.
Configuring Extreme Management Center Behind a NAT Router How to Deploy ExtremeAnalytics in an MSP or MSSP Environment This Help topic presents instructions for deploying ExtremeAnalytics within an MSP (Managed Service Provider) or MSSP (Managed Security Service Provider) environment.
Configuring Extreme Management Center Behind a NAT Router Where is the NAT IP address of the Extreme Management Center server. Press Enter. b. Restart the appidserver once the new IP address is configured by typing: appidctl restart Press Enter. 4. On the Extreme Management Center server, add the following text to the /appdata/NSJBoss.properties file. In the second to last line, specify the hostname of the Extreme Management Center server.
ExtremeAnalytics Application Data Collection The ExtremeAnalytics engine provides an application data collection function that collects and records information about network utilization. It includes: l l General Usage Collection — High-level application-centric data, collected hourly and in five-minute intervals. Extended Application Collection — Detailed data about all end-systems in the network, collected hourly. Application data collection is based on network flow information.
Data Collection Overview Data from network flows is collected in an aggregated form for a period of time (called a collection interval), and then stored in the Extreme Management Center database. Extreme Management Center uses this data to provide reports that show how your network is being utilized. To conserve space on your Extreme Management Center server hard drive, your ExtremeAnalytics engines only collect total flow records when the server hard drive drops below 10 GB of free space.
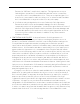
Data Collection Overview application separately from Workstation 2 for Payroll, and from Workstation 1 for Facebook. These target and sub-target pairs provide for Extreme Management Center drill-down reports, for example, reports to show the top Payroll clients or the top applications for Workstation 1. This report shows the top 10 applications seen on the network (based on bandwidth) during the last hour. Collection Statistics Collection statistics are quantitative data that can be collected for a target.
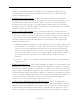
Data Collection Overview l Application Response Time — The average amount of time for a server to respond to a request. This report shows the average application response times for the top 10 applications during the last hour. Collection Intervals The ExtremeAnalytics engine collects and aggregates flow data for a period of time called an interval.
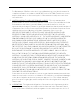
Data Collection Overview This report shows application bandwidth over 24 hours based on a high-rate interval.
Using Sites to Collect In-Network Traffic All statistics can be collected over multiple intervals and averaged. When viewing report data, it is important to know the interval used for any average that is displayed. Certain statistics, such as bytes and flows, can be collected over multiple intervals to provide a total over time, while other statistics, such as client count, cannot. To illustrate, the number of bytes seen in two hours would be the total of the number of bytes seen in each hour.
Data Collector Types You can define your internal network by configuring sites. A site is a set of IP masks that defines a well-known portion of your internal network. You can use the World site to identify your entire internal network. If you have already reserved certain IP address ranges for certain physical sites on your network, you can create multiple sites that correspond to these reserved IP ranges.
Data Collector Types General usage collectors operate at both hourly and high-rate intervals. They can collect data from all flows or from in-network flows only. Hourly General Usage Collectors The following table describes the hourly data collected by the general usage collectors.
Data Collector Types Target SubTarget Bases Traffic Used Client Bytes Received Bytes Transmitted Bytes Flows Receive Flows Transmit Flows Applications Network Response Time Application Response Time All Flows Device Family Bytes Flows Clients In-Network Flows Site Bytes Flows Clients Network Response Time Application Response Time In-Network Flows Profile Bytes Received Bytes Transmitted Bytes Flows Receive Flows Transmit Flows Network Response Time Application Response Time In-Network Flows
Data Collector Types Target SubTarget Threat Threat Threat EndSystem Pair Server Bases Traffic Used Bytes Flows Application Response Time Network Response Time Received Bytes Sent Bytes Inbound Flows Outbound Flows In-Network Flows Bytes Flows Application Response Time Network Response Time Received Bytes Sent Bytes Inbound Flows Outbound Flows In-Network Flows Bytes Received Bytes Transmitted Bytes Flows Receive Flows Transmit Flows Network Response Time Application Response Time All Flows A
Data Collector Types High-Rate General Usage Collectors The following table describes the high-rate data collected by the general usage collectors.
Flow Information Sources ExtremeAnalytics engines. There is also a 25,000 client limit per engine for most license types. However, if you have an NMS-ADV license without any ExtremeAnalytics license, the per-hour total limit is 100 clients across all ExtremeAnalytics engines. Flow Information Sources The ExtremeAnalytics engine uses NetFlow or SFlow records from the switches and wireless controllers in your network as a source for flow data.
Flow Information Sources l l Profile — The client's profile is derived from the ExtremeControl profile assigned to the client end-system. ExtremeControl integration must be enabled. Username — The client's username is derived from network packet inspection. The username can also be provided by ExtremeControl, if ExtremeControl integration is enabled. It is possible that different sources may provide different values for the same information.
Reports c. In the End-System Mobility section, select the Enable distributed end-system cache option. d. Click the Reload button to reload the cache configuration on the Extreme Management Center server. Click OK. 2. Enable ExtremeControl Integration on each ExtremeAnalytics engine where you want to use ExtremeControl data. a. Access the Analytics tab. b. Expand each ExtremeAnalytics engine and select Advanced Configuration.
Reports Browser Reports The Browser provides special reports that lets you select the targets, statistics, and collection interval for your report, as well as define search criteria to further filter report data. Using the Browser, you can create custom queries that provide greater flexibility in defining what data to display and how to display it.
Reports Related Information For information on related ExtremeAnalytics topics: l Getting Started with ExtremeAnalytics l Analytics 54 of 218
Dashboard ExtremeAnalytics Tab Overview The ExtremeAnalytics tab allows you to view and customize its dashboard and browser, as well as ExtremeAnalytics reports, fingerprints, and application flow data. You can also manage and configure your ExtremeAnalytics engines. Additionally, the Menu icon ( ) at the top right of the screen provides links to additional information about your version of Extreme Management Center.
Application Flows Application Flows You can choose from the View drop-down list to show you several options in the table on the Application Flows tab, including the latest flows from the specified ExtremeAnalytics engine, the worst network and application response times, classified and unclassified flows, and flows during a specified time frame. The table presents bidirectional flow data (aggregate flows) or unidirectional flow data (base flows).
Reports reports, you can click on an item in the report to view details or right-click an item to select from other focused reports.
Reports ExtremeAnalytics Dashboard Overview Accessible from the Analytics tab in Extreme Management Center, the Dashboard tab displays an overview of application usage on your network, as well as network activity statistics through a series of real-time reports. The Dashboard is flexible and customizable - you can choose the reports and the design of the page to meet your specific needs. Many of the reports are links to more detailed pages.
Reports Use the Custom Dashboard to drag and drop only the graphs you want on your dashboard. Each graph is a real-time preview and many are linked to additional detail reports. You can also choose whether the graphs in the Application Group area are organized in columns or rows in the Custom Dashboard area. Client/Server Dashboard Reports This dashboard displays reports on clients and servers seen on the network over the last 24 hours.
Reports Healthcare Dashboard The Healthcare Dashboard displays applications used in the healthcare environment including patient care, medical applications, and HIPAA. Venue Dashboard The Venue Dashboard displays data grouped according to sports, social media, news and weather applications, as well as software update applications. IP Reputation Dashboard This report displays potential threat activity on your network from IP addresses known to be suspicious.
Reports number. For example, a botnet command and control node may be a legitimate webserver, which is not suspicious. However, if there are flows certain botnets are known to use specific ports on a node, these communications cause the IP address to be flagged in this classification. l l DShield Top Attackers — The DShield project is a distributed security analysis effort that collects logs, IDS/IPS events, and other data from volunteers around the Internet.
Reports Tracked Applications Dashboard The Tracked Applications Dashboard displays the response time of the applications you configure in the Tracked Applications field on the Analytics > Configuration > Configuration tab. The data for each network service at a site is displayed as a bar and line graph, which is updated periodically. You can choose to organize the graphs in either columns ( ) or rows ( ).
Insights ExtremeAnalytics Insights Dashboard Accessible from the Analytics tab in Extreme Management Center, the Insights Dashboard displays an overview of application usage on your network, as well as network activity statistics based on client/server, application, industry, IP reputation, and response time.
Insights l l l Engines — The number at the center of the ring chart indicates how many engines are represented by the chart. The colors in the graph indicate the states of the configured engines. Hover over a ring color to display a tooltip with the status of that engine. Click the graph to display overview and status details. Virtual Sensors — The number at the center of the ring chart indicates how many virtual sensors are represented by the chart.
How to Create an ExtremeAnalytics Insights Custom Dashboard Custom Dashboard The Custom Dashboard is a customizable space for viewing graphs that you select from the Views drop-down list. The buttons at the top right of the Applications Group dashboard ( ) allow you to save and copy your dashboard.
How to Create an ExtremeAnalytics Insights Custom Dashboard data that is displayed in the graphs, and how the graphs are displayed. You can collapse and expand the Custom dashboard for flexible display capabilities. Custom Dashboard The Custom dashboard is a flexible space for viewing graphs that you select from the Views drop-down list. The buttons at the top right of the Custom dashboard ( ) allow you to save and copy your dashboard.
How to Create an ExtremeAnalytics Insights Custom Dashboard 5. Click the Gear button ( ) in each graph to further modify your Application Group graphs data: l l l l Top — Choose the number of top applications, application groups or clients (depending on the graph) to be displayed in the graph Range — Adjust the time frame of the data depicted in the graph by choosing from the drop-down list.
How to Create an ExtremeAnalytics Insights Custom Dashboard Sites with Highest Response Time — Displays sites with the highest response times. Click any color in the graph to display network and application response time reports for that site. Trending Application Totals — Displays the total number of applications based on the date, time, and duration you choose. Click any color in the graph to display an application detail page.
ExtremeAnalytics Response Time Dashboard ExtremeAnalytics Response Time Dashboard The Response Time Dashboard displays the network and application response time data for the slowest targets on your network based on response time for the last 20 minutes. Use the graph to view response time data for a variety of filters, including application, device family, and username.
Overview Overview The Response Time Dashboard contains two graphs, one displays the network response time and the other displays the application response time. Data is updated every 15 seconds and displays data over the last 20 minutes. If you have multiple ExtremeAnalytics engines, use the Engine drop-down list to select an engine to use as the source for the report data. Use the toolbar at the top of the window to display data based on criteria you select and updates the two graphs.
Overview Top Use the Top field to limit the results in the graphs to display only the top results based on the number you enter. For example, you can configure the graphs to display the top 3 slowest applications by response time. Tracked Applications Click the Tracked Applications box to add response time results for tracked applications to the Network Response Time and Application Response Time graphs.
Network Response Time Graph Filters You can also use the filter options at the top of the window to search for specific criteria. Using these fields limits the data to Tracked Applications, Application, Username, Device Family, Client Site, and Server Site. Entering a value in one of these fields filters the results displayed in the graphs below. Clear the data by clicking the Clear ( ) button to the right of the filter options.
Application Response Time Graph Click the Arrow button ( ) at the top of the flow data table to collapse the table and click the Arrow button ( ) on the collapsed table to expand the table again. Application Response Time Graph The Application Response Time graph displays the response time (in milliseconds) the application request took to complete for the Top N slowest Targets.
ExtremeAnalytics Network Service Dashboard ExtremeAnalytics Network Service Dashboard To access the Network Service Dashboard, open the Analytics > Dashboard tab and select Network Service in the dashboard drop-down list.
Expected Response Time displaying a given application or site pair. The data below this threshold is not reliable and may set off a false alarm, however, you can adjust how much data is required based on the individual needs of your network. The Network Service Dashboard displays the performance (in response time) of your network services.
Expected Response Time slowest response time observed during the selected time period. The vertical green bar indicates the most recently observed response time for the network service. Hover over the Expected Response Time graph to display a pop-up with the response time for the network service as well as the date and time the measurement occurred.
Historical Response Time Historical Response Time The Historical Response Time line graph shows all of the response times observed for the network service at a site. Hovering over a point in the graph causes a dot on the line graph to appear, indicating the point in the response time at which you are looking. Additionally, a pop-up with the date, time, and response time appears for that point. This is the data set from which Extreme Management Center creates the Expected Response Time graph.
Overview ExtremeAnalytics Tracked Applications Dashboard The Tracked Application dashboard displays the performance (in response time) of your network for applications you configure in the Tracked Applications field on the Analytics > Configuration > Configuration tab. To access the Tracked Application dashboard, open the Analytics > Dashboard tab and select Tracked Applications in the dashboard drop-down list.
Expected Response Time is updated every minute and can be manually refreshed by clicking the Refresh button ( ). Select the number of sites displayed in each column in the Top field. The Tracked Applications dashboard can display up to 25 sites. Use the Time Period drop-down list to display the date and time range for which data is displayed. Selecting Custom displays additional fields allowing you to indicate a Start Date and time and an End Date and time.
Expected Response Time Range drop-down list. The value displayed on the far right of the graph is the slowest response time observed during the selected time period. The vertical blue or red bar indicates the most recently observed response time for the application. NOTE: The values in this graph are an average of all response times observed every minute.
Historical Response Time Clicking the Expected Response Time bar graph opens the Response Time dashboard filtered to display the application. If you click the application for a particular site, the Response Time dashboard also filters to that site. Historical Response Time The Historical Response Time line graph shows all of the response times observed for the application at a site. NOTE: The values in this graph are an average of all response times observed every hour.
Overview ExtremeAnalytics Browser Overview The Browser tab lets you query information about recent network activity stored in the Extreme Management Center database and display results in various grid and chart report formats. Using the Browser, you can create custom queries that provide greater flexibility in defining what data to display and how to display it. You can access the Browser from the Extreme Management Center Analytics tab.
Data Aggregation Data Aggregation Network data displayed in a report is aggregated from your network by the ExtremeAnalytics engine and sent to Extreme Management Center. The data gathering process begins with the ExtremeAnalytics engine, which monitors network activity on the switch or controller you configure using a traffic mirror and NetFlow or application telemetry.
Options NOTE: Information held in the ExtremeAnalytics engine's cache is not saved. Restarting the ExtremeAnalytics engine before the data in the memory cache is sent to Extreme Management Center results in the loss of that information. Options Following are definitions of the different options available when creating your custom query. Data Table Select which type of network activity data to query. The correct data table to use depends on the nature of the report.
Options l l l l l l l l l l l l l l Application/Client — Information about applications used by clients, or about clients using an application. Application/Device Family — Information about applications used by device families, or about device families using an application. Application/Interface — Information about the applications used by interfaces. Application/Profile — Information about applications used by profiles, or about profiles using an application.
Options Statistic Statistics are quantitative data that can be collected for the selected target. Available statistics vary depending on the selected target. Select the desired statistic for the report: l l l l l l l l l l l Bytes — The number of bytes transferred in both directions, between the client and the server. Also known as bandwidth. Flows — The number of NetFlow records sent by the switch to report the traffic between the client and the server.
Options Search Criteria Defining search criteria allows you to further filter the report data. Available criteria will vary depending on the selected data table and target. If you select either of the Application Data tables, you can only filter based on the selected target. For example, if you select Sites as your target, you can only filter on defined sites. If you select the End-System Details data table, you can filter on additional criteria.
Options Display Options If you have selected Chart Over Time as your report display format, you can select whether to display the data as a line or an area, and also select the color to use in the chart. Bookmark After you have generated a report, click the Gear menu ( ) in the lower left corner to save the options you have currently set. A new window opens for the current report with a link that can be bookmarked in your browser. You can then use the bookmark whenever you want the same search options.
Options Export to CSV Click the Gear menu ( ) in the lower left corner and click ( ) to export the report data as a CSV file. The currently defined report opens in a spreadsheet, which can then be saved.
Options ExtremeAnalytics Application Flows The Application Flows tab displays tables that present Historical, Bidirectional or Unidirectional client, server, and application flow data. To access the Applications Flows tab, open Analytics > Application Flows. This Help topic provides information on the following topics: l Overview l Application Flows Tables l Report Features Overview The Application Flows tab includes several functions that allow you to filter and customize your table data.
Options View By default, the table displays the latest flows collected. Use the View menu to select different display options. The available options vary depending the flow type (bidirectional or unidirectional) selected. l l l l Latest — Displays the latest flows collected by the specified engine. Worst Network Response Times — Sorts the flows based on the worst TCP response time and displays the flows with the worst time at the top of the chart.
Options 2. Enter meta= before the term for which you are searching includes all variations of that search term in the result set. For example, entering meta=extreme returns extremenetworks.com, www.extremenetworks.com, extreme.boston.com, and any other flows that include the word "extreme". 3. Right-click on a flow to access a menu of options including the ability to: l Add a new custom fingerprint based on the flow selected in the table.
Options and is not designed for historical long-term flow collection. A checkmark ( the table denotes a tracked application or a tracked site. ) in Unidirectional Flows The Unidirectional table displays unidirectional flow data stored in memory. It provides the raw non-aggregated flow data received from the flow sensors on the network. It presents flow data for real-time troubleshooting purposes, and is not designed for historical long-term flow collection.
ExtremeAnalytics Bidirectional Flow Table Bookmark Use the Bookmark button to save the search, sort, and filtering options you have currently set. It opens a new window for the current report with a link that can be bookmarked in your browser. You can then use the bookmark whenever you want the same search, sort, and filtering options. Max Rows By default, the top 100 entries are displayed in the table. However, you can change this value using the Max Rows field at the bottom of the view.
ExtremeAnalytics Bidirectional Flow Table l l - allows you to save report data to a CSV file and to provide The CSV Export icon report data in table form Aggregate Flows data - uses an X number of days, hh:mm:ss format and includes Current Load and Peak Load calculations in flows per second Following are definitions for the table columns: Flow Summary Rest the cursor over the first column in the table and click the arrow to open the Flow Summary window.
ExtremeAnalytics Bidirectional Flow Table Type The content type of a flow, such as sound, video, or text. Click on the Type icon to open the flow's URI. Network Response The response time (in milliseconds) that it took for the TCP request to complete. Application Response The response time (in milliseconds) that it took the application request to complete. Site The name of the site that matches the client's IP address.
ExtremeAnalytics Bidirectional Flow Table duration of a bidirectional flow may be greater than or less than the period of time indicated by the First Seen and Last Seen Time. This is because there may be times during that time period when no flow is active or when several flows are active at the same time.
ExtremeAnalytics Unidirectional Flow Table Output Interface The interface transmitting the flow on the NetFlow sensor. Client TOS The DSCP (Diffserv Codepoint) value for the client to server flow. The TOS/DSCP value is used to configure quality of service for network traffic. Server TOS The DSCP (Diffserv Codepoint) value for the server to client flow. The TOS/DSCP value is used to configure quality of service for network traffic. TTL The TTL (IP Time to Live) value of the flow.
ExtremeAnalytics Unidirectional Flow Table Following are definitions for the table columns: Flow Summary Rest the cursor over the first column in the table and click the arrow to open the Flow Summary window for a specific flow. Flow summary information can include response times, Uniform Resource Identifier, and header data for the flow. In the Flow Summary window, use the Gear menu to access additional functionality such as the ability to modify the application fingerprint or create a policy rule.
ExtremeAnalytics Unidirectional Flow Table Network Response The response time (in milliseconds) that it took for the TCP request to complete. Application Response The response time (in milliseconds) that it took the application request to complete. Site The site where the flow originated. Detailed Site The client's switch IP and switch port (wired), or controller IP, AP, and SSID (wireless). Device Family The operating system family for the client end-system.
ExtremeAnalytics Historical Flow Table Flow Source The IP address of the NetFlow source switch, Application Telemetry source switch, or wireless controller sending the Flow data to the Flow collector. Input Interface The interface receiving the flow on the Flow sensor. Output Interface The interface transmitting the flow on the Flow sensor. TOS The DSCP (Diffserv Codepoint) value for the flow. The TOS/DSCP value is used to configure quality of service for network traffic.
ExtremeAnalytics Historical Flow Table Hover over an application in the table to display switch data, which is an accumulation of multiple switches into single flow record, as well as the path that flow has taken. By default, the top 100 entries are displayed in the table. However, you can change this value using the Max Rows field at the bottom of the view.
ExtremeAnalytics Historical Flow Table Server Port Either the TCP or UDP port on the server handling the flow. Application The name of the application as identified by the ExtremeAnalytics engine using the Fingerprint database. Application Group The flow application group to which the application belongs. Application Info Additional information about the flow provided by the ExtremeAnalytics engine. Network Response The response time (in milliseconds) that it took for the TCP request to complete.
ExtremeAnalytics Historical Flow Table Client Bytes The number of bytes in this flow. For flows collected via Application Telemetry, this number may be estimated. Client Packets The number of packets in this flow. For flows collected via Application Telemetry, this number may be estimated. Server Bytes The number of bytes in this flow. For flows collected via Application Telemetry, this number may be estimated. Server Packets The number of packets in this flow.
ExtremeAnalytics Historical Flow Table ExtremeAnalytics Fingerprints Overview The Fingerprints tab provides detailed information about fingerprints used by ExtremeAnalytics to identify application flows. A fingerprint is a description of a pattern of network traffic which can be used to identify an application. They can be created based on flow, application or application group, or a destination address.
ExtremeAnalytics Historical Flow Table ExtremeAnalytics Custom Fingerprints Custom fingerprints are either new user-defined fingerprints or modifications of system fingerprints. Custom fingerprints can be deleted. If a custom fingerprint was overriding a system fingerprint, then deleting the custom fingerprint will reload the original system fingerprint. The Fingerprints view is divided into a left-panel tree and a table with six columns.
ExtremeAnalytics Historical Flow Table Column Definitions Following are definitions for the table columns. All columns are sortable in ascending and descending order and can be filtered by text or numeric values. Application Name of the application this fingerprint detects. Click on an Application link to view client, flow, and usage information for that specific application. Fingerprint Name of the fingerprint. Confidence Reliability of this fingerprint.
ExtremeAnalytics Historical Flow Table NOTES: l l l Matches are stored and displayed per engine. If you have multiple engines, use the Engine menu to select an engine to use as the source for the Hits and Matches data. If a flow generates hits on multiple fingerprints, and one fingerprint has a higher confidence than another fingerprint, a hit is counted for each fingerprint, but a match is only recorded for the final, highest confidence fingerprint.
ExtremeAnalytics Historical Flow Table Created Date that the fingerprint was created. Description Description of the fingerprint.
Deleting a Custom Fingerprint Delete Custom Fingerprints ExtremeAnalytics uses fingerprints to identify to which application a network traffic flow belongs. A fingerprint is a description of a pattern of network traffic which can be used to identify an application. Extreme Management Center provides thousands of system fingerprints with the ExtremeAnalytics feature. In addition, you can modify these fingerprints and create new custom fingerprints.
Deleting a Custom Fingerprint Related Information l ExtremeAnalytics tab 111 of 218
Fingerprints Based on a Flow Custom Fingerprint Examples The ExtremeAnalytics feature uses fingerprints to identify to which application a network traffic flow belongs. A fingerprint is a description of a pattern of network traffic which can be used to identify an application. Extreme Management Center provides thousands of system fingerprints with the ExtremeAnalytics feature. In addition, you can create new custom fingerprints. For additional information, see Getting Started with ExtremeAnalytics.
Fingerprints Based on an Application or Application Group 5. The Add Fingerprint window opens. 6. Use the drop-down list to select matching Portx11 [6049]. 7. Set the Application Name to X Window System. 8. Set the Application Group to Protocols. 9. Set the Confidence level to 60 (the default). A fingerprint with a confidence higher than 60 can supersede this fingerprint, if it also matches the flow. 10. Click OK to create the fingerprint. 11. Enforce to push the new fingerprint to your engines.
Fingerprints Based on an Application or Application Group group. The new fingerprint categorizes "yahoo ads" flows into the Yahoo Ads ld application and the Advertising application group. Use the following steps to create the fingerprint. 1. Select the Analytics tab in Extreme Management Center. 2. Select the Application Flows tab. 3. In the table, select the Show Unclassified Web Traffic View. 4. Right-click on a flow with the yahoo ads application and select Fingerprints > Add Fingerprint. 5.
Fingerprints Based on a Destination Address Fingerprints Based on a Destination Address In both of the previous examples, you created a new custom fingerprint to cover a case where no appropriate fingerprint existed. You may also want to create a new fingerprint for traffic flows already identified as one application, but should be categorized as something else. For example, let's say you have a Git repository on your network.
Fingerprints Based on a Destination Address 4. The Add Fingerprint window opens. 5. Use the drop-down list to select matching the Git server IP address and port. 6. Set the Application Name to Git. 7. Select an Application Group that makes the most sense for your network. It might be Web Collaboration, Databases, Business Applications, or Storage. You can also create a new Application Group using the Create Custom Application Group option available from the gear menu in the Fingerprint Details tab.
Creating Fingerprints Based on a Flow Create Custom Fingerprints Based on Flow The ExtremeAnalytics feature uses fingerprints to identify to which application a network traffic flow belongs. A fingerprint is a description of a pattern of network traffic which can be used to identify an application. Extreme Management Center provides thousands of system fingerprints with the ExtremeAnalytics feature. In addition, you can create new custom fingerprints.
Creating Fingerprints Based on a Flow 5. The Add Fingerprint window opens. 6. Use the drop-down list to select matching Portx11 [6049]. 7. Set the Application Name to X Window System. 8. Set the Application Group to Protocols. 9. Set the Confidence level to 60 (the default). A fingerprint with a confidence higher than 60 can supersede this fingerprint, if it also matches the flow. 10. Click OK to create the fingerprint. 11. Enforce to push the new fingerprint to your engines.
Creating Fingerprints Based on a Destination Address Create Custom Fingerprints Based on Destination Address The ExtremeAnalytics feature uses fingerprints to identify to which application a network traffic flow belongs. A fingerprint is a description of a pattern of network traffic which can be used to identify an application. Extreme Management Center provides thousands of system fingerprints with the ExtremeAnalytics feature. In addition, you can create new custom fingerprints.
Creating Fingerprints Based on a Destination Address 3. In the table, right-click on an SSH port-based flow with the Git server destination address and select Fingerprints > Add Fingerprint. 4. The Add Fingerprint window opens. 5. Use the drop-down list to select matching the Git server IP address and port. 6. Set the Application Name to Git. 7. Select an Application Group that makes the most sense for your network. It might be Web Collaboration, Databases, Business Applications, or Storage.
Creating Fingerprints Based on an Application or Application Group Create Custom Fingerprints Based on Application or Application Group The ExtremeAnalytics feature uses fingerprints to identify to which application a network traffic flow belongs. A fingerprint is a description of a pattern of network traffic which can be used to identify an application. Extreme Management Center provides thousands of system fingerprints with the ExtremeAnalytics feature.
Creating Fingerprints Based on an Application or Application Group 5. The Add Fingerprint window opens. 6. Use the drop-down list to select matching the "yahoo ads" host. 7. Set the Application Name to Yahoo Ads. 8. Set the Application Group to Advertising. 9. Set the Confidence level to 60 (the default). A fingerprint with a confidence higher than 60 can supersede this fingerprint, if it also matches the flow. 10. Click OK to create the fingerprint. 11. Enforce to push the new fingerprint to your engines.
Creating Fingerprints Based on an Application or Application Group ExtremeAnalytics Packet Captures Packet Captures (pcaps) consist of data included in flows collected by the ExtremeAnalytics engine you can use to analyze and assess the activity and traffic flow to and from IP addresses accessing devices in your network. The Packet Captures tab displays a table with detailed information about pcaps you create from flows on the Application Flows tab.
Creating Fingerprints Based on an Application or Application Group Date/Time The date and time of the packet capture. File Size The file size of the captured packet, in bytes. File Name The file name and path of the captured packet. Source Engine The ExtremeAnalytics engine that captured the packet.
Creating Fingerprints Based on an Application or Application Group ExtremeAnalytics Configuration Overview Use the Configuration tab to view detailed information on the ExtremeAnalytics engines you configure. You can also use the tab to add and enforce your engines, and access engine reports and diagnostics. You must be a member of an authorization group assigned the Extreme Management Center ExtremeAnalytics Read/Write Access capability to view the Configuration tab.
Creating Fingerprints Based on an Application or Application Group Enforce All Enforces all of the ExtremeAnalytics engines added to Extreme Management Center. Poll Poll the selected engine. Restart Collector Restarts the ExtremeAnalytics engine's collector process. Status Select an engine and expand the menu to select Status, where you can view engine status including flow collector, application sensor, CPU and memory, flow sources, and diagnostic information.
Creating Fingerprints Based on an Application or Application Group Use the Menu icon ( ) to access the following system fingerprint actions: Update Perform a manual one-time update of the fingerprint database. Update Settings Schedule fingerprint updates to be performed automatically on a daily or weekly basis. Licenses The Licenses window displays data for each license listed, including flow and end-system capacity totals. Select the Add button ( ) to increase licensing capacity.
Creating Fingerprints Based on an Application or Application Group Status View a collection of ExtremeAnalytics system statistics, including Disk Usage and Approximate Row Counts, as well as Device Families and Profiles. Configuration Use the Configuration window to configure the application information displayed in the ExtremeAnalytics tab.
Creating Fingerprints Based on an Application or Application Group 129 of 218
Creating Fingerprints Based on an Application or Application Group Show Low Confidence Matches Check the box to display flows for which Extreme Management Center has low confidence. Hide Local Collector When Unused Check the box to hide local collector information when not in use. Application Dashboard Map Select from the drop-down list the map from which to draw application dashboard data. Tracked Applications Select the applications to track in the ExtremeAnalytics tab.
Creating Fingerprints Based on an Application or Application Group Related Information l ExtremeAnalytics tab l Advanced Configuration View l Add or Enforce Engines in Configuration View l Add or Remove Devices as Application Telemetry Sources 131 of 218
Virtual Sensors Virtual Sensors The Virtual Sensors tab displays all of the available Virtual Machines on your network as well as those configured as Virtual Sensors. The ExtremeAnalytics Virtual Sensor is a virtual machine that monitors application flows across virtual environments. Virtual Sensors Use the Virtual Sensors section at the top of the tab to view all of the virtual sensors installed on your network.
Virtual Machines ExtremeAnalytics Engine Advanced Configuration Use the Advanced Configuration panel to configure advanced options for the selected ExtremeAnalytics engine. To access this panel, select the Configuration view in the Analytics tab in the Extreme Management Center. In the left-panel tree, expand an engine and select Configuration. If you make any changes in this window, be sure to click Save and then enforce the engine.
Virtual Machines 134 of 218
Flow Collection Type Flow Collection Type Select from NetFlow, Application Telemetry or Both from the drop-down list to choose the flow data you are using. Selecting SFlow changes the Flow Sources table to an Application Telemetry Sources table. These tables allow you to select the devices that collect application telemetry data flow by entering the name, IP and device family for that device.
Client Aggregation Identifying information is data that identifies the end user, such as a username. The ExtremeAnalytics engine collects identifying information when the privacy level is set to Maximum Access or Medium Privacy. Sensitive information is data an end user may not want to share, such as the caller ID or contact information from an end user's SIP voice call. The ExtremeAnalytics engine collects sensitive information when the privacy level is set to Maximum Access.
Store Application Site Data l Informational l Debug l Verbose Debug l Trace l All The sensor log level should be set to Informational unless you are troubleshooting an engine issue. When troubleshooting an issue, Extreme Networks Support may ask you to change the logging level to provide additional information. To view the log file directly, log into the engine and navigate to the file /opt/appid/logs/appid.log. You can also use the engine administration web page to view the sensor log.
Flow Sources/Application Telemetry Sources l If your ExtremeControl engines are using Communication Channels, select the ExtremeControl Communication Channel option and enter the channel name. The ExtremeAnalytics engine is only able to access end-systems in its channel. Flow Sources/Application Telemetry Sources This section displays the devices set up as flow sources in ExtremeAnalytics. To add a device as a flow source: 1. Click the Add button. The Add Flow Source window opens. 2.
Web Credentials NOTE: Packets routed through GRE tunnels on an ExtremeAnalytics virtual engine are incorrectly reported as dropped in the ifconfig output on the GRE interface. This scenario was tested and while these packets are reported as dropped, they are being inspected by the ExtremeAnalytics engine. To remove a device as a flow source, select the device in the Flow Sources section of the window and click the Remove button.
Auditing Auditing Use this section to enable auditing of users connected to the ExtremeAnalytics engine CLI via SSH. Enable Auditing Selecting the Enable Auditing option enables the Auditing Rules field, where you can configure Extreme Management Center to store all commands entered by a user connected to the ExtremeAnalytics engine CLI via SSH in the engine's local syslog file.
Network Settings Search Domains A list of search domains used by the ExtremeAnalytics engine when doing lookups by hostname. When an attempt to resolve a hostname is made, these domain suffixes are appended to the hostname of the device. For example, if someone does a ping to server1, ExtremeAnalytics appends the search domains in an attempt to resolve the name: server1.domain1 server1.domain2, and so on.
Network Settings Time Zone Select the appropriate Time Zone from the drop-down list to allow ExtremeAnalytics to manage date/time settings. NTP Servers A list of NTP servers. You can enter multiple servers for redundancy. Click the Add button to open a blank box in which you can enter an IP address. Select an IP address in the table and click the Delete button to remove an IP address. Use the Up and Down arrows to list the servers in the order they should be used.
Network Settings Port The port field allows you to configure a custom port used when launching SSH to the engine. The standard default port number is 22. Disable Remote root Access Select this option to disable remote root access via SSH to the engine and force a user to first log in with a real user account and then su to root (or use sudo) to perform an action. When remote root access is allowed, there is no way to determine who is accessing the engine.
Network Settings Delete button to remove an IP address. You can add Local and RADIUS users and grant the user Administrative privileges, if appropriate. A user that is granted administrative rights can run sudo commands and commands that only a root user would be able to run. SNMP Use the SNMP configuration section to deploy SNMP credentials for the ExtremeAnalytics engine.
Network Settings Interfaces Use the Interfaces section to configure the ExtremeAnalytics engine interface Extreme Management Center uses to monitor applications accessed on your network. Monitor Mode Use the drop-down list to configure the ExtremeAnalytics engine interface used to monitor network traffic.
Reports ExtremeAnalytics Reports The Analytics tab lets you view and customize ExtremeAnalytics reports and application flow data, as well as manage and configure your ExtremeAnalytics engines. NOTE: ExtremeAnalytics reports and application flow data is not available unless an ExtremeAnalytics engine is configured and you are a member of an authorization group assigned the Extreme Management Center ExtremeAnalytics Read Access or Read/Write Access capability.
Reports l Top Applications Radar l Top Applications Tree Map l Top Clients by Interface l Top Interfaces by Application l Top N Applications l Top N Clients l Top N Servers In most of the reports, use the Gear button (on the right side of the view) to display a Start Time option that allows you to change the length of the reporting period displayed. Depending on the report, you can also change the type and/or format of the data reported, and the number of results to return.
Reports NOTE: Values entered in the text fields that contain multiple, non-alphanumeric characters may cause issues with the returned results. If this happens, use alternate values.
Report Descriptions ExtremeAnalytics Report Descriptions The Analytics tab lets you view and customize ExtremeAnalytics reports and application flow data, as well as manage and configure your ExtremeAnalytics engines. NOTE: ExtremeAnalytics reports and application flow data is not available unless an ExtremeAnalytics engine is configured and you are a member of an authorization group assigned the Extreme Management Center ExtremeAnalytics Read Access or Read/Write Access capability.
Report Descriptions l Top Applications Radar l Top Applications Tree Map l Top Applications for Interface l Top Applications for Server l Top Clients by Interface l Top Interfaces by Application l Top N Applications l Top N Clients l Top N Servers Analytics Events This report displays the event log filtered to show only the events related to ExtremeAnalytics.
Report Descriptions open a report showing the top clients for that application. Click on a client from the report to display an End-System Applications Summary for that client Most Used Applications for a Client This report displays the applications used the most by the specified client, based on bandwidth. Enter a client's IP address or hostname and then click the Submit button to generate the report.
Report Descriptions Top Applications Group Radar In the Top Applications Group Radar report, the info bar provides an overview of application group usage in a radar format. Use the Start calendar to select the start date and time and the format to display. Top Applications Radar In the Top Applications Radar report, the info bar provides an overview of application usage in a radar format. Use the Start calendar to select the start date and time and the format to display.
Report Descriptions Top Clients by Interface This report displays the top clients for a specified switch interface (device) with application telemetry enabled (wildcards allowed). NOTE: You need to first enable the application telemetry feature on ExtremeXOS switches from the Analytics > Configuration tab. Top Interfaces by Application This report displays the top interfaces (device) for a specified application with application telemetry enabled (wildcards allowed).
Report Descriptions l l # Hours — Select the amount of time for which data is displayed from the date and time selected in Start. Statistic — Select the statistic by which the top clients are listed. l Bandwidth l Flows l Number of Applications Top N Servers This report displays server information, provided as a bar graph. Use the fields in the menu to configure the information displayed in the report: l Top N — Select the number of clients displayed in the chart.
Add and Modify Fingerprints ExtremeAnalytics uses fingerprints to identify to which application a network traffic flow belongs. A fingerprint is a description of a pattern of network traffic which can be used to identify an application. Extreme Management Center provides thousands of system fingerprints with the ExtremeAnalytics feature. In addition, you can modify these fingerprints and create new custom fingerprints. For additional information, see Getting Started with ExtremeAnalytics.
Adding a Fingerprint 2. Select the flow in the table that you want to base your new custom fingerprint on. 3. Right-click on the flow and select the Fingerprints > Add Fingerprint option. The Add Fingerprint window opens. 4. Use the drop-down list to select the flow components on which to base the fingerprint. The options vary depending on the fingerprint you initially selected. l l Port — Creates a fingerprint that identifies traffic either coming from or going to the specified port.
Adding a Fingerprint l l l Address with mask on port — Creates a fingerprint that identifies traffic either coming from or going to the specified subnet on the specified port. For example, an IP address of 192.168.0.0 with a mask of 16 would result in all traffic either coming from or going to the 192.168 subnet on the specified port to be identified by the fingerprint. Host — Creates a fingerprint that identifies a specific hostname in the URI of web traffic.
Modifying a Fingerprint Modifying a Fingerprint Modify a fingerprint's application name, application group, confidence level, and description from the Fingerprints tab. 1. Select the Analytics > Fingerprints tab. 2. Right-click on the desired fingerprint and select Modify Fingerprint from the menu. The Modify Fingerprint window opens. 3. Make the desired changes: l Application Name — The name of the application that the fingerprint detects.
Enabling or Disabling a Fingerprint all fingerprints that have that same application name. NOTE: If you change both the Application Name and Application Group: If the new Application Name matches an existing name, the application group changes to the new group for all fingerprints with that new name, regardless of whether you choose to change the name for only the selected fingerprint or for all fingerprints with that name.
Deleting a Custom Fingerprint 3. Enforce to push the change to your engines. NOTE: If you disable a system fingerprint, it becomes a custom fingerprint. If you then enable the fingerprint, it remains a custom fingerprint. Deleting the custom fingerprint reloads the original system fingerprint. Deleting a Custom Fingerprint Delete a custom fingerprint from the Fingerprints tab. A custom fingerprint is either a new user-defined fingerprint, a modification of a system fingerprint, or a disabled fingerprint.
Updating Fingerprints 3. You can delete only the selected fingerprint or select the option to delete all custom fingerprints that match the application name of the selected fingerprint. 4. Click OK. If a custom fingerprint overrides a system fingerprint, then deleting the custom fingerprint reloads the original system fingerprint. 5. Enforce to push the change to your engines. Updating Fingerprints New and updated fingerprints are provided via a fingerprint update website.
Updating Fingerprints 3. Click the Menu icon ( ) and select Update Fingerprints. If you have already configured your Fingerprint Update settings, the update is performed immediately. If you have not configured your settings, the Fingerprint Update window opens. a. Leave the Interval selection as Not Scheduled. b. Select the Enforce Updates checkbox to automatically update fingerprints on all engines. Not selecting this checkbox requires you to update each engine manually. c.
Updating Fingerprints proxy server. g. Click Save. The Fingerprint Update is performed immediately. 4. If you did not select the Enforce Updates checkbox, enforce to push the changes to your engines when the update is complete. Schedule Fingerprint Updates You can schedule fingerprint updates performed automatically on a daily or weekly basis. To access the update website, you need to create an Extranet account at ExtremeNetworks.com and define a username and password for the account.
Updating Fingerprints 7. Select the Enforce Updates checkbox to automatically update fingerprints on all engines. Not selecting this checkbox requires you to update each engine manually. 8. The Update Site field displays the default path to the official fingerprint update site. Typically, this field does not change unless for security reasons the system does not have access to the internet and an internal update site must be used. 9.
Add a Fingerprint Add Fingerprints ExtremeAnalytics uses fingerprints to identify to which application a network traffic flow belongs. A fingerprint is a description of a pattern of network traffic which can be used to identify an application. Extreme Management Center provides thousands of system fingerprints with the ExtremeAnalytics feature. In addition, you can modify these fingerprints and create new custom fingerprints.
Add a Fingerprint 4. Use the drop-down list to select the flow components on which to base the fingerprint. The options vary depending on the fingerprint you initially selected. l l l l l Port — Creates a fingerprint that identifies traffic either coming from or going to the specified port. Address on port — Creates a fingerprint that identifies traffic either coming from or going to this IP address on the specified port.
Add a Fingerprint 5. If you selected an IP address with mask option, you need to specify a subnet of IP addresses. Enter the IP CIDR mask, which is a mask on the flow IP, with 0-32 for IPv4 and 0-128 for IPv6. 6. Enter the name of the application for which the fingerprint is defined. 7. Use the drop-down list to select the application group to which the application belongs. If none of the existing groups are appropriate, you can enter a new group name and the new group is automatically created. 8.
Enabling or Disabling a Fingerprint Enable or Disable Fingerprints ExtremeAnalytics uses fingerprints to identify to which application a network traffic flow belongs. A fingerprint is a description of a pattern of network traffic which can be used to identify an application. Extreme Management Center provides thousands of system fingerprints with the ExtremeAnalytics feature. In addition, you can modify these fingerprints and create new custom fingerprints.
Modifying a Fingerprint Modify Fingerprints ExtremeAnalytics uses fingerprints to identify to which application a network traffic flow belongs. A fingerprint is a description of a pattern of network traffic which can be used to identify an application. Extreme Management Center provides thousands of system fingerprints with the ExtremeAnalytics feature. In addition, you can modify these fingerprints and create new custom fingerprints.
Modifying a Fingerprint 3. Make the desired changes: l Application Name — The name of the application that the fingerprint detects. If you change the application name, you are prompted to select whether to change the application name for only the currently selected fingerprint or for all fingerprints that have that same application name.
Modifying a Fingerprint l Description — A description of the fingerprint. The description only applies to the currently selected fingerprint. 4. Click OK. 5. Enforce to push the change to your engines.
Updating Fingerprints Update Fingerprints ExtremeAnalytics uses fingerprints to identify to which application a network traffic flow belongs. A fingerprint is a description of a pattern of network traffic which can be used to identify an application. Extreme Management Center provides thousands of system fingerprints with the ExtremeAnalytics feature. In addition, you can modify these fingerprints and create new custom fingerprints.
Updating Fingerprints 3. Click the Menu icon ( ) and select Update Fingerprints. If you have already configured your Fingerprint Update settings, the update is performed immediately. If you have not configured your settings, the Fingerprint Update window opens. a. Leave the Interval selection as Not Scheduled. b. Select the Enforce Updates checkbox to automatically update fingerprints on all engines. Not selecting this checkbox requires you to update each engine manually. c.
Updating Fingerprints proxy server. g. Click Save. The Fingerprint Update is performed immediately. 4. If you did not select the Enforce Updates checkbox, enforce to push the changes to your engines when the update is complete. Schedule Fingerprint Updates You can schedule fingerprint updates performed automatically on a daily or weekly basis. To access the update website, you need to create an Extranet account at ExtremeNetworks.com and define a username and password for the account.
Updating Fingerprints 7. Select the Enforce Updates checkbox to automatically update fingerprints on all engines. Not selecting this checkbox requires you to update each engine manually. 8. The Update Site field displays the default path to the official fingerprint update site. Typically, this field does not change unless for security reasons the system does not have access to the internet and an internal update site must be used. 9.
Custom Fingerprint Examples The ExtremeAnalytics feature uses fingerprints to identify to which application a network traffic flow belongs. A fingerprint is a description of a pattern of network traffic which can be used to identify an application. Extreme Management Center provides thousands of system fingerprints with the ExtremeAnalytics feature. In addition, you can create new custom fingerprints. For additional information, see Getting Started with ExtremeAnalytics.
Fingerprints Based on an Application or Application Group 5. The Add Fingerprint window opens. 6. Use the drop-down list to select matching Portx11 [6049]. 7. Set the Application Name to X Window System. 8. Set the Application Group to Protocols. 9. Set the Confidence level to 60 (the default). A fingerprint with a confidence higher than 60 can supersede this fingerprint, if it also matches the flow. 10. Click OK to create the fingerprint. 11. Enforce to push the new fingerprint to your engines.
Fingerprints Based on an Application or Application Group group. The new fingerprint categorizes "yahoo ads" flows into the Yahoo Ads ld application and the Advertising application group. Use the following steps to create the fingerprint. 1. Select the Analytics tab in Extreme Management Center. 2. Select the Application Flows tab. 3. In the table, select the Show Unclassified Web Traffic View. 4. Right-click on a flow with the yahoo ads application and select Fingerprints > Add Fingerprint. 5.
Fingerprints Based on a Destination Address Fingerprints Based on a Destination Address In both of the previous examples, you created a new custom fingerprint to cover a case where no appropriate fingerprint existed. You may also want to create a new fingerprint for traffic flows already identified as one application, but should be categorized as something else. For example, let's say you have a Git repository on your network.
Fingerprints Based on a Destination Address 4. The Add Fingerprint window opens. 5. Use the drop-down list to select matching the Git server IP address and port. 6. Set the Application Name to Git. 7. Select an Application Group that makes the most sense for your network. It might be Web Collaboration, Databases, Business Applications, or Storage. You can also create a new Application Group using the Create Custom Application Group option available from the gear menu in the Fingerprint Details tab.
Configuring Extreme Management Center Behind a NAT Router How to Deploy ExtremeAnalytics in an MSP or MSSP Environment This Help topic presents instructions for deploying ExtremeAnalytics within an MSP (Managed Service Provider) or MSSP (Managed Security Service Provider) environment.
Configuring Extreme Management Center Behind a NAT Router Where is the NAT IP address of the Extreme Management Center server. Press Enter. b. Restart the appidserver once the new IP address is configured by typing: appidctl restart Press Enter. 4. On the Extreme Management Center server, add the following text to the /appdata/NSJBoss.properties file. In the second to last line, specify the hostname of the Extreme Management Center server.
Configuring Extreme Management Center Behind a NAT Router ExtremeAnalytics Virtual Sensor Configuration in Extreme Management Center The ExtremeAnalytics Virtual Sensor is a virtual machine that monitors application flows across virtual environments. The Virtual Sensor sends network traffic information to your ExtremeAnalytics engine for processing. The ExtremeAnalytics engine then sends the processed information to Extreme Management Center, where it is displayed on the Analytics tab.
Prerequisites IMPORTANT: Configuration of the virtual environment via Extreme Management Center is limited to distributed virtual switches only. Configuring a Virtual Sensor includes the following steps: 1. Prerequisites 2. Installing the Virtual Sensor using the Extreme Management Center Server 3. Adding the Virtual Sensor in ExtremeAnalytics 4.
Prerequisites l l Your vCenter vSphere login is configured with an administrative role in at least the following permissions in the cluster the Virtual Sensor is monitoring : o Distributed Switch ¾ VSPAN operation o Datastore ¾ Allocate space ¾ Browse datastore ¾ Remove file o Host ¾ Local operations l Create virtual machine l Delete virtual machine l Reconfigure virtual machine o Network ¾ Assign network o Tasks ¾ Create task ¾ Update task o vApp ¾ Import ¾ View OVF environment 185 of 218
Installing the Virtual Sensor Using the Extreme Management Center Server o Virtual machine ¾ Change Configuration l Add new disk l Advanced configuration ¾ Edit Inventory l Create new l Remove ¾ Interaction l l Power off l Power on The VMware Open Virtualization Format Tool (OVFTool) is installed on the Extreme Management Center server. NOTE: Instructions for this prerequesite are not included. You must be a VMware customer to download the OVF Tool.
Installing the Virtual Sensor Using the Extreme Management Center Server l l Install Using Extreme Management Center — To install using ExtremeConnect functionality in Extreme Management Center, use the instructions in this topic. Install Using the vSphere Web Client — To install using the vSphere web client, refer to the section "Installing Virtual Sensor using vSphere Web Client" in the ExtremeAnalytics Virtual Sensor 1.0.0 Software Installation Guide.
Installing the Virtual Sensor Using the Extreme Management Center Server 2. Select VMware vSphere in the Modules list in the left-panel. 3. Open the Services tab in the right-panel. 4. Click Add Service. A new row appears. 5. Enter the information for your vCenter server in the new row: l username — Username used to access the vCenter server. l password — Password used to access the vCenter server. l server — vCenter server IP address.
Installing the Virtual Sensor Using the Extreme Management Center Server Adding the Virtual Sensor to Extreme Management Center After configuring the vCenter server in ExtremeConnect, download and add the Virtual Sensor .OVA file in Extreme Management Center. 1. Access the Network > Devices > Sites > World site. 2. Open the ZTP+ Device Defaults tab in the right panel. 3. Select IP in the Use Discovered drop-down list. 4.
Adding the Virtual Sensor in ExtremeAnalytics NOTE: Download the Small .OVA file if you are using a VS100 license or the Medium .OVA file if you are using a VS250 license. Microsoft Internet Explorer downloads the .OVA file as a .TAR file. Change the file extension back to .OVA once the download is complete. Using Google Chrome avoids this step and downloads the file as an .OVA file. 7. Navigate back to Extreme Management Center. 8. Open the Network > Firmware tab. 9. Click Upload.
Adding the Virtual Sensor in ExtremeAnalytics 3. Click Install in the Virtual Sensors section of the tab. The Install Virtual Sensor on Hypervisor Host window displays. 4. Click the ellipsis button ( ) in the Hypervisor Host field and select the hypervisor host on which you are installing the Virtual Sensor. 5. Click the ellipsis button ( ) in the Datastore field and select the datastore, if the field does not automatically populate. 6.
Adding the Virtual Sensor in ExtremeAnalytics NOTE: If you enter an IP address included in a range defined in a site, the DNS Server and NTP Server are automatically populated from that site, if defined. 13. Enter the Root Password for the Virtual Sensor. 14. Enter the Domain name (for example, extremenetworks.com). 15. Enter the DNS Server IP address and NTP Server IP address, if applicable. 16. Click Install. NOTE: The installation may take several minutes.
Configuring vCenter Settings for the Virtual Sensor Configuring vCenter Settings for the Virtual Sensor To ensure the Virtual Sensor is performing optimally, configure the following vCenter settings for your Virtual Sensor: 1. In vCenter, power off the Virtual Sensor virtual machine. 2. Right-click the virtual machine and select Edit Settings. 3.
Overview Stream Flow Data from ExtremeAnalytics into Splunk ExtremeAnalytics includes the ability to stream flow data from an Analytics engine to Splunk. To help you use Splunk with ExtremeAnalytics, we added a Splunk directory to the Extreme Management Center NetSight/appdata/Purview directory.
Part 1 – Making File Level Splunk Modifications Part 1 – Making File Level Splunk Modifications 1. Connect to the Splunk server via SSH. 2. Enter cd $SPLUNK_HOME/etc/apps/splunk_app_stream/local. 3. Copy the streamfwd.conf file. (If there is no streamfwd.conf file present, skip this step.) 4. Copy Extreme's version of the streamfwd.conf file and paste it into streamfwd.conf. Alternately, merge Extreme's version of streamfwd.conf settings into the existing streamfwd.conf file. 5.
Part 2 – Creating a New Stream using the Splunk web UI 5. Create a new stream. a. Click on New Stream > Metadata Stream to start creating a stream for ExtremeAnalytics. b. Select the Netflow protocol. c. Type a name and description for your stream. d. If you are an advanced Splunk user, you can choose an appropriate Aggregation method. This can be changed later, as well.
Part 2 – Creating a New Stream using the Splunk web UI aggregate off in this topic. e. In the Fields dialog box, you do not have to deselect any filters. You can deselect any selected filters you do not need later. f. In the Filters dialog box, do not deselect any filters. You can deselect any selected filters you do not need later.
Part 2 – Creating a New Stream using the Splunk web UI g. In the Settings dialog box, select Enabled for Status. h. In the Groups dialog box, leave the default, and click Create Stream.
Part 3 – Configuring each Analytics Engine to Export IPFIX Data to the Splunk i. After you click Create Stream, Splunk confirms that your stream was created. Part 3 – Configuring each Analytics Engine to Export IPFIX Data to the Splunk Server 1. Log in to Extreme Management Center. 2. Navigate to Analytics > Configuration.
Part 3 – Configuring each Analytics Engine to Export IPFIX Data to the Splunk 3. Use the following steps for each engine you want exporting flows to Splunk, a. Click on its Configuration page. b. Expand the IPFIX/Netflow Exporter section and fill out the required fields. c. Ensure that Export Enabled is checked. d. Set the Export IP to the Splunk server IP address. e. Set the Export Port to 2055 unless this has been customized in Splunk. f. Set the Protocol to either IPFIX or IPFIX with Padded Strings. g.
Appendix Appendix Files $SPLUNK/etc/apps/splunk_app_stream/local/streamfwd.conf $SPLUNK/etc/apps/Splunk_TA_stream/local/streamfwd.conf [streamfwd] port = 8889 ipAddr = 127.0.0.1 netflowReceiver.0.ip = 10.54.116.45 netflowReceiver.0.port = 2055 netflowReceiver.0.decoder = netflow #netflowElement.997.enterpriseid = 1916 netflowElement.997.id = 96 netflowElement.997.termid = extr.appName netflowElement.998.enterpriseid = 1916 netflowElement.998.id = 371 netflowElement.998.termid = extr.
Appendix netflowElement.1005.enterpriseid = 1916 netflowElement.1005.id = 1005 netflowElement.1005.termid = extr.nacProfile netflowElement.1006.enterpriseid = 1916 netflowElement.1006.id = 1006 netflowElement.1006.termid = extr.detailedLocation netflowElement.1007.enterpriseid = 1916 netflowElement.1007.id = 1007 netflowElement.1007.termid = extr.oneSidedFlow netflowElement.1008.enterpriseid = 1916 netflowElement.1008.id = 1008 netflowElement.1008.termid = extr.clientLocation netflowElement.1009.
Appendix string Destination Host Name - ExtremeAnalytics uint64 TCP Response Time - ExtremeAnalytics uint64 Application Response Time - ExtremeAnalytics shortstring Server IP Address - ExtremeAnalytics PAGE 204Appendix $SPLUNK/etc/apps/splunk_app_ stream/default/streams/netflow (additions) { }, { }, { }, { }, { }, { "aggType": "value", "desc": "Application Name - ExtremeAnalytics", "enabled": true, "name": "app-name", "term": "extr.appName" "aggType": "value", "desc": "Application Group Name - ExtremeAnalytics", "enabled": true, "name": "application-group", "term": "extr.appGroupName" "aggType": "value", "desc": "User Name - ExtremeAnalytics", "enabled": true, "name": "x-user-name", "term": "extr.
Appendix }, { }, { }, { }, { }, { }, { }, { "aggType": "value", "desc": "Application Response Time - ExtremeAnalytics", "enabled": true, "name": "app-response-time", "term": "extr.appResponseTime" "aggType": "value", "desc": "Server IP Address - ExtremeAnalytics", "enabled": true, "name": "server-ip-address", "term": "extr.serverAddress" "aggType": "value", "desc": "Client NAC Profile - ExtremeAnalytics", "enabled": true, "name": "client-nac-profile", "term": "extr.
Appendix }, { } "enabled": true, "name": "server-location", "term": "extr.serverLocation" "aggType": "value", "desc": "Extra Meta Data - ExtremeAnalytics", "enabled": true, "name": "meta-data", "term": "extr.
Overview Stream Flow Data from ExtremeAnalytics into Elastic Stack ExtremeAnalytics includes the ability to stream flow data from an ExtremeAnalytics engine to Elastic Stack (aka ELK stack). To help you use Elastic Stack with ExtremeAnalytics, we added an ELK directory to the Extreme Management Center NetSight/appdata/Purview directory.
Part 1 – Installing and Configuring ElastiFlow and Elastic Stack Part 1 – Installing and Configuring ElastiFlow and Elastic Stack ElastiFlow installation instructions can be found at: l https://github.com/robcowart/elastiflow/blob/master/INSTALL.md Other helpful installation links are: l https://www.catapultsystems.com/blogs/install-elastiflow-on-ubuntu-18-04-part-1/ l https://sadsloth.net/post/elastiflow-ubuntu1804/ 1. Download and install the Oracle Server JRE 8 in one of the following ways: a.
Part 1 – Installing and Configuring ElastiFlow and Elastic Stack can install elasticsearch .) sudo /bin/systemctl daemon-reload sudo /bin/systemctl enable elasticsearch.service sudo systemctl start elasticsearch.service b. Install Kibana: sudo apt -y install kibana sudo /bin/systemctl daemon-reload sudo /bin/systemctl enable kibana.service sudo systemctl start kibana.service c. Install Logstash: sudo apt -y install logstash 3. Configure Elastic Stack components. a.
Part 1 – Installing and Configuring ElastiFlow and Elastic Stack sudo systemctl restart kibana The default port for the Kibana’s server is tcp port 5601. Create a firewall rule to allow users access to the Kibana server. The rule should be something like: sudo ufw allow from YOUR_MANAGEMENT_SUBNET to any port 5601 proto tcp c. Configure Logstash: Edit JVM setting in /etc/logstash/jvm.options. sudo nano /etc/logstash/jvm.options Change -Xms1g to -Xms4g. Change -Xmx1g to -Xmx4g. Save the file.
Part 1 – Installing and Configuring ElastiFlow and Elastic Stack a. To prepare for this step, copy the extr_elastiflow_3.4.2.tar.gz file to the /etc/logstash directory. b. cd /etc/logstash sudo tar xvzf extr_elastiflow_3.4.2.tar.gz 7. Configure logstash pipelines.yml. a. sudo nano /etc/logstash/pipelines.yml b. Add: - pipeline.id: elastiflow path.config: "/etc/logstash/elastiflow/conf.d/*.conf" NOTE: Be careful about spacing and extra blank lines with the following file.
Part 1 – Installing and Configuring ElastiFlow and Elastic Stack sudo mv 20_filter_40_sflow.logstash.conf 20_filter_40_ sflow.logstash.conf.disabled; 8. To prevent packet drops: sudo cp -arv /usr/local/src/elastiflow-3.4.2/sysctl.d/87elastiflow.conf /etc/sysctl.d/. To apply sysctl changes without restart: sudo sysctl --system 9. Set up Kibana index patterns. a. Download https://github.com/robcowart/elastiflow/archive/v3.4.2.tar.gz to the computer that you will use to view ElastiFlow. b.
Part 2 – Configuring each Analytics Engine to export IPFIX data to the Elastic Part 2 – Configuring each Analytics Engine to export IPFIX data to the Elastic Stack server 1. Log in to the Extreme Management Center. 2. Navigate to Analytics > Configuration. 3. Use the following steps for each engine that you want exporting flows to ElastiFlow: a. Click on the engine's Configuration page. b. Expand the IPFIX/Netflow Exporter section. c.
Appendix: Files 5. Go to Kibana at http://YOUR_KIBANA_SERVER_IP:5601. 6. Select Dashboard. 7. Click on ElastiFlow: Overview. You should see some data. 8. The Logstash log file displays the following message: … [WARN ][logstash.codecs.netflow ] Can't (yet) decode flowset id xxx from observation domain id xxxx, because no template to decode it with has been received. This message is normal.
Appendix: Files - :extr_appResponseTime 1004: - :ip4_addr - :extr_serverAddress 1005: - :string - :extr_nacProfile 1006: - :string - :extr_detailedLocation 1007: - :uint8 - :extr_oneSidedFlow 1008: - :string - :extr_clientLocation 1009: - :string - :extr_serverLocation 1010: - :string - :extr_metaData Additions to elastiflow.template.json and elastiflow_ dynamic.template.json in extr_elastiflow_3.4.2.tar.gz { }, { }, { } } } } "ipfix.extr_userName": { "path_match": "ipfix.
Appendix: Files }, { }, { }, { }, { }, { }, { } } } } } } } } } } } } "mapping": { "type": "keyword" "ipfix.extr_dstHostName": { "path_match": "ipfix.extr_dstHostName", "mapping": { "type": "keyword" "ipfix.extr_netResponseTime": { "path_match": "ipfix.extr_netResponseTime", "mapping": { "type": "long" "ipfix.extr_appResponseTime": { "path_match": "ipfix.extr_appResponseTime", "mapping": { "type": "long" "ipfix.extr_serverAddress": { "path_match": "ipfix.
Appendix: Files }, { }, { }, { }, { }, } } } } } } } } } } "ipfix.extr_detailedLocation": { "path_match": "ipfix.extr_detailedLocation", "mapping": { "type": "keyword" "ipfix.extr_oneSidedFlow": { "path_match": "ipfix.extr_oneSidedFlow", "mapping": { "type": "long" "ipfix.extr_clientLocation": { "path_match": "ipfix.extr_clientLocation", "mapping": { "type": "keyword" "ipfix.extr_serverLocation": { "path_match": "ipfix.extr_serverLocation", "mapping": { "type": "keyword" "ipfix.
Appendix: Files }, "extr_appGroupName": { "type": "keyword" }, "extr_srcHostName": { "type": "keyword" }, "extr_dstHostName": { "type": "keyword" }, "extr_netResponseTime": { "type": "long" }, "extr_appResponseTime": { "type": "long" }, "extr_serverAddress": { "type": "ip" }, "extr_nacProfile": { "type": "keyword" }, "extr_detailedLocation": { "type": "keyword" }, "extr_oneSidedFlow": { "type": "long" }, "extr_clientLocation": { "type": "keyword" }, "extr_serverLocation": { "type": "keyword" }, "extr_metaDa