
User's Guide
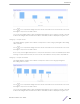
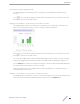
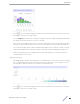
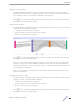
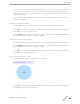
Table Of Contents
- Table of Contents
- Preface
- 1: Product Overview
- Architecture
- Presence
- Zone Tracking
- Position Tracking
- Device and Associate Classification and Tracking
- Crowding Event Notification and Analysis
- Import Location Based Services from AirDefense Service Platform
- WiNG Integration With ExtremeLocation
- Scheduling Reports
- Bluetooth Locationing
- Asset Tracking
- Vertical Customization
- Integrating with Extreme Cloud and Extreme Cloud Appliance
- 2: Log In to ExtremeLocation
- 3: Dashboard
- Load the Dashboard
- Create a Dashboard
- Set a Default Dashboard
- Manage Your Dashboards
- Delete the Dashboard
- Dashboard Widgets
- Site Analytics Widgets
- Visit Type
- Inside Visitor Engagement Trend
- Inside Engaged Visitor Duration
- Loyalty - First vs Repeat
- Visit Opportunity
- Visits - Outside Visitor vs Inside Visitor - (Σ)
- Inside Engaged Visitor Trend - (Σ)
- Top 5 Sites (Visit)
- Bottom 5 Sites (Visits)
- Top 5 Sites (Visit Duration)
- Bottom 5 Sites (Visit Duration)
- Visits - Outside Visitor vs Inside Visitor (Day of Week)
- Visits - Outside Visitor vs Inside Visitor (Hour of Day)
- Inside Engaged Visitor Trend (Day of Week)
- Inside Engagement Trend (Hour of Day)
- Unique Visitors (Outside Visitor vs Inside Visitor)
- Unique - Inside Engaged Visitor vs Associates vs Assets
- Visits - Inside Engaged Visitor vs Associates vs Assets
- Visits - Inside Engaged Visitor vs Associates vs Assets - Totals
- Visit Opportunity (Σ) - App Users
- Inside Engaged Visitor (Σ) - App Users
- Inside Bounced Visitor (Σ) - App Users
- Outside Visitor (Σ) - App Users
- Mean Time Between Visits (Σ) - App Users
- Visit Duration (Σ) - App Users
- App Users Visits By Site
- App Users Visits (Hour of Day)
- App Users Visits (Day of Week)
- Visit Type - App Users
- Inside Engaged Visitor Duration - App Users
- App User Loyalty - First vs Repeat
- Visits - Outside Visitor vs Inside Visitor (App users) (Σ)
- Top 5 Sites (App User Visits)
- Bottom 5 Sites (App User Visits)
- Top 5 Sites (App User Visit Duration)
- Bottom 5 Sites (App User Visit Duration)
- App User Visits - Outside Visitor vs Inside Visitor (Day of Week)
- App User Visits - Outside vs Inside (Hour of Day)
- App User Visits (Outside Visitor vs Inside Visitor)
- Category Analytics Widgets
- Category Visits - Assets
- Category Visits - Associates
- Category Visits - Visitors
- Top 5 Categories by Visits
- Bottom 5 Categories - By Visits
- Top 5 Categories - By Visit Duration
- Bottom 5 Categories By Visit Duration
- Top 5 Categories (By Visits) (BLE)
- Bottom 5 Category (By Visits) (BLE)
- Top 5 Categories (By Visit Duration) (BLE)
- Bottom 5 Categories (By Visit Duration) (BLE)
- Category - Visit Duration By Assets
- Category - Visit Duration By Associates
- Category - Visit Duration of Visitors
- Category - Unique Visitors
- Category - Unique Assets
- Category - Unique Associates
- Unique App Users By Category (BLE)
- Category Visit Duration - Inside Visitor vs Associates vs Assets
- Category - Inside Visitors vs Associates vs Assets Over Time
- Category Crowding
- Category Crowding (BLE)
- Category Path Analysis
- Category Path Analysis (BLE)
- Category Visits By Hour (BLE)
- Category Visits By Weekday (BLE)
- Total Visits (All Categories - BLE)
- Average Dwell Time By Minutes (Category - BLE)
- Average Dwell Time By Category (BLE)
- Visit Trend (Category - BLE)
- Category App Users (BLE)
- Category Visit Duration (App Users)
- Experience Analytics Widgets
- Journey Analytics Widgets
- User and Device Analytics Widgets
- Operation Analytics Widgets
- Site Analytics Widgets
- Scheduled Reports
- 4: Sites
- 5: Categories
- 6: Access Points
- 7: Beacons
- 8: Asset Management
- 9: Payloads
- 10: Experiences
- 11: Journey
- 12: User Apps
- 13: Devices
- 14: Settings
- A: Configure ExtremeWireless Access Points
- Configuring ExtremeWireless WiNG Access Points
- Configuring ExtremeWireless Access Points
- Configuring AirDefense Sensor Support
- B: Configuring Extreme Cloud Appliance
- C: UDP Terminator for Extreme Identify Access Point BLE Traffic

Average Dwell Time By Minutes (Category - BLE)
This widget displays the distribution of average dwell time of app visits by minutes for a selected
category.
Use the icon to expand the widget to fill the current view window. Use the same button to restore
the widget to its previous size and location.
Use the Category drop-down list to change the category for which the data is displayed. By default, the
last category selected in the previous session is selected.
Average Dwell Time By Category (BLE)
This widget displays the average dwell time of app visits (in minutes) for all categories.
Use the
icon to expand the widget to fill the current view window. Use the same button to restore
the widget to its previous size and location.
Visit Trend (Category - BLE)
This widget displays the distribution of app visits for a selected category.
Use the icon to expand the widget to fill the current view window. Use the same button to restore
the widget to its previous size and location.
Use the icon to change the widget's graph type to Bar Chart. The icon now changes to the
alternate graph type available for this widget.
Use the Category drop-down list to change the category for which the data is displayed. By default, the
last category selected in the previous session is selected.
Category App Users (BLE)
This widget displays the duration of app visits to a category over time.
Use the
icon to expand the widget to fill the current view window. Use the same button to restore
the widget to its previous size and location.
Category Visit Duration (App Users)
This widget displays the app visit duration by category over time.
Use the icon to expand the widget to fill the current view window. Use the same button to restore
the widget to its previous size and location.
Experience Analytics Widgets
Use the Experience Analytics widgets to view various analytics related to experiences.
Dashboard
ExtremeLocation User Guide 76