Summit® WMScanner User Guide Extreme Networks, Inc. 3585 Monroe Street Santa Clara, California 95051 (888) 257-3000 (408) 579-2800 http://www.extremenetworks.
AccessAdapt, Alpine, Altitude, BlackDiamond, EPICenter, ExtremeWorks Essentials, Ethernet Everywhere, Extreme Enabled, Extreme Ethernet Everywhere, Extreme Networks, Extreme Standby Router Protocol, Extreme Turbodrive, Extreme Velocity, ExtremeWare, ExtremeWorks, ExtremeXOS, Go Purple Extreme Solution, ExtremeXOS ScreenPlay, ReachNXT, Sentriant, ServiceWatch, Summit, SummitStack, Triumph, Unified Access Architecture, Unified Access RF Manager, UniStack, the Extreme Networks logo, the Alpine logo, the BlackD
Table of Contents Chapter 1: Summit WMScanner Overview .............................................................................................. 5 System Requirements ..............................................................................................................................................5 Additional Recommendations for 3D Use........................................................................................................5 Installation on XP, Vista 32, Vista 64 ..............
Table of Contents Drawing Limits........................................................................................................................................37 Layer Properties Manager .......................................................................................................................37 Lineweight Settings .................................................................................................................................39 Prune Overlapping Partitions .............
Table of Contents Channel Width Performance .................................................................................................................114 Data Rate Performance..........................................................................................................................115 Verifying Network Coverage .......................................................................................................................117 Identifying and Locating Access Points ...............
Table of Contents Up/Down ...............................................................................................................................................167 Format Floor..........................................................................................................................................167 Help Button ...........................................................................................................................................167 Assemble Building ............
1 Summit WMScanner Overview Summit® WMScanner is a software package that enables you to efficiently measure and visualize 802.11an and 802.11bgn network performance. The software utilizes a floor plan map and a special network driver adapter to allow you to measure, visualize, and archive vital wireless network information. The powerful visualizations allow you to identify network problems and rogue access points site-specifically on the map.
Summit WMScanner Overview For Measurements, use these recent Atheros 802.11 chipset LAN Cards: ● Ubiquity SR71 USB a/b/g/n Adapter ● Netgear 802.11a/b/g Wireless PC Card (model #WAG511) ● Cisco a/b/g Cardbus Adapter (model #AIR-CB21AG-A-K9) ● Ubiquiti Networks SuperRange Cardbus ● D-Link DWA 645 Rangebooster N 650 Notebook Adapter ● AirPcap N 802.
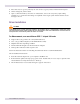
3 Select Treat Drivers Signed by Microsoft the Same as Those Signed by Others and then click Properties. 4 On the settings tab, select Enabled. 5 Open a command window, select Run As Administrator, and run the Group Policy update utility, GPUpdate.exe, to ensure that the settings are updated on the target system. Ensure that the success message is shown.
Summit WMScanner Overview 4 Choose I accept this agreement. Select Next.
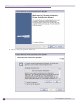
5 If you receive a warning message reporting the software has not passed Windows Logo testing, choose Continue Anyway. The driver will now be installed. When the installation finishes, it will notify you that the installation was successful. If you encounter an error, please contact the Extreme Networks support. 6 An Add remove entry is added which can be used to remove the driver from the system.
Summit WMScanner Overview NOTE If some other driver (say card manufacturer’s driver) has been installed prior to running the installer then, then the installer will create a backup of the old driver before installing the new driver. The old driver will be restored when the driver will be uninstalled. The installer may or may not ask for a computer restart. Uninstalling the Measurements Driver To uninstall the measurements driver: 1 Go to the Windows Control Panel. 2 Click on Add or Remove Programs.
4 Again, select your adapter and select OK to confirm you wish to remove the hardware (this will not uninstall the driver. This process simply allows you to safely unplug the adapter from your computer). You can now remove the WLAN Adapter from your computer. This completes the hardware removal process.
Summit WMScanner Overview Activating Your Software For continued use beyond the 14 day trial period, Summit WMScanner requires an activation code, an activation code must be obtained from Extreme Networks to fully activate your software. NOTE To obtain a license activation code you will need the MAC address of the machine the WMScanner product is installed on. This can be obtained from the Register Product dialog in the procedure that follows.
3 To obtain an activation code for your software, complete the activation request form. Your software includes a 14-day trial license to provide you with a brief grace period. To begin using your software, click Cancel and then click the Exit Update Dialog button. Applying Your Activation Code 1 An activation code will be returned to you via email as a file attachment. Upon receipt of your activation code, save the file to an easily-accessible location, preferably your Windows desktop.
Summit WMScanner Overview Providing the WMScanner Activation Code An annual activation (license) code is required for continued use of Summit WMScanner. Use the following steps to update the activation (license) code: 1 Launch Summit WMScanner from the desktop icon. 2 Select the Help menu. 3 Click on the Manage Licenses option. The License Maintenance dialog box displays. 4 Select Register Product.
To obtain the Summit WMScanner software license key: a Note the Summit WMScanner Serial/Voucher Number for the software. Summit WMScanner is part of the Extreme Networks Wireless Management Suite (WMS) software. It uses the same Serial/Voucher Number as WMS. The WMS Serial/Voucher Number can be found on the product label located on the outside flap of the WMS CD sleeve.
Summit WMScanner Overview 7 Click on the Register button. Summit WMScanner is now ready for use. Understanding Wireless Network Design Some general knowledge is important for measuring a 802.11a, b, g, or n wireless communications network. By no means is this section meant to be complete or comprehensive, but it should serve as a general introduction for someone who is looking to expand their knowledge of WLANs.
Steps for Measuring a Wireless Network This section provides you a brief overview of a common suggested workflow using Summit WMScanner. This workflow describes how most people will work with Summit WMScanner to measure, visualize measurement results, and troubleshoot WLAN problems. This workflow is intended to give you a better understanding of how to get started using this software. As your knowledge of this product matures, you may find more productive ways to use the software as your needs require.
Summit WMScanner Overview ● Jpg or Bmp file: Any raster image depicting the building floorplan can be used for surveys within Summit WMScanner. These images can be drawn by hand in basic image editing software, or they can be taken from existing floor plans. After importing and scaling, a .jpg or .bmp file is a simple, efficient method for modeling a building within Summit WMScanner. ● Raw facility CAD file: Most large building facilities are designed in a CAD (Computer Aided Design) software package.
2 WMScanner GUI and Menus This chapter provides the information you need to become familiar with the Summit WMScanner Graphical User Interface (GUI), menu options, utilities, and help options. To help you use Summit WMScanner efficiently, the chapter is organized around the following structure: ● “WMScanner GUI Layout” - Provides an overview of the Graphical User Interface (GUI), toolbar icons, and command line window. ● “WMScanner Menus”- Describes the primary Summit WMScanner menus and their options.
WMScanner GUI and Menus NOTE To display the Legend Window, select the Toggle dockable legend icon from the toolbar. For more information, see “Toolbar Icons” on page 20. NOTE Whenever you change Summit WMScanner’s window size, user preferences, or the project workspace, all settings are saved upon exiting the tool. These saved settings are restored the next time that you launch Summit WMScanner.
The toolbar icons that follow allow you to manipulate the drawing views: : Drawing Window - Right Click Menu Right-clicking anywhere within the drawing window displays the following menu. This menu provides quick access to the most commonly used functions for viewing the drawing, including real-time pan and zoom and moving up and down building floors. NOTE Whenever performing tasks within Summit WMScanner, you can press Esc to cancel or abort any command.
WMScanner GUI and Menus ● F6 - Zoom to drawing extents ● F9 - Go to a specific floor Legend Window In addition to the legend displayed in the drawing, Summit WMScanner contains a legend window that displays labels and colors for partition categories and measurement data. To toggle the legend window on or off, click the remain off (or on) until you toggle it again. button on the standard toolbar.
WMScanner Menus Summit WMScanner has been designed with an organized menu structure designed to allow you to quickly access similar features from within the same menu. The following sections provide a brief overview of each toolbar menu and the functionality that is provided by the submenu commands. File Menu The File menu provides the ability to create and open project workspaces, open, and save drawings: New Drawing Creates a new empty drawing that can be used to construct a floor plan.
WMScanner GUI and Menus NOTE You can only merge two WMScanner color schemes if you open a drawing. 1 Click Yes to display the Color Scheme Merge Wizard.. The color scheme merge wizard displays the list of differing schemes as well as the differences between those schemes. The dialog box displays the conflicting elements of the Default Scheme and the current scheme used in the drawing (Drawing Scheme), on opposite sides of an automatically suggested Final Scheme.
a To add an element to the Final Scheme manually, select the elements from either the Drawing Scheme or Default Scheme and then click the “>” or “<“ buttons. b To remove the unnecessary element, select the element and then click the Remove button. c To edit the Final Scheme manually, click the Edit Scheme... button. The Edit Scheme dialog box appears, which uses the same system discussed in “Editing a Color Scheme” on page 26. 2 Click the Next > button, once you are done with editing the color scheme.
WMScanner GUI and Menus 4 Click Finish. Editing a Color Scheme There are many reasons why a color scheme might need to be changed. Use the following steps when an existing color scheme needs to be edited: NOTE The following steps may be used to add or remove basic colors from the Color Scheme. 1 Click once on the color scheme for editing. 2 Click the Edit button. The Color Scheme Editor dialog box appears. 3 Double-click the value to be changed. For this demonstration, select 802.11 Channels.
The appropriate scaling will be applied so that the distance between the points within the drawing matches the value you enter. If your drawing contains measurement data, you should erase it before using the scale command. 1 To scale drawing, select File > Scale Floor Plan. 2 Click the OK button. Select the two points in the drawing to know the physical distance between. The Scale Drawing dialog box appears showing the desired distance.
WMScanner GUI and Menus Window Zooms a particular area/window in the drawing. Once the window zooming is activated, click and hold the left mouse button while moving the mouse up or down to zoom in or out. Press ESC to cancel. Pan Use Pan to move left, right, up or down in your view of the drawing. Pan is an alternative to using the scrollbars. When this menu option is selected, the cursor changes to a hand, and allows the user to drag the screen image around with the left mouse button.
The Building Floor submenu contains the following commands: ● Up One Floor - If a drawing has more than one floor, and the current floor is not the top floor, this command will make all layers associated with the next higher floor visible and hide all other layers. ● Down One Floor - If a drawing has more than one floor, and the current floor is not the lowest floor, this command will show all the layers associated with the next lower floor visible and hide all other layers.
WMScanner GUI and Menus ● Hide Floor - This command opens the Select Drawing Floors to Hide dialog. After selecting a floor to hide, the software hides layers associated with the chosen floor. View Menu - Shade The commands under this submenu allows users to modify the way the display is rendered. Select the Refresh Screen command to return to normal operation.
● 2D Wireframe - The default view of the drawing. All surfaces will appear transparent, allowing you to see through walls and visualization results. 2D Wireframe is best used with bitmap and JPEG images. ● Hidden - Shades and displays the object like Flat Shaded, Edges On except that it hides the lines representing faces hidden from the user’s perspective. ● Flat Shaded, Edges On - Shades the objects between the polygon faces.
WMScanner GUI and Menus Display Transmitters on Other Floors When this checkbox is activated, the complete antenna system of all access points on all floors will be visible at all times. When not checked, only access points on the current floor will be visible. Display Legend When this checkbox is activated, the legend in the drawing will be visible, displaying information about the meaning of colors of partitions and of visualization results.
Reset Display of Informational Windows Some commands in Summit WMScanner will display a dialog box containing helpful hints on using the command when it is accessed for the first time. These dialog windows, known as information windows, provide detailed information about the command. It is highly recommended that you carefully review each information window before continuing to use the corresponding command.
WMScanner GUI and Menus Building Wizard This command launches the Building Wizard, which is used to format, edit, and assemble building floors. The Building Wizard operates within the current Project Workspace and does not necessarily perform operations in the currently open drawing. In fact, accessing this menu command can force you to save the file you currently have open before proceeding. For details, see “Format Building Menu” on page 165.
Scale Drawing The Scale Drawing command allows you to resize entities within the environment. You can scale the entire drawing (both formatted and unformatted), or only the formatted entities of one drawing or each entity-byentity. You will be prompted to select two points in the drawing (by clicking with the mouse) and you can then enter the actual physical distance between the two locations you picked.
WMScanner GUI and Menus Advanced Sub-menu The Advanced sub-menu provides functionality for modifying different aspects of a drawing, drawing entities, and objects. Building Manager The Building Manager dialog box provides advanced functionality for managing and navigating floors in the current drawing. Most users will not require these features. Add Floor Adds a new floor to the current drawing. Remove Floor Removes a selected floor from the current drawing.
Hide Floor Hides a selected floor. Align Floors Aligns floors vertically if a building has multiple floors. Specify Ceiling Opens the Ceiling Editor dialog box, which allows you to select the floor, and Add Section of Ceiling, or Erase Section of Ceiling. Set Reference Point If you are combining drawings of the same floor or are of two separate buildings, use Set Reference Point on each drawing separately to position the drawings properly relative to one another before combining them.
WMScanner GUI and Menus When layers are visible, you can make changes to entities on the layer. Hidden layers remain stored in the drawing file, but the objects on hidden layers are not accessible for selection. Layers that are hidden are generally unaffected by your actions. Certain commands in the software will access and alter entities that exist on hidden layers.
existing layer. The Layer Properties Manager also allows you to create new layers by using the New button in the Layer Properties Manager dialog box. You can also select a particular layer and make it the current layer by clicking the Current button. Lineweight Settings Lineweight Settings are useful for increasing the thickness with which lines are drawn in 2D Wireframe and other wireframe views.
WMScanner GUI and Menus Equipment Menu The Equipment menu encapsulates the ability to place, configure, and modify your network equipment within Summit WMScanner. Summit WMScanner allows you to place access points, sensors, and controllers in your network design. 40 Place Access Point This command prompts you with a list of pre-configured access points that you may place in your drawing. To place an access point, double click your left mouse button on an access point from the list.
Sensor This command opens a fly-out menu for placing, editing/removing, moving, and copying sensors. RFID This command opens a fly-out menu for placing, editing/removing, and moving RFID readers. The RFID readers come with a default antenna. You can add more antennas and also edit antennas. See “Adding/Editing the Antenna” on page 157 for more details. Reference Tag This command opens a fly-out menu for placing, editing/removing, and moving Reference-Tags.
WMScanner GUI and Menus Visualize Survey Data This command allows you to view data based on real WLAN measurements. Invoking this command opens the Visualization panel, allowing you to select from the following types of heat maps: Channel Grid Coverage Grid SNR Grid SSID Grid Data Rate Grid Noise Grid Hybrid Network Overlap Grid Channel Width Performance Grid Channel Width Configuration Grid Data Rate Performance Grid See “Visualizing Survey Data” on page 100 for details.
1 Launch Microsoft Word. 2 From the top menu in Microsoft Word, select Tools > Templates and Add-ins... 3 In the Global templates and add-ins section, click on the Add... button 4 Browse to the c:\program files\Summit WMScanner\Template directory. 5 Select the rfreporting.dot file. 6 Click on the OK button. 7 Uncheck all other .dot files listed. 8 Click on the OK button. The rfreports.dot file is loaded and ready for the Summit WMScanner report generation.
WMScanner GUI and Menus 44 Summit WMScanner Users Guide
Summit WMScanner Users Guide 45
WMScanner GUI and Menus When you are satisfied with the report parameters, select Generate Report, and chose an output file name from the Save As dialog: 46 Summit WMScanner Users Guide
After selecting the report parameters, Summit WMScanner generates the report. Depending on the complexity of the design, this may take several minutes.
WMScanner GUI and Menus 48 Summit WMScanner Users Guide
Utilities Menu The Utilities menu provides access to commands that are useful through the entire software package. The commands allow you to do such things as: ● Enter project information ● Set/Create Project Workspace ● Alter the drawing legend ● Create text labels ● Show distance between two points ● Preferences Project Information This command opens a tabbed dialog box that will allow you to view and edit information about the current project workspace.
WMScanner GUI and Menus Show Distance Between Points This command prompts the user to select points in a drawing; Summit WMScanner draws temporary line segments between consecutive points. While the mouse cursor is moved around, a tool tip displays the sum of the lengths of the line segments. Pressing ESC once will cancel the current set of lines, and pressing ESC again will terminate the command. The distance is based on the current scale of the drawing.
To select a project workspace to be the current workspace, you may first select a repository of workspaces, using the Browse button. The current workspace repository is indicated to the left of the Browse button. The default repository directory is “C:\Program Files\Summit WMScanner\Workspaces”. You will only need to select a different repository if your workspaces are stored on a file server or other non-default location, e.g. if you are sharing centrally stored workspaces with collaborators.
WMScanner GUI and Menus You can also delete a project workspace by selecting the Erase button. Creating a New Project Workspace To create a new project workspace, select File > Set/Create Project Workspace.
From the Project Workspace selection dialog box, you can create, erase and choose between currently defined project workspaces. At the top of the dialog box, the Current Project Workspace is shown. The Current Project Workspace can be changed, a new project workspace can be created, and project workspaces can be deleted from with the Project Workspace dialog. To create a new workspace, select the New button from within the Project Workspace dialog.
WMScanner GUI and Menus In addition, a subdirectory with the new project name will be created under the Workspaces Directory and the local project workspace directory structure will be established within it. In general, you are free to add your own directories or subdirectories to any project workspace as the job demands. Keep in mind that changes to files in the global workspace may directly impact all project workspaces.
After you have created the new project workspace, select Done to exit the Project Workspace dialog. Now, the active project workspace is the one you just created. Utilities - Geo-Reference Building Summit WMScanner enables you to geo-reference your drawing. Summit WMScanner allows you to record the latitude and longitude coordinates for a given set of points in your drawing, effectively georeferencing these points.
WMScanner GUI and Menus NOTE The latitude value must be within the range -90 to +90 and the longitude value must be within the range -180 to +180. You can enter up to six decimal places in the latitude and longitude field. Summit WMScanner rounds the seventh digit after the decimal point. . Click the OK button to record the points. You can re-record the points by clicking on the Pick Points button. This overwrites the earlier recorded points.
Click the Pick Point button and then click on the drawing to re-record the x, y points. Enter the WGS84 latitude and longitude for these newly recorded points. Click the OK button to exit the dialog box by recording the edited values; click the Cancel button to exit the dialog box without recording the new values and ignore the new changes. Utilities - Drawing Legend Selecting Utilities > Legend opens the Drawing Legend dialog.
WMScanner GUI and Menus drawing to set the new legend position. Choose the point in the drawing where you want the lower left corner of the legend to appear. ● 58 Once you have finished configuring and placing the legend, press the OK button to dismiss the Drawing Legend dialog. You may edit the drawing legend at a later time by accessing the menu command Utilities > Legend.
Preferences Dialog Summit WMScanner offers many different configuration preferences for your convenience. These preferences allow you to configure the file paths, printers, autosave, pointer devices, fonts, colors, and many other settings. This section describes each of the tabs in the Preferences dialog. Preferences - Files The Files tab in the Preferences dialog box presents the options noted on the next page.
WMScanner GUI and Menus Preferences - Display This tab, controls various options related to how the drawing is rendered to the screen. For example, the Colors button allows you to customize the user interface colors to suit your personal preferences. 60 ● Display scroll bars in drawing window - Enables horizontal and vertical scrollbars in drawing window. ● Colors - The Color Options dialog box allows you to customize the colors used in the drawing.
● Fonts - The following dialog allows you to choose a font for the Command Line pane and the Session History window. This only affects the appearance of text within the lower command prompt area.
WMScanner GUI and Menus Preferences - Open and Save Preferences related to how Summit WMScanner opens and saves files are contained in the Open and Save tab under the Options dialog. Users will typically want to keep the “Save as:” preference set to “Summit WMScanner 2004 drawing”. This option is the default; however, users can override this in the “Save As…” dialog box available from the File menu. External References (Xrefs) are links within a CAD drawing file to a separate, external drawing file.
Preferences - Plotting This tab controls the default settings for the printing and plotting subsystem. Use this functionality to control the way in which your designs are printed.
WMScanner GUI and Menus Preferences - System This tab enables you to adjust such properties as whether or not the software will generate an audible alert on errors, and to configure access to system pointing devices other than the Windows system mouse (example, a CAD drawing tablet).
Preferences - User Preferences The User Preferences tab contains a number of settings that are primarily of interest to users familiar with AutoCAD. The default settings for these values are generally the most beneficial. ● Windows Standard Behavior - Enables you to select whether to use the standard Windows accelerator keys (example, CTRL-C performs a copy operation, CTRL-V performs a paste operation) or the rightclick popup menu.
WMScanner GUI and Menus operation by activating or deactivating Object Sorting. Except in extremely specialized applications (example, you wish to have certain drawing entities plotted prior to others), this functionality should not affect your work in Summit WMScanner. ● Lineweight Settings - Enables you to activate, deactivate, or adjust the settings for the display of lineweights in the software.
Preferences - 3D Modelling Tab The options in the 3D modelling tab are useful if Summit WMScanner to set with solids and surfaces in 3D. options for working . ● 3D crosshairs: this option in 3D operations. ● controls settings for the display style of the crosshairs pointer ■ Show Z Axis in Crosshairs: Controls whether the Z axis is displayed by the crosshairs pointer. ■ Label Axes in Standard Crosshairs: Controls whether axis labels are displayed with the crosshairs pointer.
WMScanner GUI and Menus ■ ● Display in 3D Perspective Projection: Displays the UCS icon in model space when the current visual style is set to 3D Hidden, 3D Wireframe, Conceptual, or Realistic, and the projection style is set to Perspective. Dynamic Input: Controls the display of dynamic input fields for coordinate entry. ■ Show Z Field for Pointer Input: dynamic input. ● Displays a field for the Z coordinate when using 3D Objects: Controls settings for the display of 3D solids and surfaces.
● Noun/Verb Selection - To specify objects for a command to operate upon, you can either make the selection and invoke the command, or invoke the command and then make the selection. The former is considered a noun/verb selection (the selection occurs before specifying the action) and is enabled by this checkbox. ● Use Shift to add to selection - Checking this box forces Summit WMScanner to use the typical Windows selection semantics.
WMScanner GUI and Menus ● IP Address: Specify the IP address of the WMS server. ● Port Number: Specify the port numbers for secured and unsecured communication protocols. The default port number for secured communication (HTTPS) is 8443, and for unsecured communication (HTTP) is 9090. ● Communication Protocol: Select HTTPS for a secured communication and HTTP for unsecured communication with WMS server. HTTPS is the default communication protocol.
Extreme Networks Website This command launches Extreme Networks Website. About This command opens the About Summit WMScanner screen, which shows information about the software.
WMScanner GUI and Menus 72 Summit WMScanner Users Guide
3 Measurement Surveys Summit WMScanner eliminates the hassles involved in collecting data acquisition by implementing a point-and-click method of acquiring measurement data from your PC’s wireless LAN (WLAN) card. The following workflow diagram provides an overview of the primary measurement survey steps for recording measurements and visualizing the results.
Measurement Surveys NOTE Before recording measurements, run File > Scale Floor Plan and identify a measured area in the floorplan to provide Summit WMScanner with an accurate representation of distances within the drawing file. Taking Measurements The recommended method of taking measurements is by the use of a notebook, laptop or pen-tablet computer with a preferred PCMCIA wireless LAN adapter card or USB card. This configuration allows the user to physically take 802.
The Configure Real-Time Measurement Run Information dialog box appears. The Configure Real-Time Measurement Run Information dialog box contains the following options for tailoring measurement runs: ● Description - All measurement data files are distinguished from one another by a unique description that you provide in this edit box. The measurement description must consist of alphanumeric characters.
Measurement Surveys 3 From the Select Measurement Mode drop-down list, select WLAN Device. 4 Click the Next button. The Measurements Options dialog box appears.
The Measurements Options dialog box contains three options: ■ RF Monitoring - Collects data passively by sniffing the packets from the surrounding access points. ■ AP Performance - Collects data directly from an access point. This option is also known as throughput. ■ Server Mode - Starts a throughput server for server side measurements. 5 Select the RF Monitoring option. 6 Click the Next button. The Configure Real-Time Measurement Run Information dialog box appears.
Measurement Surveys ● In 20 MHz mode, only APs working in the 20 MHz channel width are detected. Setting the advanced Channel Width Settings option detects 40 MHz APs while scanning for channels with 20 MHz channel width. This option is disabled by default when the channel width is set to 20/40 MHz or 40 MHz. ● In 40 MHz mode, you can specify the exact extension channel to be used. This option is disabled by default for other modes.
The drawing map window is divided into two parts: ● ● Access Point Information - The Access Point area contains the following information about the detected access points: ■ MAC Address - Media Access Control address for the corresponding access point. ■ SSID - Service Set Identifier for the corresponding access point. ■ Signal Strength - The average signal strength of the wireless connection as reported by the client. ■ RSSI - Received Signal Strength Indication.
Measurement Surveys Setting Measurement Points While Summit WMScanner is polling the wireless network, you can record single marker or complete track run measurement points. This is performed from within the Mode section of the measurement survey control panel: 1 Select a mode for setting measurement points. Mode options are: ■ Single Marker - To correlate a measurement with a specific location, select Marker Mode, then leftclick the location in the model where the measurement is being made.
In the next example, the user clicks the ending point of the track run.
Measurement Surveys 2 To delete measurement Single Marker or Track Run data points, click the Undo button. Track runs are deleted one segment at a time. Select Pause to halt network measurement, Resume to continue the measurement survey session. Configure Visible Data By default, the Measurement Scan List panel shows all the available visible Access Point information. As a result, some columns may be hidden.
Click the Configure Visible Data button to configure the displayed information/columns. The Select Scan List Columns to be Displayed dialog box appears. Select the columns to be displayed in the Panel. You can also change the order in which the columns need to be displayed. The Select Scan List Columns to be Displayed dialog box contains the following controls: ● Hidden Columns List Box: Contains the columns which you do not want to display on the Measurement Scan List panel.
Measurement Surveys Configuring the Authorized List Knowing and categorizing all access points broadcasting throughout your facility is a critical portion of a measurement survey. Summit WMScanner allows you to select and control which access points are categorized as Authorized (green AP icon), Rogue (red circle icon), or Unauthorized (yellow exclamation point icon).
2 To categorize the access points, select the Configure Authorized List button and select the access points you wish to remove from the Rogue MAC address list: 3 Next, the selected access points are moved to the Unauthorized MAC Addresses list.
Measurement Surveys In the next example, access points are also move to the Authorized MAC Addresses list. 4 If you need to remove MAC addresses from any of the lists, select the desired MAC address, then click the Remove MAC button below the respective list.
NOTE Best practice tip: Document the MAC Address and SSID on a sheet of paper before removing the access point from Summit WMScanner. This information can be added using one of the ADD buttons. 5 When finished modifying the Authorized List, click the OK button. The Measurement control panel will display the new state of each access point. 6 To filter the access points based upon Authorized List status, use the View pull-down. When you are finished with the measurement survey, select Exit.
Measurement Surveys often measurements are automatically flushed to the logfile. For receivers that support configurable averaging of data points, the Options dialog box provides control over the type of averaging and the averaging interval. (Note that linear averaging converts values to linear power units such as Watts before averaging, while the dB averaging algorithm averages the dB values directly.
1 Select the AP Performance option and then click the Next button. 2 The Select WLAN Adapter dialog box appears. Select the Measurements (or other) WLAN adapter. 3 Click the OK button. Summit WMScanner polls the wireless network, and displays the visible access points in real-time.
Measurement Surveys You can specify different ways to enforce data transfer by selecting an option in the “Data transfer method”. You can enforce data transfer either manually or by starting a AP Performance Server measurement session. Enforcing Data Transfer Manually By selecting User Selected Application from the drop-down list you can start the data transfer you want. Perform the following steps: 1 Ensure that the client is connected to the AP. 2 Start recording in the AP Performance mode.
6 Choose the server type as Local Server and click the Connect button to start the session. The software attempts to start the client and server on the same laptop, in such a way that any data exchange that happens between the two actually traverses the AP - client link. NOTE In this process, under one of its steps the software tries to auto detect the IP of the gateway on the network or the IP of the AP.
Measurement Surveys Starting a Remote AP Performance Server Session To start a remote measurement server session, choose the Server option in Measurement Options dialog box The Select Server Port dialog box prompts for the server port number. After you specify the port number, the Measurement Server window appears.
If you are not running in standalone mode, there are two ways to connect to a server: ● Using a client to connect to the server - From the client, in the Network tab, click Connect. Select Remote Server as the Server type. Enter the IP address of the server to connect to it. ● Using a server to connect to a client - From the server, choose the menu option End Point > Connect. NOTE You do not require remote server connection to use the measurement client.
Measurement Surveys Enter the IP address of the server you wish to connect to and the port that the server is running on, then click Connect button. Servers that you have recently connected to will be remembered. In future runs, you can reconnect to a server, by choosing one from the history list on the Connect to Server dialog box. After you are connected, click save data to record measurements.
Configuration and Statistics Panel Link Information Tab. The Link Information tab shows the performance of the current link. This tab contains the following information: information: ● SSID - The SSID of the AP. ● BSSID – The BSSID of the AP. ● Air Standard – The air standard used for the data transfer. ● Channel (Ext.) – The 802.11 channel number used to transfer data. An extension channel is used if the data transfer is currently happening in the 40 MHz channel width.
Measurement Surveys NOTE These fields are only displayed when data transfer is happening between the Client – AP link. Data transfer must be enforced by the user. For more information, check the section “Enforcing data transfer and Server-coupled Measurements”. Data Tab. This tab appears while using AP Performance Server data transfer method only.
● UDP Stream: Configure - Opens the UDP Stream Setup dialog box. From this dialog box, you can modify the Client/Server Packet Size, specify the UDP packet Timeout, and adjust the packet Averaging Interval. The UDP Stream protocol is a set of rules that the client and server follow to exchange UDP data packets across the network. This protocol is designed to simulate Voice Over IP or real time video streaming applications.
Measurement Surveys ● Packet Error Rate - Percentage of packets that the client sent, but the server never returned. Possible causes for lost packets include: the packet was mis-routed from the client to the server, the packet was mis-routed from the server to the client, or the network latency was too high and the packet did not return in the given timeout interval. This statistic is only available for UDP Stream mode.
Chat Tab. This tab appears while using AP Performance Server data transfer method only. The Chat tab allows you to send messages to the server and other Summit WMScanner clients. To use this facility you must be connected to a server. Then, type your message into the Message field and click the Send button. A copy of the message will be displayed in the status window of the Chat tab along with the IP address of the sender.
Measurement Surveys Visualizing Survey Data To display survey data: .
Visualization Panel This section describes the options in the Visualization panel.
Measurement Surveys ■ Noise - See “Noise Visualization” on page 110 ■ Channel Width Performance - See “Channel Width Performance” on page 114 ■ Data Rate Performance - See “Data Rate Performance” on page 115 ■ Hybrid Network Overlap - See “Hybrid Network Overlap Visualization” on page 112 ■ Channel Width Configuration- See “Channel Width Configuration Visualization” on page 113 The Filter By drop-down list displays all filters. You have an option to filter by Channel, SSID, and Association Status.
● Grid Options - Opens the Visualization Options dialog box. ● Filter Measured Values - The pull-down menu allows you to display the visualization based upon access point/base station Channels, SSID, or Association status. ● Standard - This General Settings option allows you to select the Air Interface Standard such as IEEE 802.11g, 802.11a, 802.11b, and 802.11n. Available Air Interface Standard options are dependent on the configuration of the selected access point.
Measurement Surveys Configuring Measurement Visualizations Summit WMScanner automatically picks an area of your drawing over which to generate measurement visualizations. You may configure this area as well as other grid visualization options such as the resolution of the display.
● Configure Grid Bin Size - The Grid Bin Size sets the resolution of the visualization grid. Increasing this number produces more points in the building over which data is calculated and displayed. This will increase the amount of time required to draw the heat map. For typical indoor office environments, a value of one meter generally works well. This value should always be set to something less than the Distance Visualization Limit.
Measurement Surveys An example of channel visualization is shown on the next page. Hovering the mouse over the grid vertices displays more information about the data at particular points in the visualization: This visualization, by default, colors the 20 MHz 802.11 channels and all combinations of their 40 MHz 802.11 channels in the same color. For example, all grid vertices serving the channels 5(-1), 5 and 5(+1) are shown in the same color.
verify the location and channel settings of the APs within your infrastructure. To open coverage visualization, choose the Coverage option: NOTE Coverage grids are only displayed as shaded when in Flat Shaded, Edges On mode (View > Shade > Flat Shaded, Edges On). SNR Visualization The SNR (signal-to-noise ratio) visualization mode allows you to view the best SNR from the MAC addresses you have selected within the Visualization Panel filters.
Measurement Surveys Visualization panel filters. Using the filters allows you to identify areas of good or poor signal quality for specific networks, or specific MAC addresses. NOTE SNR grids are displayed as shaded when visualized in the Flat Shaded, Edges On mode (View > Shade > Flat Shaded, Edges On). SSID Visualization The SSID visualization mode allows you to view regions of coverage colored by the best serving SSID to that region.
. You may wish to also fine tune the signal strength cutoff criteria for displaying the SSID coverage regions. This can be done on the Visualization Panel by adjusting the Signal Power limits. NOTE SSID grids are displayed as shaded when visualized in the Flat Shaded, Edges On mode (View > Shade > Flat Shaded, Edges On).
Measurement Surveys The following is an example of Expected Legacy Data Rate visualization. Hovering the mouse over the grid vertices displays the data at particular points in the visualization: NOTE Data Rate grids are displayed as shaded if visualized in the Flat Shaded, Edges On mode (View > Shade > Flat Shaded, Edges On). Noise Visualization The Noise visualization mode allows you to view regions where a certain level of noise occurs. The regions are displayed as color coded grids on the drawing.
If the noise is on a channel that will not affect your network, then you can filter the channels - to be considered in the visualization - by selecting or deselecting the appropriate channels. The following example shows a noise visualization. Hovering the mouse over the grid vertices displays the data at particular points in the visualization. This can help you identify the channel which has noise (on it). The first channel listed in the tooltip is the channel with the worst noise at that location.
Measurement Surveys NOTE Noise grids are displayed as shaded if visualized in the Flat Shaded, Edges On mode (View > Shade > Flat Shaded, Edges On). Noise and Verification of Network Operability Noise plays a major role in network reliability and the quality of service. If there is significant noise in a particular region of the network, the quality of service is likely to be worse in that region than in other regions.
. Channel Width Configuration Visualization The Channel Width Configuration visualization allows you to view the channel width that the client is able to use while communicating with the best serving AP. All 802.11 A/B/G APs can transmit/receive in a 20 MHz channel width while 802.11 N APs have the capacity to transmit/receive in 20 MHz channel width only or both 20/40 MHz channel width (depending upon its configuration).
Measurement Surveys Channel Width Performance The Channel Width Performance visualization allows the user to view the degree to which a client is able to consume the channel width while transmitting and receiving data packets when associated with an AP. You can use this visualization to verify whether clients associating and transmitting/receiving data with 802.11 N APs (configurable in 20/40 MHz channel) are able to use the full channel width.
Data Rate Performance This visualization shows the data rates that a client actually uses while transmitting and receiving data packets during its association with an AP. This visualization makes use of available measurement data only when data is being transferred. Thus, to view the heat map, it is mandatory for you to perform measurement surveys. These surveys should be performed in the AP Performance mode using the custom driver by enforcing data transfer between the AP and the client.
Measurement Surveys You can select/deselect the MACs, for which the visualization is to be viewed, using the Association filter from the Filter By drop-down list.
. Verifying Network Coverage On the Visualization panel, there will be a list of all the MAC addresses that were detected in the measurement runs loaded in the drawing. If you select only the MACs in the list that are a part of your network’s infrastructure, then the resulting grid shows the Network Coverage for only your access points. Identifying and Locating Access Points Use the following steps to locate an access point: 1 Select one of the MACs in the list on the Visualization panel.
Measurement Surveys Following the above steps will result in a grid coverage being displayed that will pin-point the location of the AP with the MAC you selected. If this MAC is not in your infrastructure, then this process will help you locate unauthorized or rogue APs. Otherwise, it will help you verify the location of an AP that is part of your infrastructure.
Importing Measurement Logfiles If you have measurement data from prior sessions, use the Measurement Survey > Import Measurement Data command to import a Summit WMScanner tab-delimited ASCII file, or other formats from specific measurement receivers, and visualize the data directly within the building drawing.
Measurement Surveys Exporting Measurement Logfiles After you have collected measurement data, you can export measurement data for a select measurement run into an ASCII log file by using the Measurement Survey > Export Measurement Data command. After each measurement run, use File > Save Project to save the measurement data in the drawing file.
Deleting Measurement Data Use the Measurement Survey > Delete Measurement Data command to remove measurement data from the current drawing file. The Measurement Run Delete dialog box appears: Select the measurement run from the list that you want to remove from the drawing. Next, press OK to have the measurement data erased from the drawing.
Measurement Surveys Access Point Associations Summit WMScanner utilizes a site-specific model of the measurement environment to associate measurements with a location based upon a 3D X, Y, Z-based coordinate system. Associating with an access point is necessary if you choose to optimize your WLAN plan.
the field. This information will then be carried over when bringing measurement data back to your design product. The fundamental idea of access point association is that in order to compare measured values to predicted values, the software needs to know which virtual transmitter in the drawing produced the measured values.
Measurement Surveys Display Measurement Data After recording measurements, you can display or hide both text and graphical markers on the building drawing by using the Measurement Survey > Display Measurement Data command.
Text Display To display measurement data as text in the drawing, click Measurement Survey > Display Measurement Data > Text Display. Choose the measurement run you wish to display form the drop-down box and click Next.
Measurement Surveys Set Text Height To control the height of text markers, click Measurement Survey > Display Measurement Data > Set Text Height. This will modify the size of the measurement data text in the drawing. This value can be set in feet or meters. Graphical Display Summit WMScanner can also display measurement data as graphical markers in the drawing. These markers indicate measured values using both color and height.
From the Graphical Measurement Display dialog box, you can select the measurement data you wish to display. Select one or more measurement runs from the list and choose the data value you would like to display from the pull down list. There are many options for the pull down data display, but not all of them will apply to your measurement data. If you select measurement information that is not included in your measurement runs, nothing will be displayed in the drawing.
Measurement Surveys The following example shows a measurement session with Graphical Markers enabled: 128 Summit WMScanner Users Guide
The following example shows a measurement session with Text Markers enabled: Summit WMScanner Users Guide 129
Measurement Surveys Show All Markers To show the display of all measurement text in the drawing, click Measurement Survey > Display Measurement Data > Show All Markers. Reposition and Scale Selecting the Measurement Survey > Display Measurement Data > Reposition and Scale command allows you to move existing measurement points in the drawing. You have the option of relocating individual measurement points or adjusting the scale of an entire measurement run.
Configuration Placement Selection Access Point Placement and Configuration Select Access Points · Select Access Points · Select Building Floor Place Access Points · Place Access Points · View Placed Hardware Configure Access Points · Edit Access Points · Configure Air Interface Standards and General Settings Access Point Placement Selecting Equipment > Place Access Point displays the Place Access Point dialog box.
Measurement Surveys To place hardware in the drawing, double left click the hardware description in the Place Access Point dialog box and then left click at the location in the drawing where you would like the access point placed. If the access point you are placing has antenna’s that are attached via cables, then click again in the drawing to specify the location of the antenna relative to the access point. You may continue to place multiple access points by clicking in the drawing again.
To exit manual placement, press the ESC key, which will return you to the Place Access Point dialog box. The example on the next page shows the result of manual access point placement. Note that when you place the mouse cursor over an access point or right-click, a tool tip window provides details about the access point hardware: Once you are satisfied with access point placement, you are ready to configure the channel and power settings.
Measurement Surveys Edit/Remove Access Point The Equipment > Edit/Remove Access Point command allows you to edit, remove, move, or copy any access point in the drawing. The Edit/Remove Access Point dialog box shows a list of every access point in the drawing, a description of the access point, its floor location, air interface standard, channel number, and transmit power.
● Copy — To copy an access point, select it from the list and press the Copy button. You may then click on the drawing to place a copy of the access point the same way you use the Place Access Point command. Press the ESC key to return to the Edit/Remove Access Point dialog box. You may copy an access point to another floor in the drawing by first changing to that floor.
Measurement Surveys ● 136 The Access Point Power tab allows for the configuration of the transmit powers and frequencies of an access point.
The transmit power of an access point is configured via two fields: Input (mW) power, and Gain. The sum (dB terms) or product (absolute Watt terms) of the Input power and the Gain is displayed as the Tx Power. The Tx Power is the signal power that is supplied to the distribution system, e.g. to the cable or antenna attached to the access point.
Measurement Surveys If you select the 11n air interface standard from the View Settings for list, the Operational Mode drop down and the Use Short Guard Interval check box appears in the Performance tab. 138 ● Operational Mode: This option allows you to select any one of the two operational modes - HT Mixed and HT Mixed 40MHz. To make the AP operate on a 20 Mhz channel, select HT Mixed mode or select the HT Mixed 40 MHz mode to make the AP operate on a 40 MHz channel.
● Access Point Hardware Tab - The Access Point Hardware tab enables you to specify a description of the selected access point. This is only for your reference in distinguishing the transmitter from other transmitters. The access point description may be up to 128 characters: ● Access Point Style Tab - The Access Point Style tab enables you to specify the color, display settings, and size of the marker used to identify the location of the access point on the drawing.
Measurement Surveys ● Access Point Position Tab - The Access Point Position section configures the location of the access point. This enables you to enter the absolute position of the access point on the floor within the building. All coordinates are given relative to the origin (also called the Floor Alignment Point) of the building coordinate system. Access Point Colors Selecting Equipment > View Access Point Colors displays the dialog box.
Move Access Point Selecting Equipment > Move Access Point is a quick way to change the location of an access point which has already been configured. .
Measurement Surveys From the Move Access Point dialog box, select the access point that you wish to move and click Move. Only access points on the current floor may be moved with this command. To move access points to a different floor, use the Move command on the Edit/Remove Access Point dialog box. Your pointer will take on the appearance of the access point that you selected from the list. Move the Access Point to the desired location and click to place it.
Select the access point you want to copy from the Copy Access Point dialog box and then press the Copy button. Click in the drawing to specify the location where you want the access point copied to. Continue clicking to make additional copies, or end the operation by right-clicking or by pressing the ESC key. This returns you to the Copy Access Point dialog box, then click Finished.
Measurement Surveys Network Controllers This section describes the tasks involved in controller placement. Placing Controllers Selecting Equipment > Wireless LAN Controller > Place Wireless LAN Controller displays the Place WLAN Controller dialog box. This dialog box allows you to directly place equipment at a desired location in the drawing by clicking in the preferred location.
To place a controller in the drawing, double left click the hardware description in the Place WLAN Controller dialog box and then left click at the location in the drawing where you would like the device placed. You may continue to place multiple devices by clicking in the drawing again. To exit placement, press the ESC key, which will return you to the Place WLAN Controller dialog box. The following example shows the result of the manual placement.
Measurement Surveys The Edit/Remove WLAN Controller dialog box shows a list of every controller in the drawing. The following options are available from the Edit/Remove WLAN Controller dialog box: ● Edit - The Edit button allows you to configure a controller. See “Edit Controller” on page 146. ● Move - The Move button allows you to move a controller from a previous location to a new point in the drawing where you click. ● Remove - The Remove button permanently removes the controller from the drawing.
Within a drawing file, all the controllers must have a unique name. That is, the name entered in the Name Edit Box cannot be used for any other controller within the drawing. If you accidentally enter a duplicate name in the box, Summit WMScanner will display a warning message. Note that the MAC Address field must be entered correctly if you plan to export your design to WMS.
Measurement Surveys Placing Sensors Sensors are RF detectors used in a wireless network designs to monitor RF activity in your network environment. This feature is a key enabler for wireless asset tracking. Summit WMScanner allows you to place sensors within your building drawing.
During sensor placement, your mouse cursor takes on the appearance of a sensor. Click on the areas in your drawing where you want sensors placed. When finished, right-click or press the ESC button. Editing/Removing Sensors After manual sensor placement, you can edit and remove sensors from your building drawing by selecting Equipment > Sensor > Edit/Remove Sensor. The Edit/Remove Sensor dialog box displays.
Measurement Surveys Choose the sensor you wish to remove, then select Remove Sensor. Double click on a sensor to edit its name, location, or sensor height. You can also toggle the sensor display on or off by selecting the Show Network Sensors on drawing checkbox. Click Done when you are finished.
Moving Sensors The Move Sensor command is a quick way to change the location of a sensor which has already been placed. To do this, select Equipment > Sensor > Move Sensor. The Move Sensor dialog box displays. From the Move Sensor dialog box, select the sensor that you wish to move and click Move. Your pointer will take on the appearance of the sensor that you selected from the list. Move the sensor to the desired location and left-click to place it.
Measurement Surveys Select the sensor you want to copy from the Copy Sensor dialog box and then press the Copy button. Click in the drawing to specify the location you want the sensor copied to. You may also copy multiple sensors simultaneously by selecting more than one sensor before clicking Copy. Press the ESC key to return to the Copy Sensor dialog box, then click Finished. Managing RFID Devices RFID devices are used to read RFID tags and capture 1D and 2D bar codes and images.
Placing RFID Summit WMScanner allows you to place RFID devices within your building drawing. To do this, select Equipment > RFID > Place RFID. The Place RFID dialog box lists the RFID readers supported by Summit WMScanner, along with the max antenna limit. To place a RFID reader in a drawing, select (highlight) a RFID reader from within the Model Field and click the Place RFID button. Continue to place multiple RFID readers by clicking in the drawing again.
Measurement Surveys ● XR440 ● XP480 ● XR450 ● MC 9090G The following example shows the result of manual RFID reader placement. The name of the RFID reader appears in the location placed. When finished, Right-Click or Press the ESC button. Editing/Removing RFID Devices Summit WMScanner allows you to edit, move, copy or remove RFID readers from your building drawing by selecting Equipment > RFID > Edit/Remove RFID.
The following options are available in the Edit/Remove RFID dialog box: ● Edit – the edit option allows you to edit an individual RFID’s name, description, IP address, MAC address, floor, height of floor, x-coordinate, y- coordinate, and marker size. You can also double-click any field of the RFID row to bring up the Edit RFID dialog box. This Edit RFID dialog box allows you to edit the antenna associated with each RFID. See “Editing RFID” on page 155 for more details.
Measurement Surveys ● The Name field: Within a drawing file, all RFID readers must have a unique name. That is, the name entered in the Name Edit Dialog Box cannot be used for any other RFID reader within the drawing. If you accidentally enter a duplicate name in the box, Summit WMScanner displays a warning message. ● The Antenna Button: This option allows you to edit and configure the antenna associated with the RFID reader.
Adding/Editing the Antenna Clicking on the Antenna button on the Edit RFID dialog box displays the Antenna Association dialog box. This allows you to add a new antenna, and edit, remove, move the existing antennas. This dialog box displays the RFID information such as the model of RFID reader and the maximum number of antennas that can be associated with the RFID reader.
Measurement Surveys ● Remove: To remove an antenna, select the antenna and then click the remove button. To remove multiple antennas, press the CTRL key and select multiple antennas and then click the Remove button. ● Move: To move an antenna, select the antenna and then click at the location in the drawing where you want the antenna to be placed. Once you have finished the editing of the antenna, you can click the Done button to go back to the Edit RFID dialog box.
Selecting the Place Reference-Tag command displays the following dialog box: The Place Reference-Tag dialog box allows you to place the reference-tag of your choice - active tag or passive tag. ● Active-Tags: These are WiFi tags whose location is provided to the RTLS engine. This information is used to increase the locationing accuracy of any WiFi device. ● Passive-Tags: The location of these tags is tracked and provided to the RTLS.
Measurement Surveys To get back to the Place Reference-Tag dialog box, right-click or press the ESC key. Once you are satisfied with reference-tag placement, you are ready to configure the reference-tag settings. Editing/Removing Reference-Tag The Equipment > Reference-Tag > Edit/Remove Reference-Tag command allows you to edit, remove, move, or copy any reference-tags in the drawing. Selecting Edit/Remove Reference-Tag command from the Equipment > Reference-Tag menu opens the dialog box.
● Edit – the edit option allows you to edit an individual reference tag’s name, description, reference code, floor, height of floor, x-coordinate, y- coordinate, and marker size. You can also double-click the reference-tag to bring up the Edit Reference-Tag dialog box. See more options on “Editing Reference Tag” on page 161. ● Move - the move option allows you to move a reference-tag to a new location on the drawing. To move a reference-tag, select it from the list and then click the Move button.
Measurement Surveys ● The Name Field - Within a drawing file, all reference-tags must have a unique name. That is, the name entered in the name field cannot be used for any other reference-tag within the drawing. If you accidentally enter a duplicate name in the box, Summit WMScanner displays a warning message. ● Hardware Configuration - The hardware configuration section contains the following fields: ■ The Model Field: This field will always be disabled.
● Hardware Position - The hardware position field defines the location of the reference-tag. This enables you to enter the absolute position of the reference-tag on the floor within the building. All coordinates are given relative to the origin (also called the Floor Alignment Point) of the building coordinate system. You can also change the floor on which a reference-tag is deployed using the drop-down menu of the Located on Floors option.
Measurement Surveys 164 Summit WMScanner Users Guide
4 Model Building Summit WMScanner allows you to format your drawings using the Format Building menu. To create the 3D virtual model, you use the Building Wizard utility from within the Format Building menu. Building Wizard provides powerful functionality for modeling a building quickly and easily. The process of modeling a building includes specifying the location, height, and type of materials that make up the building floor plan.
Model Building Using the Building Wizard The Building Wizard is used to convert information about a building or campus floor plan layout into a 3D drawing database. The Building Wizard provides an interface for allowing you to quickly model the different floors of your building and to assemble those floors into a final combined drawing. The Building Wizard is automatically launched after you create a new project workspace.
The Building Wizard contains a list of floors ordered by floor number. A green circle next to a floor specifies that the floor has been properly formatted using the Format Floor Wizard. Selecting the floor causes the Edit Floor button to display. See “Editing Floors in an Existing Building Model” on page 181 for further details. A yellow circle next to a floor specifies that the floor is empty and has not yet been formatted. Selecting the floor causes the Format Floor button to display.
Model Building You will be asked to perform two tasks when you press the Assemble Floors button: (1) Set the legend position and (2) Verify the drawing. These two steps are described in detail in the sections that follow. Drawing Legend. When you assemble the building floors, the Drawing Legend dialog box appears. ● The information you enter in the Drawing Legend dialog box are for your reference and may be filled out with any text that you wish.
Use the buttons to view the building from each of several different angles. Hovering your mouse over a button will give you a tool tip telling you what action the button performs. If you are not satisfied with how your drawing looks, press the No button to return to the Building Floor Manager where you can correct any errors. Otherwise, press the Yes button finish the Assemble Floors process.
Model Building The Floor Formatting Wizard supports the following methods as a starting point for entering information about a floor: ● Leave Floor Empty - This option allows you to defer formatting this floor until a later time. ● Sketch Floor Plan - Use this option to freehand sketch the layout of a building floor plan. Summit WMScanner supports a variety of drawing tools that make this process easy.
your work will be lost). Press the Next button on the wizard to continue to the next step. Use the Back button to repeat previous steps. Detailed instructions on formatting floors by various methods are described in the following sections. Leave Floor Empty Selecting the Leave Floor Empty option on the first dialog box of the Floor Formatting Wizard is the same as pressing the Cancel button on the Floor Formatting Wizard dialog box.
Model Building a Press the Sketch Floor button to begin sketching the floor plan. Pressing the Sketch Floor button will cause you to temporarily leave the Floor Formatting Wizard, but once you are finished sketching the floor plan you will automatically be taken back to where you left off in the Floor Formatting Wizard.
b Press Sketch Floor to display the Draw Partition dialog box. The Draw Partition dialog box enables you to add new partitions to the drawing. This is used most frequently when tracing over an imported raster image of a blueprint, but may also be used to sketch a floor plan from scratch.
Model Building You are prompted to select two locations by left clicking your mouse at two different points in the drawing. After selecting two points, you will then be prompted to enter the physical real world distance between those two points. The check box option to Lock cursor to line endpoints during scale enables you to accurately scale the drawing based on the distance from the end point of one wall to the end point of another wall.
You may check the option to Lock cursor to line endpoints during align before setting the floor alignment point. This option will allow you to set the origin at the end point of a line with exact mouse click precision. 6 Verify the Formatting Steps. ● This final step highlights the formatting that you have performed. Should you wish to redo any of the steps, use the Back button to go back to a previous step.
Model Building Making a Copy of a Floor Select the Make Copy of Floor option on the first dialog of the Floor Formatting Wizard to create an exact copy of an already formatted floor. Select the floor you wish to copy from in the pull down box to the right of the Make a Copy option. Click Next to perform the copy. Importing an Unformatted File Select the Import a Non Formatted file option on the first dialog of the Floor Formatting Wizard to begin the process of importing an unformatted drawing file.
Complete the following steps to properly format an unformatted drawing file: 1 Select File Import Location. Choosing to import an unformatted floor will display an additional option where you must select the location of the unformatted file you wish to import. Use the Browse button to locate your unformatted file on disk, then press Next to proceed to step two. It is a good idea to store your unformatted files in the unformatted folder of your project workspace.
Model Building For more information on processing a CAD drawing file with the Process Unformatted dialog box, see “Format CAD Drawing” on page 192. For more information on processing a raster image with the Draw Partition dialog box, see “Drawing Partitions” on page 196. Once you have completed formatting your drawing file, press the Next button to continue to step four. 4 Scale the Drawing This step requires you scale the floor you have sketched.
5 Set the floor Alignment Point. Step five requires that you set an alignment point for the floor. The alignment point you choose will become the origin for the x-y plane represented by a top-down view of the drawing. The Building Floor Manager uses the origin of the x-y plane to align building floors vertically with the Assemble Floors command. Therefore, it is important that you choose a floor alignment point that is common among all floors that you wish to align.
Model Building 6 Verify Formatting Steps Should you wish to redo any of the steps, use the Back button to go back to a previous step. Otherwise, press the Finish button to complete the formatting of the current floor and return to the Building Floor Manager. Import Preformatted File Select the Import an Already Formatted file option on the first dialog of the Floor Formatting Wizard to import a floor from a file that has already been formatted with Summit WMScanner.
Choosing to import a preformatted floor will display an additional option where you must select the location of the formatted file you wish to import. Use the Browse button to locate your unformatted file on disk, then press Next to proceed to step two. If the file you choose to import has more than one floor, you will be prompted to select which floor number you would like to import from the already formatted file.
Model Building Rescale Floor The Rescale Floor button allows you to set the scale for the floor you have chosen to edit from the Building Floor Manager’s main dialog. The scaling command will resize all entities within the floor. You will be prompted to select two points in the drawing (by clicking with the mouse) and then you will be prompted to enter the actual physical real world distance between the two locations.
Convert Partition Type The Convert Partition Type button lets you convert individual wall entities from one type of partition to another. Select the type of partition you want to convert to using the pull down menu on the Change Partition Type dialog box, then press the Select button. Individual entities must first be selected by leftclicking on them. Then, right-click to change the intended partition type.
Model Building Attach/Detach Raster Image - This command opens the Image dialog. A user can then insert a raster or bit-mapped black and white, 8-bit gray, 8-bit color or 24-bit color image file into the drawing. Users can insert images in a variety of formats, including Bitmap (.bmp), Tagged-Image File Format (.tif), Joint Photographic Experts Group files (.jpg) and Portable Network Graphics (*.png). More than one image can be displayed in any viewport, and the number and size of images is not limited.
7 Click the Attach button and locate the drawing that you wish to import or attach. In the subsequent dialog box, Attach Image, click OK. You will be prompted to enter the (x, y) coordinates of the insertion location of the drawing, as well as the scale of the drawing. The default insertion location is (0,0), and the default value for the scale is 1:1. Windows Metafile (WMF) - Unlike bitmaps or raster files, metafiles contain vector information, which can be scaled and printed without loss of resolution.
Model Building Zones are of the following three types: ● Reader: The logical reader zones are polygons that contain the “read” zones of one or more RFID readers. The RFID tag is mapped to a zone based on the coordinates of the antenna that actually read the tag. ● Locationing: Locationing zones indicate that position locationing services are available within these zones. ● GeoFencing: GeoFence zones indicate that GeoFencing services are available within these zones.
Adding Zones Click the Add button from the Add/Edit/Remove dialog box, to add a zone in the floor plan. This command displays the following dialog box: ● Zone Details ■ Zone Type: Summit WMScanner allows you to place three types of zones in the drawing: Reader, Locationing, GeoFencing. Select the type of zone you want to place from the Zone Type drop down menu.
Model Building ‘ ■ ● Name: This option allows you to name the zone. Draw: This option allows you to draw a zone of the selected type. To draw a zone, click on the drawing and draw a polygon. NOTE Summit WMScanner does not allow two zones of the same type to overlap and displays a warning message. ● Coordinates: This option allows you to edit the x-y coordinates of the recently drawn zone. To edit the x-y coordinates of the recently drawn zone, click any cell/field and then re-enter the coordinates.
This dialog lists the number of zones along with the Zone Name, the Zone Type, the Floor, and the Visibility of the existing zones. ● Edit Zones – This option is same as Add Zone functionality of the drawing. You can redraw the existing zone, or edit the Zone Name, Zone Type, and the Coordinates using this option. ● Remove – this option allows you to remove the existing zones from the drawing. Select the zone you want to remove and then click the Remove button.
Model Building Toggling the Visibility of the Zones Summit WMScanner allows you to toggle the visibility of the zones. You can choose to hide or show the zones with the following two options: ● The Toggle Visibility Option – this option allows you to toggle the visibility of the existing zones, irrespective of the zone type. To toggle the visibility, select the zone and then click the Toggle Visibility button.
This dialog box allows you to define a color for each zone type. It also allows you to edit the existing color of the zone. NOTE By default all zones are displayed in brown color. ● Defining Colors: To define the color of the zone, double-click the value or the color field. This displays the color palette. Select the color of your choice for each zone and then click the OK button. Click the Refresh button from the Add/Edit/Remove dialog box to see the color change in the drawing.
Model Building ● Remove Button: this option allows you to remove the color definition for a particular zone type. Show/Hide All Zones You can choose to view or hide all the zones in the drawing. To toggle the zones from the menu directly, select Format Building > Zone > Show/Hide All Zones. NOTE By default, Summit WMScanner saves the last saved option. If the zones are visible when the file is closed, the zones are visible when you open the file next time.
\ To format an AutoCAD file without using the Building Floor Manager: Select File > Open Drawing to open the AutoCAD file. Next, choose the Format Building > Format CAD Drawing menu command to launch the dialog box. This dialog allows you to manually format the layers in an AutoCAD file. When the Format CAD Drawing command is initiated, some preparatory work will be performed on the open AutoCAD file.
Model Building The main list box in this dialog displays all the layers that are present in the AutoCAD file. Formatting an AutoCAD file involves going through the list of layers and deciding which need to be kept and which ones can be safely removed. Double clicking on a layer causes the other unformatted layers to be hidden so you can see what is on that layer.
As the layers are formatted, they will disappear from the main list box. If you format a layer and it does not disappear from the list box then there are some entities left on that layer that are not lines and can not be processed. You can use the icon to hide and show the formatted building data. This is useful when you cannot distinguish the difference between formatted information and some lines on an unformatted layer.
Model Building Make multiple layers visible Set drawing scale Set origin The Add New Partitions button displays a dialog that allows you to draw completely new walls (see “Drawing Partitions” on page 196). Convert Individual Entities displays a dialog that allows you to select individual lines in the AutoCAD file and convert them to partitions (see “Change Partition” on page 199). This is useful when there is more than one wall type in a given layer.
● View/Edit Partitions - Use the View/Edit Partitions button to examine or change partition attenuation factors. ● Draw Partition - This button allows you to add partitions. To do this, select the desired partition type from the pull-down list in the dialog box and then click the Draw Partition button. The pull-down list displays the eight partition types you choose within Format Building > Current Partition Categories (see “Current Partition Categories” on page 200).
Model Building colored box highlights the end of previously drawn lines when your cursor is nearby. If you click your mouse while the end of a nearby line is highlighted, the software will behave as though you had in fact clicked exactly on the end of the nearby line, thereby creating perfectly joined partitions with no gap. ● Raster Image Fading - When using imported raster images, you must use the partition drawing tool to ‘trace’ over the image where the partitions appear.
Drawing Tips The main Summit WMScanner window has quick access buttons at the bottom of the screen that can aid the process of drawing. The figure that follows shows the ORTHO and OSNAP buttons at the bottom right of the main program screen. The quick access buttons, when left-clicked, toggle the Orthogonal cursor mode and Object Snap on and off. A given mode is on if the command is displayed in bold text. Otherwise, it is off. Settings for each command may be accessed by right clicking on the button.
Model Building This dialog lets you pick a new partition type to assign to one or many partitions on the drawing. After selecting this menu command, you will be prompted to select the new partition type and the floor upon which the changed partitions should appear. Keep in mind that all of the selected objects will be formatted to one of the choices available in this dialog box and all of the objects will be placed on the floor specified in the combo box at the top of the dialog box.
To change a partition category, select a new partition from the drop-down list.
Model Building To change the default color for that category, click on the color square next to a partition category.
Editing the Partition Library Although Summit WMScanner comes with default names for partitions and default colors for partition objects, they are configurable to fit your specific needs. Selecting Format Building > Edit Partition Library opens a dialog which lets you create and edit partition types.
Model Building The Partition Library dialog box assists you in customizing the color, attenuation values, and name of each type of partition. This dialog box also allows you to determine the location of your global partition library file. You can use the text box at the top of the dialog or the Browse button to enter a directory where the software should store the partition information. This can be used to share one copy of the partition library with several installations of Summit WMScanner.
The Partition Library panel includes the following options: ● Global Library Directory - You can use the text box at the top of the dialog box or the Browse button to enter a directory for storing the partition information. This can be used to share one copy of the partition library with several installations of Summit WMScanner, for example, on a centralized file server. ● Add - Allows you to add a new partition category.
Model Building 206 ● Remove - Allows you to delete the selected partition category. Selecting this option opens a prompt dialog confirm the partition category delete. ● Edit - You can change the value for a frequency, add a new frequency, rename the partition category, or change the attenuation value for a frequency. The attenuation value is the reduction in signal strength (dB) for the specified frequency due to the partition material.
● Import - There may be instances when you need to import partition category information from another partition library (.xml file) or a propagation parameter file (.xpt file). Selecting the Import button from the Partition Library dialog opens the Partition Import Filter, which provides you the option to chose the source file by using the Browse button. You can import all the partition information, or import only specific ones by selecting the Remove button to filter out unwanted partitions.
Model Building Scale Drawing Scaling the drawing normally occurs in the Building Wizard via the Format Floor Wizard or Edit Floor dialog box, but it may also be performed from the Format Building > Scale Drawing command. NOTE If you have CAD drawing files with MANY curves, circles (AutoCAD arcs) Extreme Networks recommends you use the Scale Drawing command prior to launching the Building Wizard: open the drawing, scale it, save it, and move to the next floor.
If your building or facility contains multiple floors, change the view to a different floor using several different methods: ● Hotkeys (F5 up one floor, F4 down one floor) ● Through the View > Building Floor menu from the Summit WMScanner toolbar. ● By explicitly using the Goto Floor hotkey (F9), which opens the Goto Floor dialog box. ● By selecting View > Building Floor > Goto Floor, which also opens the Goto Floor dialog box.
Model Building • You can also toggle floor selection by using the Current Floor link in the Legend Data window. Viewing In 3D The best way to get a full perspective of RF obstructions is to view your building model in 3D. Summit WMScanner’s virtual environment models are inherently three dimensional. By default, the ceiling heights you specify are used to determine the vertical height on a given floor.
To return to the 2D view, select View > 3D Views > Top. A building that has been fully formatted and displayed in SW Isometric View with View > Shade > Flat Shaded, Edges On enabled. You can also view your building model in 2D wireframe mode by selecting View > Shade > 2D Wireframe. 2D wireframe makes walls transparent and only displays their outline. This feature is optimal if you want to see through a wall.
Model Building Selecting View > Shade > Hidden makes “hidden lines” invisible while displaying a drawing in 3D. “Hidden lines” refer to lines in a drawing that would not be visible if the objects in the 3D drawing were visualized in real-life, true 3D.
A Customer Support NOTE Services can be purchased from Extreme Networks or through one of its channel partners. If you are an end-user who has purchased service through an Extreme Networks channel partner, please contact your partner first for support. Extreme Networks Technical Assistance Centers (TAC) provide 24x7x365 worldwide coverage. These centers are the focal point of contact for post-sales technical and network-related questions or issues.
Customer Support 214 Summit WMScanner Users Guide