Anritsu User’s Manual Using the Anritsu Spectrum Analyzer with Summit® WMScanner Table of Contents 1. Overview ......................................................................................................................... 2 2. Recording Real-Time Measurement Data With the Anritsu MS2711 HHSA ................ 2 2.1 Configure the Anritsu MS2711 HHSA ..................................................................... 2 2.2 Configure Summit WMScanner................................................
1. Overview This manual explains how to use the Anritsu MS2711 in conjunction with Summit® WMScanner. The Anritsu MS2711 Hand-Held Spectrum Analyzer (HHSA) is a battery-powered, field-operable measurement tool with a real-time serial interface. The Anritsu HHSA is capable of measuring radio signals from 100 kHz to 3 GHz with a measurement range of –90 dBm to +20 dBm. Additionally, the Anritsu HHSA has a power monitor mode whereby an RF detector may be attached to measure specific power levels.
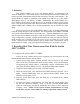
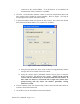
2.2 Configure Summit WMScanner From the Summit WMScanner menu, select “Measurement Survey”, “Record New Data…”, choose the “Anritsu Site Master / MS2711 / MS2711A / S33XB / S33XC” item from the “Select Measurement Mode” box located at the bottom of the dialog, and then click “Next >>”. This will open the Configure Serial Port dialog box shown in Figure 1. Figure 1: Configure Serial Port dialog box Referring to Figure 1, select the appropriate serial port number where the Anritsu HHSA is attached (e.g.
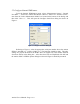
Figure 2: Anritsu MS2711 HHSA Options Dialog Box Referring to Figure 2, follow the steps given below to configure the desired options for collecting data: 1. Select the measurement mode: either Spectrum Analyzer, Channel Number, or Power Monitor. • If spectrum analyzer mode was selected, select the desired sweep options. For more information on how to choose these settings, consult the Anritsu MS2711 HHSA User’s Guide published by the device manufacturer.
connected to the Anritsu HHSA. If an RF detector is not attached, all measurements will be recorded as –100 dBm. 2. Click the “Associate Base Stations” button to associate measurement data with base stations placed within the current building. Refer to Figure 3 for help in navigating the base station association dialog. 3. If spectrum analyzer mode was chosen in Step 2 above, now choose the desired base station association method. Two options are available.
Click “Next” to begin collecting data. Refer to Chapter 3 of the Summit WMScanner manual for more detailed instructions on collecting data. 3. WVC Anritsu MS2711 HHSA Logfiles 3.1 Overview Summit WMScanner positions measurement data based upon an X,Y,Z coordinate system. Since most receiver manufacturers do not support such a data collection scheme, the WVC logfile format was created. The WVC logfile format provides a receiver independent method for collecting and storing measurement data.
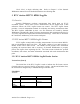
Title Line [Line 1] This next line of the WVC Logfile is the Title Line, and consists of a logfile description, a date of logfile creation, and the drawing name the file was originally created in or exported from, separated by a tab. EXAMPLE: Extreme Networks Summit WMScanner Measurement Logfile, v.12.0.2 10/19/09 Default_Final.dwg Type Logfile Description STRING Range 1 – 128 characters Required Field Example Yes Extreme Networks, Summit WMScanner Measurement Logfile, v.12.0.
EXAMPLE: MODE: Spectrum Analyzer Type Range Required Field Example Field Label STRING TYPE: Collection mode Yes STRING {SPECTRUM ANALYZER, POWER MONITOR} Yes TYPE: SITEMASTER Optional: Base Station Association Information [Line 3] If the mode chosen was Spectrum Analyzer, this line additionally indicates the association mode, either by markers or by averaging. There is a tab placed between the end of “Spectrum Analyzer” and the start of “ASSOCIATIONS”.
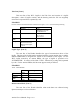
EXAMPLE: MEASUREMENT RUN: RUN1 Type Range Required Field Example Field Label STRING MEASUREMENT RUN: Yes Measurement Data Name STRING 1 to 128 alphanumeric characters Yes MEASUREMENT RUN: RUN1 Measurement Data Comments [Line 5] This line of the Header identifies any notes or user comments associated with the measurement data. It consists of the label “NOTES:” followed by a string field separated by a tab.
EXAMPLE: # ASSOCIATION MARKERS: Type Range Required Field Example 2 Field Label STRING # ASSOCIATION MARKERS: Yes Number of Markers INTEGER 0 to 32767 # ASSOCIATION MARKERS: 2 YES Base Station Associations Header [Line 7] This line of the Header is used as a column label for the base station associations. It always consists of the text “TRANSMITTER” and optionally the text “FREQUENCY (MHz)”.
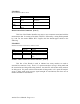
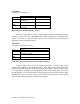
EXAMPLE: Tx1 Tx2 Tx3 2412.3 2420.1 2407.8 Type Range Require d Field Units Exampl e BASE STATION NAME STRING Any valid base station name contained within a drawing. Yes FREQUENCY REAL Floating-point number with precision to 1 decimal place; units are in MHz Yes NONE Tx1 MHz 2412.3 Data Heading Line 1 [Line 11] Line 11 of the WVC Logfile gives the column headings for the data that follows The end of line is designated by a standard carriage return/line feed.
recorded. All frequencies are given in Hz, and the bandwidth settings use an integer index into the list of valid values (see the Anritsu MS2711 user’s manual for more information). For all valid sweeps, 400 data points must be recorded. The sweep data follows the aforementioned settings and parameters. Values are given in dBm and stored as floating-point numbers with three digits following the decimal.
Continued: RESOLUTION BW (OPTIONAL) INTEGER 0-3 VIDEO BW (OPTIONAL) REFERENCE LEVEL (OPTIONAL) INTEGER 0-3 Yes in Spectrum Analyzer mode. No in Power Monitor 1 Yes in Spectrum Analyzer mode. No in Power Monitor 1 INTEGER -120000 to 20000 Thousandths of dBm Yes in Spectrum Analyzer mode. No in Power Monitor -50000 Continued: DB/DIV (OPTIONAL) NUM POINTS (OPTIONAL) INTEGER 2 to 15 INTEGER 1-32767 Yes in Spectrum Analyzer mode. No in Power Monitor 10 Yes in Spectrum Analyzer mode.