Performance Management on Avaya Virtual Services Platform 4000 Series Release 5.1.2 NN46251-701 Issue 09.
© 2013-2017, Avaya, Inc. All Rights Reserved. Notice While reasonable efforts have been made to ensure that the information in this document is complete and accurate at the time of printing, Avaya assumes no liability for any errors. Avaya reserves the right to make changes and corrections to the information in this document without the obligation to notify any person or organization of such changes.
documentation, Hosted Service, and the product provided by Avaya including the selection, arrangement and design of the content is owned either by Avaya or its licensors and is protected by copyright and other intellectual property laws including the sui generis rights relating to the protection of databases. You may not modify, copy, reproduce, republish, upload, post, transmit or distribute in any way any content, in whole or in part, including any code and software unless expressly authorized by Avaya.
Contents Chapter 1: Introduction............................................................................................................ 8 Purpose.................................................................................................................................. 8 Related resources................................................................................................................... 8 Support.......................................................................................
Contents Viewing RSTP statistics................................................................................................... 52 Viewing RSTP port statistics............................................................................................. 53 Viewing MLT statistics..................................................................................................... 54 Viewing vIST statistics.....................................................................................................
Contents Viewing LACP port statistics........................................................................................... 111 Viewing port policer statistics.......................................................................................... 112 Displaying file statistics.................................................................................................. 113 Viewing ACE port statistics.............................................................................................
Contents Displaying RMON control tables..................................................................................... 160 Displaying RMON network host statistics......................................................................... 163 Displaying RMON protocol distribution statistics............................................................... 164 Chapter 9: RMON configuration using EDM....................................................................... 165 Enabling RMON globally...........
Chapter 1: Introduction Purpose This document provides information on features in VSP Operating System Software (VOSS). VOSS runs on the following product families: • Avaya Virtual Services Platform 4000 Series • Avaya Virtual Services Platform 7200 Series • Avaya Virtual Services Platform 8000 Series This document describes conceptual and procedural information about the switch management tools and features that are available to monitor and manage the Avaya Virtual Services Platform 4000 Series.
Related resources Training Ongoing product training is available. For more information or to register, access the website at http://avaya-learning.com/. Viewing Avaya Mentor videos Avaya Mentor videos provide technical content on how to install, configure, and troubleshoot Avaya products. About this task Videos are available on the Avaya Support website, listed under the video document type, and on the Avaya-run channel on YouTube.
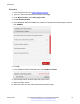
Introduction Procedure 1. In an Internet browser, go to https://support.avaya.com. 2. Type your username and password, and then click Login. 3. Under My Information, select SSO login Profile. 4. Click E-NOTIFICATIONS. 5. In the GENERAL NOTIFICATIONS area, select the required documentation types, and then click UPDATE. 6. Click OK. 7. In the PRODUCT NOTIFICATIONS area, click Add More Products. 8. Scroll through the list, and then select the product name. 9. Select a release version. 10.
Support 11. Click Submit. Support Go to the Avaya Support website at http://support.avaya.com for the most up-to-date documentation, product notices, and knowledge articles. You can also search for release notes, downloads, and resolutions to issues. Use the online service request system to create a service request. Chat with live agents to get answers to questions, or request an agent to connect you to a support team if an issue requires additional expertise.
Introduction 3. In the Search dialog box, select the option In the index named .pdx. 4. Enter a search word or phrase. 5. Select any of the following to narrow your search: • Whole Words Only • Case-Sensitive • Include Bookmarks • Include Comments 6. Click Search. The search results show the number of documents and instances found. You can sort the search results by Relevance Ranking, Date Modified, Filename, or Location. The default is Relevance Ranking.
Chapter 2: New in this document The following section details what is new in Performance Management of Avaya Virtual Services Platform 4000 Series, NN46251-701. Features See the following sections for information about feature changes. Release 5.1.2 The following features are included in Release 5.1.2: IPsec updates This release updates IPsec information.
Chapter 3: Performance management fundamentals Performance management includes the management tools and features that are available to monitor and manage your routing switch. This section provides overviews for Simple Network Management Protocol (SNMP), Remote Monitoring (RMON), and Digital Diagnostic Monitoring (DDM). Switch management tools Use Avaya Command Line Interface or Enterprise Device Manager to access, manage, and monitor the Avaya Virtual Services Platform 4000 Series.
Dynamic network applications Dynamic network applications The remote access services supported on Virtual Services Platform 4000, for example the File Transfer Protocol (FTP), Trivial FTP (TFTP), rlogin, and Telnet, use daemons. These remote access daemons are not enabled by default to enhance security. After you disable a daemon flag, all existing connections abruptly terminate, and the daemon remains idle (accepts no connection requests).
Performance management fundamentals For information about SFPs, SFP+s and QSFPs see Installing Transceivers and Optical components on VSP Operating System Software, NN47227-301. Remote Monitoring This section provides information on Remote Monitoring (RMON). RMON has two versions: • RMON1 • RMON2 Remote Monitoring Remote Monitoring (RMON) is a management information base (MIB) or a group of management objects that you use to obtain or configure values using the Simple Network Management Protocol (SNMP).
Remote Monitoring All alarms share the following characteristics: • A defined upper and lower threshold value. • A corresponding rising and falling event. • An alarm interval or polling period. After you activate alarms, you can: • View the activity in a log and/or a trap. • Create a script directing the system to sound an audible alert at a console. • Create a script directing the system to send an e-mail. • Create a script directing the system to call a pager.
Performance management fundamentals The rising alarm fires the first time outbound traffic, other than spanning tree Bridge Protocol Data Units (BPDUs), occurs. The falling alarm fires after outbound traffic, other than spanning tree, ceases. This process provides the time intervals of any nonbaseline outbound traffic.
Remote Monitoring You can use RMON1 history for the MAC layer in the network. You cannot use RMON1 history for application and network layer protocols. You enable and create histories to establish a time-dependent method to gather RMON1 statistics on a port. The following are the default values for history: • Buckets are gathered at 30-minute intervals. • The number of buckets gathered is 50. You can configure both the time interval and the number of buckets.
Performance management fundamentals RMON 2 Remote Monitoring (RMON) is a management information base (MIB) or a group of management objects that you use to obtain or configure values using the Simple Network Management Protocol (SNMP). Use ACLI or EDM, to globally enable RMON on the system. After you globally enable RMON, you enable monitoring for individual devices on a port-by-port basis.
Remote Monitoring The system only collects statistics for IP packets that pass through the CP. RMON2 does not monitor packets on other interfaces processed on the switch that do not pass through the CP. After you globally enable RMON2, enable monitoring for individual devices. Identify the network hosts for the system to monitor with a manual configuration on the interfaces you want to monitor. The RMON2 feature monitors a list of predefined protocols.
Performance management fundamentals table. The protocol distribution control table is part of this group. The protocol distribution control table is predefined with an entry for the management IP for the switch to represent the network segment where the system collects the statistics. No ACLI or EDM support exists to add or delete entries in this table. Address map MIB The address map MIB maps the network layer IP to the MAC layer address.
Chapter 4: Chassis performance management using EDM Use Enterprise Device Manager (EDM) to configure chassis parameters and to graph chassis statistics on an Avaya Virtual Services Platform 4000 Series. Viewing system performance About this task For information about how to use Key Health Indicators functionality to view system performance, see Fault Management of Avaya Virtual Services Platform 4000 Series, NN46251-702.
Chassis performance management using EDM Name Description RecvAddress IP address for the trap receiver. This is a read-only parameter that contains the IP address configured in the TAddress field in the TargetTable. SrcAddress Source IP address to use when sending traps. This IP address will be inserted into the source IP address field in the UDP trap packet. January 2017 Performance Management on Avaya VSP 4000 Series Comments on this document? infodev@avaya.
Chapter 5: Port performance management using ACLI This section contains procedures to configure port performance management in the ACLI. Viewing DDI module information Before you begin • You must log on to at least Privileged EXEC mode in the ACLI. About this task Perform this procedure to view basic SFP and SFP+ manufacturing information and characteristics, and the current configuration. This command displays information for both DDI and non-DDI SFPs and SFP+s. Procedure 1.
Port performance management using ACLI Variable definitions Use the data in the following table to use the show pluggable-optical-modules basic and show pluggable-optical-modules detail commands. Table 1: Variable definitions Variable Value {slot/port[-slot/port][,...]} Specify a port or a range of ports in the format of slot/port. If you do not specify a port list, the system displays the complete detailed output for each port.
Viewing DDI voltage information Variable definitions Use the data in the following table to use the show pluggable-optical-modules temperature command. Table 2: Variable definitions Variable Value {slot/port[-slot/port][,...]} Specify a port or a range of ports in the format of slot/port. If you do not specify a port list, the system displays the complete detailed output for each port. Viewing DDI voltage information Before you begin • You must log on to at least Privileged EXEC mode in the ACLI.
Port performance management using ACLI Table 3: Variable definitions Variable Value {slot/port[-slot/port][,...]} Identifies the slot and port in one of the following formats: a single slot and port (1/1). January 2017 Performance Management on Avaya VSP 4000 Series Comments on this document? infodev@avaya.
Chapter 6: Port performance management using EDM This section describes port performance management functions on an Avaya Virtual Services Platform 4000 Series. Configuring rate limits About this task Configure the rate limit of broadcast or multicast packets to determine the total bandwidth limit on the port. Procedure 1. On the Device Physical View, select a port or multiple ports. 2. In the navigation tree, expand the following folders: Configuration > Edit > Port. 3. Click General. 4.
Port performance management using EDM Name Description For the Avaya Virtual Services Platform 4000 Series, 1 to 25 sets the limit in a percentage of the total bandwidth on the port from 1–25 percent. On gigabit ports and MDAs, there can be up to a 2 percent difference between the configured and actual rate limiting values. For the Avaya Virtual Services Platform 4000 Series, 1–65535 sets the limit in packets for each second.
Viewing DDI information Name Description Enable Enables or disables limit learning for the port. The default is disable. MacLearning Shows if MAC learning is enabled or disabled for the port. The default is true. Viewing DDI information Before you begin To view the DDI information, you must first set a VRF context view. About this task You can view DDI information (such as module information, temperature, and voltages) for SFPs and SFP+s on the 1 Gb and 10 Gb interface modules. Procedure 1.
Port performance management using EDM Name Description VendorDateCode Indicates the manufacturer date code for the SFP or SFP+. CLEI Indicates the Telcordia register assignment Avaya CLEI code. SupportsDDM Indicates if the SFP or SFP+ supports DDM. Aux1Monitoring Indicates if auxiliary monitoring is implemented for the SFP +. Aux2Monitoring Indicates if auxiliary monitoring is implemented for the SFP +. Wavelength Indicates the wavelength in nm of the SFP or SFP+.
Viewing DDI information Name Description RxPowerHighAlarmThreshold Indicates the high alarm threshold in mW for the Rx power. RxPowerLowAlarmThreshold Indicates the low alarm threshold in mW for the Rx power. RxPowerHighWarningThreshold Indicates the high warning threshold in mW for the Rx power. RxPowerLowWarningThreshold Indicates the high warning threshold in mW for the Rx power. RxPowerStatus Indicates if any Rx power thresholds were exceeded.
Chapter 7: Statistics This chapter provides the procedures for using statistics to help monitor the performance of the switch using Enterprise Device Manager (EDM) and Avaya command line interface (ACLI). Viewing statistics using ACLI This section contains procedures to view statistics in the ACLI. Viewing TCP statistics View TCP statistics to manage network performance.
Viewing statistics using ACLI Table 4: show ip tcp statistics command output Field Description ActiveOpens The count of transitions by TCP connections to the SYN-SENT state from the CLOSED state. PassiveOpens The count of transitions by TCP connections to the SYN-RCVD state from the LISTEN state. AttemptFails The count of transitions by TCP connections to the CLOSED state from either the SYN-SENT state or the SYN-RCVD state, plus the count of transitions to the LISTEN state from the SYN-RCVD state.
Statistics PORT IN_FRAME IN_FRAME IN OUT_FRAME OUT_FRAME NUM UNICAST MULTICAST DISCARD UNICAST MULTICAST -------------------------------------------------------------------------------1/7 1386 0 0 1344 0 1/8 1302 0 0 1344 0 1/9 0 0 0 0 0 Variable definitions Use the data in the following table to use the show routing statistics interface command. Variable Value gigabitethernet Specifies the interface type. {slot/port[-slot/port][,...
Viewing statistics using ACLI Example VSP-4850GTS#show interfaces gigabitEthernet statistics bridging ================================================================================ Port Stats Bridge ================================================================================ PORT IN_FRAME IN_FRAME IN_FRAME OUT_FRAME IN_FRAME OUT_FRAME IN_DISCARD NUM UNICAST MULTICAST BROADCAST xSTP BPDU xSTP BPDU -------------------------------------------------------------------------------1/1 179325 0 0 119310 1793
Statistics Displaying DHCP-relay statistics for specific ports Before you begin • You must log on to at least the Privileged EXEC mode in ACLI. About this task Display individual DHCP-relay statistics for specific ports to manage network performance. Procedure View DHCP-relay statistics for a specific port or VRF. show interfaces GigabitEthernet statistics dhcp-relay [vrf WORD<1-16>] [vrfids WORD<0-255>]|{slot/port[-slot/port][,...
Viewing statistics using ACLI Table 7: show interfaces gigabitethernet statistics dhcp-relay field descriptions Variable Value PORT_NUM Indicates the port number. VRF NAME Identifies the VRF NUMREQUEST Indicates the total number of DHCP requests on this interface NUMREPLY Indicates the total number of DHCP replies on this interface. Displaying DHCP-relay statistics for all interfaces About this task Display DHCP-relay statistics for all interfaces to manage network performance. Procedure 1.
Statistics Table 8: show ip dhcp-relay counters option82 command Heading Description INTERFACE Shows the name of the interface on which you enabled option 82. Shows the port number if the interface is a brouter port or the VLAN number if the interface is a VLAN. FOUND OPT82 Shows the number of packets that the interface received that already had option82 in them. DROP PKT Shows the number of packets the interface dropped because of option 82–related issues.
Viewing statistics using ACLI Procedure 1. Log on to the switch to enter User EXEC mode. 2. View statistics: show ipv6 dhcp-relay counters Note: Use the sys action reset counters command to clear DHCP Relay statistics.
Statistics Example View LACP statistics: Switch:1>enable Switch:1#show interfaces gigabitethernet statistics lacp ================================================================================ Port Stats Lacp ================================================================================ PORT TX RX TX RX TX RX RX RX NUM LACPDU LACPDU MARKERPDU MARKERPDU MARKERRESPPDU MARKERRESPPDU UNKNOWN ILLEGAL -------------------------------------------------------------------------------1/39 0 0 0 0 0 0 0 0 1/40 0 0
Viewing statistics using ACLI Displaying RMON statistics for specific ports Before you begin • You must log on to at least the Privileged EXEC mode in ACLI. About this task Display individual RMON statistics for specific ports to manage network performance. Procedure View statistics for specific ports: show interfaces GigabitEthernet statistics rmon {slot/port[-slot/port] [,...
Statistics Parameter Description PKTS The total number of packets (including bad packets, broadcast packets, and multicast packets) received. MULTICAST The total number of packets received that were directed to a multicast address. This number does not include packets directed to the broadcast address. BROADCAST The total number of packets received that were directed to the broadcast address. This number does not include multicast packets.
Viewing statistics using ACLI show interfaces GigabitEthernet statistics verbose {slot/port[-slot/port] [,...]} Example View statistics for various ports: Switch:1>enable Switch:1#show interfaces gigabitethernet statistics verbose Please widen the terminal for optimal viewing of data.
Statistics Parameter Description IN_BRDCST The count of inbound broadcast packets. OUT_BRDCST The count of outbound broadcast packets. Displaying IS-IS statistics and counters Use the following procedure to display the IS-IS statistics and counters. Procedure 1. Display IS-IS system statistics: show isis statistics 2. Display IS-IS interface counters: show isis int-counters 3. Display IS-IS level 1 control packet counters: show isis int-l1-cntl-pkts Note: The current release uses level 1 IS-IS.
Viewing statistics using ACLI Port1/21 Level 1-2 0 1 0 0 0 0 0 VSP-4850GTS#show isis int-l1-cntl-pkts ================================================================================ ISIS L1 Control Packet counters ================================================================================ IFIDX DIRECTION HELLO LSP CSNP PSNP -------------------------------------------------------------------------------Mlt2 Transmitted 13346 231 2 229 Mlt2 Received 13329 230 1 230 Port1/21 Transmitted 13340 22
Statistics Parameter Description IFIDX Shows the interface index for the Ethernet or MLT interface. LEVEL Shows the level of the IS-IS interface (Level 1 in the current release). AUTH FAILS Shows the number of times authentication has failed per interface. ADJ CHANGES Shows the number of times the adjacencies have changed. INIT FAILS Shows the number of times the adjacency has failed to establish. REJ ADJ Shows the number of times the adjacency was rejected by another router.
Viewing statistics using ACLI 4. Enter the following command to clear statistics associated with a particular ACL, ACE, or ACE type: clear filter acl statistics [<1-2048>] [<1–2000>][qos] [security] Variable definitions Use the information in the following table to use the clear filter acl statistics command. Variable Value 1–2048 Specifies the ACL ID. 1–2000 Specifies the ACE ID. Viewing ACE statistics Before you begin • You must log on to at least the Privileged EXEC mode in ACLI.
Statistics ================================================================================ Acl Default Statistics Table ================================================================================ Acl Id Acl Name Acl Type Acl Sec Acl Sec Acl QOS Acl QOS Packets Bytes Packets Bytes -------------------------------------------------------------------------------1 ACL-1 inVlan 0 0 0 0 2 ACL-2 inVlan 0 0 0 0 Displayed 2 of 2 entries --More-- (q = quit) Switch:1#show filter acl statistics default ==========
Viewing statistics using ACLI Table 13: show filter acl statistics default field descriptions Parameter Description Acl ID Specifies the identifier for the ACL. Acl Name Specifies the name for the ACL. Acl Type Specifies the ACL type. Acl Sec Packets Specifies the ACL secondary packets. Acl Sec Bytes Specifies the ACL secondary bytes. Acl QoS Packets Specifies the ACL QoS packets. Acl QoS Bytes Specifies the ACL QoS bytes.
Statistics Parameter Description MSTP Down Count The number of times the MSTP Module has been disabled. A Trap is generated on the occurrence of this event. Region Config Change Count The number of times the switch detects a Region Configuration Identifier Change. The switch generates a trap on the occurrence of this event. Time since topology change The time (in hundredths of a second) since the TcWhile Timer for any port in this Bridge was nonzero for Common Spanning Tree context.
Viewing statistics using ACLI Parameter Description STP Time since Topology change The time (in hundredths of a second) since the "TcWhile" Timer for any port in this Bridge was non zero for this spanning tree instance. Total number of topology changes The number of times that there have been atleast one non zero "TcWhile" Timer on this Bridge for this spanning tree instance. Viewing RSTP port statistics About this task View RSTP statistics on ports to manage network performance.
Statistics Variable Value {slot/port[-slot/port][,...]} Identifies the slot and port in the following format: a single slot and port/ports (1/1). Job aid The following table describes output for the show spanning-tree rstp port statistics command. Table 16: show spanning-tree rstp port statistics field descriptions Parameter Description RxRstBpduCount The number of RSTP BPDUs received on this port. RxConfigBpduCount The number of configuration BPDUs received on this port.
Viewing statistics using ACLI Example VSP-4850GTS#show mlt stats ================================================================================ Mlt Interface ================================================================================ ID IN-OCTETS OUT-OCTETS IN-UNICST OUT-UNICST -------------------------------------------------------------------------------1 256676904 183670662 1397 456 2 61737348498 61584347982 1450182 1490619 4 229256124 47472778 0 0 100 251678170 32332107 0 0 ID IN-MULTICST OUT-MU
Statistics Viewing vIST statistics View virtual IST (vIST) statistics for the switch. Procedure 1. Enter Privileged EXEC mode: enable 2. Display the vIST statistics: show virtual-ist stat 3.
Viewing statistics using ACLI Update Response Recv : Transaction Que HiWaterM : Poll Count Hi Water Mark : 0 0 0 Job aid The following table describes the output for the show virtual-ist stat command. Table 18: show virtual-ist stat field descriptions Parameter Description Ist Down The count of how many sessions between the two peering switches went down since last boot. Hello Sent The count of transmitted hello messages. Hello Recv The count of received hello messages.
Statistics Parameter Description Request MAC Table Recv The count of received MAC table request messages. Unknown Msg Type Recv The count of received unknown message type messages. Mlt Table Sync Req Sent The count of transmitted MLT table sync request messages. Mlt Table Sync Req Recv The count of received MLT table sync request messages. Mlt Table Sync Sent The count of transmitted MLT table sync messages. Mlt Table Sync Recv The count of received MLT table sync messages.
Viewing statistics using ACLI NumRxDropPkt: NumRxBadPkt: NumSpfRun: LastSpfRun: LsdbTblSize: NumBadLsReq: NumSeqMismatch: NumOspfAdjacencies: 0 0 42 0 day(s), 02:44:32 45 0 0 7 Job aid The following table explains the output of the show ipv6 ospf statistics command. Field Description NumTxPkt Shows the count of sent packets. NumRxPkt Shows the count of received packets. NumTxDropPkt Shows the count of sent, dropped packets. NumRxDropPkt Shows the count of received, dropped packets.
Statistics non-eap-pwd-fmt padding : disabled -------------------------------------------------------------------------------- Showing EAPoL authenticator statistics Display the authenticator statistics to manage network performance. Note: Use the clear-stats command to clear EAP or NEAP statistics. Procedure 1. Log on to the switch to enter User EXEC mode. 2. Display the authenticator statistics: show eapol auth-stats interface [gigabitEthernet [{slot/port[/subport][-slot/port[/sub-port]][,...
Viewing statistics using ACLI Job aid The following table describes the output for the show eapol auth-stats interface command. Table 19: show eapol auth-stats interface field descriptions Parameter Description PORT Displays the port number in use. EAP RCVD Displays the number of EAPoL-EAP frames received by this Authenticator. AUTH-EAP TX Displays the number of EAPoL-EAP frames transmitted by the Authenticator. START RCVD Displays the number of EAPoL start frames received by this Authenticator.
Statistics PORT MAC SESSION AUTHENTIC SESSION TERMINATE USER NUM ID METHOD TIME CAUSE NAME -------------------------------------------------------------------------------1/1 18:a9:05:b1:04:ce cb000000 remote-server 0 day(s), 05:58:16 not-terminated sachin 1/4 00:00:00:00:00:01 cb000002 remote-server 0 day(s), 05:48:01 not-terminated 000000000001 -------------------------------------------------------------------------------- Variable definitions Use the data in the following table to use the show eapol se
Viewing statistics using ACLI Procedure 1. Log on to the switch to enter User EXEC mode. 2. Display the non-EAPoL MAC information: show eapol multihost non-eap-mac status [vlan <1-4059>][{slot/port[/ sub-port][-slot/port[/sub-port]][,...
Statistics Viewing port EAPoL operation statistics Use this procedure to view port EAPoL operation statistics. Note: Use the clear-stats command to clear EAP/NEAP statistics. Procedure 1. Log on to the switch to enter User EXEC mode. 2. Display the port EAPoL operation statistics information: show eapol status interface [gigabitEthernet [{slot/port[/sub-port] [-slot/port[/sub-port]][,...
Viewing statistics using ACLI Parameter Description PAE STATUS Indicates the current state of the authenticator PAE state machine. VLAN ID Indicates the VLAN assigned to the client. Showing RADIUS server statistics Before you begin • To clear statistics, you must log on to at least the Privileged EXEC mode in the ACLI. About this task You cannot collect the following network statistics from a console port: the number of input and output packets, and the number of input and output bytes.
Statistics Pending Requests Acct On Requests Acct Off Requests Acct Start Requests Acct Stop Requests Acct Interim Requests Acct Bad Responses Acct Pending Requests Acct Client Retries Access Challanges Round-trip Time Nas Ip Address : : : : : : : : : : : : 0 0 0 0 0 0 0 0 0 0 47.17.10.32 --More-- (q = quit) Job aid The following table shows the field descriptions for the show radius-server statistics command output.
Viewing statistics using ACLI Viewing RMON statistics About this task View RMON statistics to manage network performance.
Statistics show ipv6 ipsec statistics system 3. Display statistics for IPsec for an Ethernet interface: show ipv6 ipsec statistics gigabitethernet {slot/port[/sub-port][slot/port[/sub-port]][,...]} 4. Display statistics for IPsec for an VLAN interface: show ipv6 ipsec statistics vlan <1–4059> 5. Display statistics for IPsec on the loopback interface: show ipsec statistics loopback <1–256> 6.
Viewing statistics using ACLI Out3DESCBCs OutAESCBCs OutAESCTRs OutInAnyNullEncrypt = = = = 167772160 167772160 167772160 167772160 Switch:1(config)#show ipv6 ipsec statistics gigabitethernet 1/13 ================================================================================ Ipsec Port Stats ================================================================================ Ifindex = 204 InSuccesses = 0 InSPViolations = 0 InNotEnoughMemories = 0 InAHESPReplays = 0 InAHFailures = 0 InESPFailures = 0 OutSu
Statistics Variable definitions Use the data in the following table to use the show ipv6 ipsec statistics command. Variable Value {slot/port[/sub-port][-slot/port[/sub-port]][,...]} Identifies the slot and port in one of the following formats: a single slot and port (slot/port), a range of slots and ports (slot/port-slot/port), or a series of slots and ports (slot/port,slot/port,slot/port).
Viewing statistics using ACLI Parameter Description OutSPViolations Specifies the number of egress packets IPsec discards since boot time because a security policy violation occurs. OutNotEnoughMemories Specifies the number of egress packets IPsec discards since boot time because not enough memory is available since boot time. generalError Specifies a general error. InAHSuccesses Specifies the number of ingress packets IPsec carries because the AH authentication succeeds.
Statistics Parameter Description InAESCTRs Specifies the number of inbound AES CTR occurrences since boot time. InAnyNullEncrypt Specifies the number of inbound null occurrences since boot time. Used for debugging purposes. OutMD5Hmacs Specifies the number of outbound HMAC MD5 occurrences since boot time. OutSHA1Hmacs Specifies the number of outbound HMAC SHA1 occurrences since boot time. OutAESXCBCs Specifies the number of outbound AES XCBC MAC occurrences since boot time.
Viewing statistics using ACLI Parameter Description InESPFailures Specifies the number of ingress packets IPsec discards since boot time because the ESP authentication check fails. OutSuccesses Specifies the number of egress packets IPsec successfully carries since boot time. OutSPViolations Specifies the number of egress packets IPsec discards since boot time because a security policy violation occurs.
Statistics Displaying IPsec statistics Use the following procedure to display IPsec statistics. Procedure 1. Enter Privileged EXEC mode: enable 2. Display IPsec statistics on an Ethernet interface: show ipsec statistics gigabitethernet {slot/port[/sub-port][slot/ port[/sub-port]][,...]} 3. Display the IPsec statistics on a VLAN interface: show ipsec statistics vlan <1-4059> 4. Display the system global IPsec statistics: show ipsec statistics system 5.
Viewing statistics using ACLI ======================================================================================= Ifindex = 2050 InSuccesses = 0 InSPViolations = 0 InNotEnoughMemories = 0 InAHESPReplays = 0 InESPReplays = 0 InAHFailures = 0 InESPFailures = 0 OutSuccesses = 0 OutSPViolations = 0 OutNotEnoughMemories = 0 generalError = 0 Displaying the system global IPsec statistics: Switch:1>enable Switch:1#show ipsec statistics system ===================================================================
Statistics Displaying IPsec statistics on a management interface: Switch:1>enable Switch:1#show ipsec statistics mgmtethernet mgmt ======================================================================================= Ipsec Port Stats ======================================================================================= Ifindex = 64 InSuccesses = 0 InSPViolations = 0 InNotEnoughMemories = 0 InAHESPReplays = 0 InESPReplays = 0 InAHFailures = 0 InESPFailures = 0 OutSuccesses = 0 OutSPViolations = 0 OutNotE
Viewing statistics using ACLI Variable Value VLAN IDs 1 to 4059 are configurable. The system reserves VLAN IDs 4060 to 4094 for internal use. VLAN ID 1 is the default VLAN and you cannot create or delete VLAN ID 1. mgmtethernet mgmt Identifies the interface as a management interface. loopback <1–256> Specifies the loopback ID in the range of 1 to 256. Job aid The following table describes the fields in the output for the show ipsec statistics command.
Statistics Parameter Description InAHSuccesses The total number of inbound packets carried by IPsec if AH authentication succeeded since boot time for this interface. OutAHSuccesses The total number of outbound packets carried by IPsec if AH authentication succeeded since boot time for this interface. InESPSuccesses The total number of inbound packets carried by IPsec if ESP authentication succeeded since boot time for this interface.
Viewing statistics using ACLI Parameter Description InAESCTRs The total number of outbound DES CBC occurrences since boot time for this interface. InAnyNullEncrypt Total number of inbound packets without any encryption algorithm for this interface. OutMD5Hmacs The total number of outbound HMAC MD5 occurrences since boot time for this interface. OutSHA1Hmacs The total number of outbound HMAC SHA1 occurrences since boot time for this interface.
Statistics IcmpInPktTooBigs : 0 IcmpInEchos : 0 IcmpInEchoReplies : 0 IcmpInRouterSolicits : 0 IcmpInRouterAdverts : 0 InNeighborSolicits : 0 InNbrAdverts : 0 IcmpInRedirects : 0 IcmpInGroupMembQueries : 0 IcmpInGroupMembResponses : 0 Variable definitions Use the data in the following table to use the show ipv6 interface icmpstatistics command Variable Value <1-4059> Shows ICMP statistics for the specific interface index.
Viewing statistics using ACLI Variable definitions Use the information in the following table to use the clear ipv6 statistics command. Variable Value vlan<1-4059> Specifies the VLAN ID in the range of 1 to 4059. VLAN IDs 1 to 4059 are configurable. The system reserves VLAN IDs 4060 to 4094 for internal use. VLAN ID 1 is the default VLAN and you cannot create or delete VLAN ID 1. gigabitethernet {slot/port[/sub-port]} Identifies a single slot and port.
Statistics Variable definitions Use the data in the following table to use the show ipv6 vrrp statistics command. Variable Value link-local WORD<0–127> Shows statistics for a specific link-local address. vrid <1–255> Shows statistics for a specific VRID. Job aid The following table describes the output for the show ipv6 vrrp statistics command.
Viewing statistics using ACLI Heading Description PRIO_0_RCV Shows the total number of VRRP packets received by the virtual router with a priority of 0. Discontinuities in the value of this counter can occur at re-initialization of the management system, and at other times as indicated by the value of DiscontinuityTime. PRIO_0_SENT Shows the total number of VRRP packets sent by the virtual router with a priority of 0.
Statistics Example View IPv6 statistics on an interface: Switch:1>enable Switch:1#show ipv6 interface statistics ================================================================================ Interface Stats ================================================================================ If Stats for mgmt, IfIndex = 64 InReceives: 404 InHdrErrors: 0 InTooBigErrors : 0 InNoRoutes : 0 InAddrErrors : 0 InUnknownProtos : 0 InTruncatedPkts : 0 InDiscards : 0 InDelivers : 404 OutForwDatagrams : 0 OutRequests :
Viewing statistics using ACLI show ip vrrp statistics version <2–3> 3. Enter the following command to view VRRP statistics for the specified VRF: show ip vrrp statistics vrf WORD<1–16> version <2–3> 4.
Statistics Displaying VLACP statistics for specific ports Display VLACP statistics for specific ports to manage network performance. About this task You can enable sequence numbers for each VLACPDU to assist in monitoring performance. The switch counts mismatched PDU sequence numbers to determine packet loss information. By default, sequence numbers are enabled. You can use the show commands from Privileged EXEC mode but must enter Global Configuration mode to enable or disable the sequence numbers.
Viewing statistics using EDM Vlacp: enable Vlacp Sequence Number: enable Switch:1(config)#show interfaces gigabitEthernet statistics vlacp ================================================================================ Port Stats Vlacp ================================================================================ PORT TX RX SEQNUM NUM VLACPDU VLACPDU MISMATCH -------------------------------------------------------------------------------8/1 106058 105554 0 12/11 15 12 0 12/23 0 0 0 Variable definitions
Statistics Important: The Clear Counters function does not affect the AbsoluteValue counter for the device. The Clear Counters function clears all cached data in EDM except AbsoluteValue. Perform the following steps to reset AbsoluteValues. Procedure 1. In the Device Physical View tab, select the Device. 2. In the navigation tree, expand the following folders: Configuration > Edit. 3. Click Chassis. 4. Click the System tab. 5. In ActionGroup1, select resetCounters, and then click Apply.
Viewing statistics using EDM Graphing port statistics You can create graphs for many port statistics to generate a visual representation of your data. Procedure 1. In the Device Physical View, select the port or ports for which you want to create a graph. 2. Perform the following steps: • Right-click a port or multiple ports. On the shortcut menu, choose Graph. • In the navigation tree, expand the following folders: Configuration > Graph, and then click Port. 3.
Statistics Name Description Only the AbsoluteValue column is valid in the System tab. All other columns display as N/A because they are percentages and not actual memory counters. DramFree The amount in kilobytes of free DRAM. CpuUtil Percentage of CPU utilization. Viewing chassis SNMP statistics View chassis SNMP statistics to monitor network performance. Procedure 1. In the Device Physical View, select the chassis. 2. In the navigation tree, expand the following folders: Configuration > Graph. 3.
Viewing statistics using EDM Name Description OutTooBigs The number of SNMP PDUs the SNMP protocol generates for which the value of the error-status field is tooBig. OutNoSuchNames The number of SNMP PDUs the SNMP protocol generates for which the value of the error-status field is noSuchName. OutBadValues The number of SNMP PDUs the SNMP protocol generates for which the value of the error-status field is badValue.
Statistics IP field descriptions The following table describes parameters on the IP tab. Name Description InReceives The number of input datagrams received from interfaces, including those received in error. InHdrErrors The number of input datagrams discarded due to errors in the IP headers, including bad checksums, version number mismatch, other format errors, time-to-live exceeded, errors discovered in processing their IP options.
Viewing statistics using EDM Name Description FragFails The number of IP datagrams that were discarded because they needed to be fragmented at this entity but can not be, for example, because the Don't Fragment flags were set. FragCreates The number of IP datagram fragments that were generated as a result of fragmentation at this entity. ReasmReqds The number of IP fragments received that needed to be reassembled at this entity. ReasmOKs The number of IP datagrams successfully reassembled.
Statistics Viewing chassis ICMP Out statistics View chassis ICMP Out statistics to monitor network performance. Procedure 1. In the Device Physical View, select the chassis. 2. In the navigation tree, expand the following folders: Configuration > Graph. 3. Click Chassis. 4. Click the ICMP Out tab. ICMP Out field descriptions The following table describes parameters on the ICMP Out tab. Name Description SrcQuenchs The number of ICMP Source Quench messages sent.
Viewing statistics using EDM ICMP stats field descriptions Use the data in the following table to use the ICMP Statistics tab. Name Description InMsgs Specifies the total number of ICMP messages which the entity received. Note: This counter includes all those counted by icmpInErrors. InErrors Specifies the number of ICMP messages which the entity received but determined as having ICMPspecific errors (bad ICMP checksums, bad length, etc.).
Statistics Name Description InGroupMembResponses Specifies the number of ICPv6 Group Membership Response messages received by the interface. InGroupMembReductions Specifies the number of ICMPv6 Group Membership Reduction messages received by the interface. OutMsgs Specifies the total number of ICMP messages which this interface attempted to send. Note that this counter includes all those counted by icmpOutErrors.
Viewing statistics using EDM Name Description OutGroupMembQueries Specifies the number of ICMPv6 Group Membership Query messages sent. OutGroupMembResponses Specifies the number of ICMPv6 Group Membership Response messages sent. OutGroupMembReductions Specifies the number of ICMPv6 Group Membership Reduction messages sent. Viewing chassis TCP statistics View TCP statistics to monitor network performance. Procedure 1. In the Device Physical View, select the chassis. 2.
Statistics Name Description InErrs The number of segments received in error (for example, bad TCP checksums). OutRsts The number of TCP segments sent containing the RST flag. HCInSegs The number of segments received, including those received in error. This count includes segments received on currently established connections. This object is the 64-bit equivalent of InSegs.
Viewing statistics using EDM Name Description Discontinuities in the value of this counter can occur at reinitialization of the management system, and at other times as indicated by discontinuities in the value of sysUpTime. InErrors The number of received UDP datagrams that were not delivered for reasons other than the lack of an application at the destination port.
Statistics Name Description InOctets Specifies the number of octets received on the interface, including framing characters. OutOctets Specifies the number of octets transmitted from the interface, including framing characters. InUcastPkts Specifies the number of packets delivered by this sublayer to a higher sublayer that were not addressed to a multicast or broadcast address at this sublayer.
Viewing statistics using EDM Name Description HCOutPfcPkts Specifies the total number of Priority Flow Control (PFC) packets transmitted by this interface. HCInFlowCtrlPkts Specifies the number of flow control packets received by this interface. HCOutFlowCtrlPkts Specifies the number of flow control packets transmitted by this interface. NumStateTransition Specifies the number of times the port went in and out of service; the number of state transitions from up to down.
Statistics Name Description corresponding instance of either the LateCollisions object, the ExcessiveCollisions object, or the CarrierSenseErrors object. The precise meaning of the count represented by an instance of this object is implementation-specific. In particular, an instance of this object can represent a count of transmission errors on a particular interface that are not otherwise counted.
Viewing statistics using EDM Name Description collision. A frame that is counted by an instance of this object is also counted by the corresponding instance of either the UcastPkts, MulticastPkts, or BroadcastPkts objects and is not counted by the corresponding instance of the SingleCollisionFrames object. LateCollisions Specifies the number of times that a collision is detected on a particular interface later than 512 bit-times into the transmission of a packet; 512 corresponds to 51.
Statistics Viewing port spanning tree statistics View port spanning tree statistics to manage network performance. Procedure 1. In the Device Physical View, select a port. 2. In the navigation tree, expand the following folders: Configuration > Graph. 3. Click Port. 4. Click the Spanning Tree tab. Spanning Tree field descriptions The following table describes parameters on the Spanning Tree tab. Name Description InConfigBpdus The number of Config BPDUs received.
Viewing statistics using EDM Name Description OutUnicastFrames The number of outgoing unicast frames routed. OutMulticastFrames The number of outgoing multicast frames routed. Viewing IPv6 statistics for an interface View IPv6 statistics to view information about the IPv6 datagrams on an interface. Procedure 1. In the navigation pane, expand the following folders: Configuration > IPv6. 2. Click IPv6. 3. Click the Interfaces tab. 4. Select an interface. 5. Click IfStats. 6.
Statistics Name Description datagrams discarded because the destination address was not a local address. InUnknownProtos Shows the number of locally-addressed datagrams received successfully but discarded because of an unknown or unsupported protocol. This counter is incremented at the interface to which these datagrams were addressed, which is not always the input interface for some of the datagrams.
Viewing statistics using EDM Name Description OutFragFails Shows the number of IPv6 datagrams that have been discarded because they needed to be fragmented at this output interface but could not be. OutFragCreates Shows the number of output datagram fragments that have been generated as a result of fragmentation at this output interface. ReasmReqds Shows the number of IPv6 fragments received which needed to be reassembled at this interface.
Statistics Name Description IfIndex Identifies the physical interface. AgentAddr Shows the IP address configured as the relay on this interface. This address is either the IP of the physical interface or the IP of the VRRP address. NumRequests Shows the number of DHCP and BootP requests on this interface. NumReplies Shows the number of DHCP and BootP replies on this interface. Graphing DHCP statistics for a port View DHCP statistics to manage network performance. Procedure 1.
Viewing statistics using EDM 6. Select one or more values. 7. Click the type of graph. DHCP Stats field descriptions Use the data in the following table to use the DHCP Stats tab. Name Description NumRequests The number of DHCP and BootP requests on this interface. NumReplies The number of DHCP and BootP replies on this interface. Viewing IPv6 DHCP Relay statistics for a port Display individual IPv6 DHCP Relay statistics for specific ports to manage network performance.
Statistics Procedure 1. In the navigation tree, expand the following folders: Configuration > VLAN 2. Click VLANs. 3. On the Basic tab, select a VLAN. 4. Click IP. 5. Click the DHCP Relay tab. 6. Click Graph. 7. Select one or more values. 8. Click the type of graph. DHCP Stats field descriptions Use the data in the following table to use the DHCP Stats tab. Name Description NumRequests The number of DHCP and BootP requests on this interface.
Viewing statistics using EDM Name Description FoundOp82 Shows the number of packets that the interface received that already had option82 in them. Dropped Shows the number of packets the interface dropped because of option 82–related issues. These reasons could be that the packet was received from an untrusted source or spoofing was detected. To determine the cause of the drop, you must enable trace on level 170. CircuitId Shows the value inserted in the packets as the circuit ID.
Statistics 5. To change the poll interval, in the toolbar click the Poll Interval box, and then select a new interval. LACP field descriptions Use the data in the following table to view the LACP statistics. Name Description LACPDUsRx The number of valid LACPDU received on this aggregation port. MarkerPDUsRx The number of valid marker PDUs received on this aggregation port. MarkerResponsePDUsRx The number of valid marker response PDUs received on this aggregation port.
Viewing statistics using EDM Name Description TotalBytes Shows the total number of bytes received on the port. YellowBytes Shows the total number of bytes received on the port that were above the committed rate but below the peak rate. RedBytes Shows the total number of bytes received on the port that were above the peak rate. Displaying file statistics Display the amount of memory used and available for onboard flash memory, as well as the number of files. Procedure 1.
Statistics Statistics field descriptions Use the data in the following table to use the Statistics tab. Name Description AclId Specifies the associated ACL index. AceId Specifies the ACE index. MatchCountPkts Specifies a packet count of the matching packets. MatchCountOctets Specifies the number of octets of the matching packets. Viewing ACL statistics About this task Graph statistics for a specific ACL ID to view default statistics. Procedure 1.
Viewing statistics using EDM Name Description MatchGlobalSecurityPkts Shows a security packet count of traffic that matches an ACE rule or hits the default action if count is configured in the ACL global action. MatchGlobalSecurityOctets Shows a security byte count of traffic that matches an ACE rule or hits the default action if count is configured in the ACL global action.
Statistics CIST field descriptions The following table describes parameters on the CIST tab. Name Descriptions ForwardTransitions Specifies the number of times this port has transitioned to the forwarding state. RxMstBpduCount Specifies the number of MSTP BPDUs received on this port. RxRstBpduCount Specifies the number of RSTP BPDUs received on this port. RxConfigBpduCount Specifies the number of configuration BPDUs received on this port.
Viewing statistics using EDM MSTI port stats field descriptions The following table describes parameters on the MSTI Port Stats tab. Name Description ForwardTransitions Specifies the number of times this port has transitioned to the forwarding state for this specific instance. ReceivedBPDUs Specifies the number of BPDUs received by this port for this spanning tree instance. TransmittedBPDUs Specifies the number of BPDUs transmitted on this port for this spanning tree instance.
Statistics Name Description PriorityZeroPktsSent Specifies the number of VRRP packets sent by the virtual router with a priority of 0'. InvalidTypePktsRcvd Specifies the number of VRRP packets received by the virtual router with an invalid value in the 'type' field. AddressListErrors Specifies the packets received address list the address list does not match the locally configured list for the virtual router. AuthTypeMismatch Specifies the count of authentication type mismatch messages.
Viewing statistics using EDM Procedure 1. In the navigation pane, expand the following folders: Configuration > VLAN. 2. Click MLT/LACP. 3. Select the Ist/SMLT Stats tab. IST/SMLT Stats field descriptions The following table describes parameters on the IST/SMLT Stats tab. Name Description SmltIstDownCnt The number of times the session between the two peering switches has gone down since last boot. SmltHelloTxMsgCnt The count of transmitted hello messages.
Statistics Name Description SmltPortDownTxMsgCnt The count of sent port down messages. SmltPortDownRxMsgCnt The count of received port down messages. SmltReqMacTblTxMsgCnt The count or sent MAC table request messages. SmltReqMacTblRxMsgCnt The count of received MAC table request messages. SmltRxUnknownMsgTypeCnt The count of received unknown message type messages. SmltPortTblSyncReqTxMsgCnt The count of sent sync request messages.
Viewing statistics using EDM Name Description MasterTransitions Shows the total number of times that the state of this virtual router has transitioned to master. Discontinuities in the value of this counter can occur at re-initialization of the management system, and at other times as indicated by the value of DiscontinuityTime. RcdAdvertisements Shows the total number of VRRP advertisements received by this virtual router.
Statistics Name Description the value of this counter can occur at reinitialization of the management system, and at other times as indicated by the value of DiscontinuityTime. PacketLengthErrors Shows the total number of packets received with a packet length less than the length of the VRRP header. Discontinuities in the value of this counter can occur at re-initialization of the management system, and at other times as indicated by the value of DiscontinuityTime.
Viewing statistics using EDM 2. Click VRRP. 3. Click the V3 Stats tab. V3 Stats field descriptions Use the data in the following table to interpret the V3 Stats tab. Name Description InetAddrType Shows that the address type of the statistical entry is IPv4. ChecksumErrors Specifies the total number of VRRP packets received with an invalid VRRP checksum value. VersionErrors Specifies the total number of VRRP packets received with an unknown or unsupported version number.
Statistics Name Description InvalidConfigBpduRx Count Specifies the number of invalid configuration BPDUs this port received. A trap is generated on the occurrence of this event. InvalidTcnBpduRxCount Specifies the number of invalid TCN BPDUs this port received. A trap is generated on the occurrence of this event. ProtocolMigrationCount Specifies the number of times this port migrated from one STP protocol version to another. The relevant protocols are STPCompatible and RSTP.
Viewing statistics using EDM Name Description including those that were discarded or unsent. For a MAC layer protocol, this number includes both Group and Functional addresses. InBroadcastPkt Specifies the number of packets delivered to this MLT that were addressed to a broadcast address at this sublayer.
Statistics Name Description conditions occur are, according to the conventions of IEEE 802.3 Layer Management, counted exclusively according to the error status presented to the LLC. IMacTransmitError Specifies the frame count for which transmission on a particular MLT fails due to an internal MAC sublayer transmit error.
Viewing statistics using EDM Name Description instance of either the ifOutUcastPkts object, the ifOutMulticastPkts object, or the ifOutBroadcastPkts object, and is not counted by the corresponding instance of the SingleCollisionFrames object. LateCollisions Specifies the number of times that a collision is detected on a particular MLT later than 512 bit-times into the transmission of a packet; 512 corresponds to 51.2 microseconds on a 10 Mb/s system.
Statistics Displaying IPsec interface statistics Use this procedure to view IPsec statistics and counter values for each IPsec-enabled interface. Procedure 1. In the navigation pane, expand the following folders: Configuration > Security > Control Path. 2. Click IPSec. 3. Click the Interface Stats tab. Stats field descriptions Use the data in the following table to use the Stats tab. Name Description IfIndex Shows the interface index for which the statistic is captured.
Viewing statistics using EDM Name Description OutNotEnoughMemories Specifies the number of egress packets IPsec discards since boot time because not enough memory is available since boot time. generalError Specifies a general error. InAhSuccesses Specifies the number of ingress packets IPsec carries because the AH authentication succeeds. OutAHSuccesses Specifies the number of egress packets IPsec successfully carries since boot time.
Statistics Name Description InAnyNulEncrypt Specifies the number of inbound null occurrences since boot time. Used for debugging purposes. OutMD5Hmacs Specifies the number of outbound HMAC MD5 occurrences since boot time. OutSHA1Hmacs Specifies the number of outbound HMAC SHA1 occurrences since boot time. OutAESXCBCs Specifies the number of outbound AES XCBC MAC occurrences since boot time. OutInAnyNullAuth Specifies the number of outbound null authentication occurrences since boot time.
Viewing statistics using EDM Name Description InNotEnoughMemories Specifies the number of ingress packets IPsec discards since boot time because not enough memory is available. InAHESPReplays Specifies the number of ingress packets IPsec discards since boot time because the AH replay check fails. InESPReplays Specifies the number of ingress packets IPsec discards since boot time because the ESP replay check fails.
Statistics Name Description OutAHFailures Specifies the number of egress packets IPsec discards since boot time because the AH authentication check fails. OutESPFailures Specifies the number of egress packets IPsec discards since boot time because the ESP authentication check fails. InMD5Hmacs Specifies the number of inbound HMAC MD5 occurrences since boot time. InSHA1Hmacs Specifies the number of inbound HMAC SHA1 occurrences since boot time.
Viewing statistics using EDM Viewing BGP global stats View BGP global stats. Procedure 1. In the navigation tree, expand the following folders: Configuration > IP. 2. Click BGP. 3. Click the Global Stats tab. Global Stats field descriptions Use the data in the following table to use the BGP Global Stats tab. Name Description AbsoluteValue Displays the counter value. Cumulative Displays the total value since you opened the Stats tab. Average/sec Displays the average value for each second.
Statistics Name Description RxUpdates Displays the number of update instances BGP receives. RxNotifys Displays the number of notification instances BGP receives. TxOpens Displays the number of open instances BGP transmitted. TxKeeps Displays the number of keepalive instances BGP transmitted. TxUpdates Displays the number of updates instances BGP transmits. TxNotifys Displays the number of notification instances BGP transmits. BadEvents Displays the number of invalid events FSM received.
Viewing statistics using EDM Name Description RxUpdCodeWelKnownAttrUnrecog Displays the update errors received for Welknown Attr Unrecog. RxUpdCodeWelknownAttrMiss Displays the update errors received for Welknown Attr Missing. RxUpdCodeAttrFlagError Displays the update errors received for Attr Flag Error. RxUpdCodeAttrLenError Displays the update errors received for Attr Len Error. RxUpdCodeBadORIGINAttr Displays the update errors received for Bad ORIGIN Attr.
Statistics Name Description TxOpCodeAuthFail Displays the open errors transmitted for Auth Failures. TxOpCodeBadHold Displays the open errors transmitted for Bad Hold Value. TxUpdCodeMalformedAttrList Displays the update errors transmitted for Malformed Attr List. TxUpdCodeWelknownAttrUnrecog Displays the update errors transmitted for Welknown Attr Unrecog. TxUpdCodeWelknownAttrMiss Displays the update errors transmitted for Welknown Attr Missing.
Viewing statistics using EDM Name Description StatRouteEntries Specifies the number of routes for this VRF. StatFIBEntries Specifies the number of Forwarding Information Base (FIB) entries for this VRF. Viewing EAPoL Authenticator statistics Use EAPoL Authenticator statistics to display the Authenticator Port Access Entity (PAE) statistics for each selected port. Procedure 1. On the Device Physical View, select the port you want to graph.
Statistics Viewing EAPoL session statistics Use the following procedure to display multiple host session information for a port. Procedure 1. In the navigation pane, expand the following folders: Configuration --> Security --> Data Path. 2. Click 802.1x–EAPOL. 3. Click the MultiHost Session tab. MultiHost session field descriptions The following table describes values on the MultiHost Session tab. Name Description StatsPortNumber Indicates the port number associated with this port.
Viewing statistics using EDM Name Description MacPort Indicates the port number associated with this port. MacAddr Indicates the MAC address of the client. MacStatus Indicates the authentication status of the non EAP host that is authenticated using the RADIUS server. VlanId Indicates the VLAN assigned to the client. Viewing Multihost status information Use the following procedure to display multiple host status for a port. Procedure 1.
Statistics RADIUS Server Stats field descriptions Use the data in the following table to use the RADIUS Server Stats tab. Name Description AddressType Specifies the type of IP address. RADIUS supports IPv4 addresses only. Address Shows the IP address of the RADIUS server. Used by Identifies the client. AccessRequests Shows the number of access-response packets sent to the server; does not include retransmissions.
Viewing statistics using EDM Showing SNMP statistics About this task Display SNMP statistics to monitor the number of specific error messages, such as the number of messages that were delivered to SNMP but were not allowed. Procedure 1. In the navigation tree, expand the following folders: Configuration > Security > Control Path. 2. Click General. 3. Click the SNMP tab. SNMP field descriptions Use the data in the following table to display SNMP statistics.
Statistics Name Description InBadValues Shows the number of SNMP PDUs that were delivered to the SNMP protocol entity and for which the value of the error-status field is badValue. InReadOnlys Shows the number of valid SNMP PDUs delivered to the SNMP protocol entity and for which the value of the error-status field is "read-only".
Viewing statistics using EDM Viewing RMON statistics Before you begin • You must enable RMON statistics collection. About this task Use the following procedure to view RMON statistics for each port. Procedure 1. In the Device Physical View, select a port. 2. In the navigation tree, expand the following folders: Configuration > Graph 3. Click Port. 4. Click the RMON tab. 5. Select the statistics you want to graph. 6.
Statistics Name Description BroadcastPkts Specifies the number of good packets received that were directed to the broadcast address. This number does not include multicast packets. MulticastPkts Specifies the number of good packets received that were directed to a multicast address. This number does not include packets directed to the broadcast address.
Viewing statistics using EDM Displaying IS-IS system statistics Use the following procedure to display Intermediate-System-to-Intermediate-System (IS-IS) system statistics. Procedure 1. In the navigation tree, choose Configuration > IS-IS. 2. Click Stats. 3. Click the System Stats tab. System Stats field descriptions Use the data in the following table to use the System Stats tab. Name Description CorrLSPs Indicates the number of corrupted in-memory link-state packets (LSPs) detected.
Statistics Displaying IS-IS interface counters Use the following procedure to display IS-IS interface counters. Procedure 1. From the navigation tree, choose Configuration > IS-IS. 2. Click Stats. 3. Click the Interface Counters tab. Interface Counters field descriptions Use the data in the following table to use the Interface Counters tab. Name Description Index Shows a unique value identifying the IS-IS interface. Type Shows the type of IS-IS interface.
Viewing statistics using EDM 3. Click the Interface Control Packets tab. Interface Control Packets field descriptions Use the data in the following table to use the Interface Control Packets tab. Name Description Index Shows a unique value identifying the Intermediate-System-toIntermediate-System (IS-IS) interface. IfIndex Shows the interface index for the Ethernet or MLT interface. Direction Indicates whether the switch is sending or receiving the PDUs.
Statistics Name Description IDFieldLenMismatches Indicates the number of times an Intermediate-System-toIntermediate-System (IS-IS) control PDU with an ID field length different from that for this system has been received. MaxAreaAddrMismatches Indicates the number of times an IS-IS control PDU with a max area address field different from that for this system has been received.
Viewing statistics using EDM Name Description LSP Indicates the number of IS-IS LSP frames seen in this direction at this level. CSNP Indicates the number of IS-IS Complete Sequence Number Packet (CSNP) frames seen in this direction at this level. PSNP Indicates the number of IS-IS Partial Sequence Number Packets (PSNPs) seen in this direction at this level. AbsoluteValue Displays the counter value. Cumulative Displays the total value since you opened the Stats tab.
Statistics Name Description AbsoluteValue Displays the counter value. Cumulative Displays the total value since you opened the Stats tab. Average/Sec Displays the average value for each second. Minimum/Sec Displays the minimum value for each second. Maximum/Sec Displays the maximum value for each second. Last Val/Sec Displays the last value for each second. January 2017 Performance Management on Avaya VSP 4000 Series Comments on this document? infodev@avaya.
Chapter 8: RMON configuration using ACLI This section contains procedures to configure RMON using Avaya Command Line Interface (ACLI). For information about RMON statistics, see the following sections in the Statistics chapter: • Displaying RMON statistics for specific ports on page 43 • Viewing RMON statistics on page 67 Configuring RMON Enable RMON1 and RMON2 globally, and configure RMON1 alarms, events, history, statistics, and whether port utilization is calculated in half or full duplex.
RMON configuration using ACLI rmon event <1-65535> [community WORD<1-127>] [description WORD<0-127>] [log] [owner WORD<1-127>] [trap] [trap_dest [{A.B.C.D}]] [trap_src [{A.B.C.D}]] 5. Configure RMON1 history: rmon history <1-65535> {slot/port [/sub-port][-slot/port[/sub-port] [,...]}[buckets <1–65535>][interval <1–3600>][owner WORD<1–127>] 6. Configure RMON1 statistics: rmon stats <1-65535> {slot/port [/sub-port][-slot/port[/sub-port] [,...]} [owner <1–127>] 7.
Configuring RMON Variable Value this entry that becomes valid is greater than or equal to the rising alarm, or the rising or falling alarm. After the system generates a rising event, the system does not generate another such event until the sampled value falls below this threshold and reaches the alarm falling threshold. You cannot modify this object if the associated alarm status is equal to valid.
RMON configuration using ACLI Variable Value Note: When configuring from ACLI, the default owner is cli; when configuring with SNMP, the default owner is snmp. The default command only sets the owner to default. No other parameters can be changed after you create the alarm. Use the no operator to disable RMON alarms: no rmon alarm [<1-65535>] event <1-65535> [community WORD<1-127>] [description WORD<0-127>] [log] [owner WORD<1-127> ] [trap] Create an event. • <1-65535>— Specifies the event index number.
Enabling Remote Monitoring on an interface Variable Value • buckets <1–65535>— Specifies the requested number of discrete time intervals where the system saves data in the part of the media-specific table associated with this history control entry. The default value is 50. • interval <1–3600>— Specifies the time interval in seconds over which the system samples the data for each bucket in the part of the media-specific table associated with this history control entry.
RMON configuration using ACLI Before you begin • Enable RMON globally. Procedure 1. Enter Global Configuration mode: enable configure terminal 2. Enable RMON on a particular VLAN: vlan rmon <1-4059> 3. Enter GigabitEthernet Interface Configuration mode: enable configure terminal interface GigabitEthernet {slot/port[/sub-port][-slot/port[/subport]][,...
Displaying RMON information Displaying RMON information View RMON1 and RMON2 information on the switch. You can display information on RMON1 alarms, events, history, logs, and statistics. You can also display RMON2 information on application host statistics, control tables, network host statistics, and protocol distribution statistics. Procedure 1. View RMON1 information: show rmon {alarm|event|history|log|stats} 2.
RMON configuration using ACLI Variable definitions Use the data in the following table to use the show rmon command. Variable Value address-map Displays the RMON2 address map. This RMON2 parameter expands RMON capacity to display information on network, transport, and application layers. alarm Displays the RMON1 alarm table. application-host-stats WORD<1–64> Displays RMON2 application host statistics from one of the following protocols: TCP, UDP, FTP, Telnet HTTP, rLogin, SSHv2, TFTP, SNMP, HTTPS.
Displaying RMON information Displaying RMON address maps View the maps of network layer address to physical address to interface. The probe adds entries based on the source MAC and network addresses in packets without MAClevel errors. Procedure 1. Log on to the switch to enter User EXEC mode. 2.
RMON configuration using ACLI Example Switch:# show rmon application-host-stats ? WORD<1-64> Select one of these application protocols {TCP|UDP|FTP|TELNET|HTTP|RLOGIN|SSH|TFTP|SNMP|HTTPS} Switch:# show rmon application-host-stats FTP ================================================================================ Rmon Application Host Stats ================================================================================ HOSTADDR INPKT OUTPKT INOCT OUTOCT CREATETIME -----------------------------------------
Displaying RMON information Example Switch: show rmon ctl-table ================================================================================ Rmon Control Table ================================================================================ ================================================================================ Protocol Directory Table ================================================================================ IDX PROTOCOL ADDRMAPCFG HOSTCFG MATRIXCFG OWNER -------------------------------
RMON configuration using ACLI Parameter Description • SUPPORTED ON If the value is SUPPORTED ON, the probe adds entries to the address map table that maps the network layer address to the MAC layer address. AHDROPFRAMES Shows the total number of application layer host frames that the probe receives and drops. This value does not include packets that were not counted because they had MAC-layer errors. CREATETIME Shows when the entry was last activated.
Displaying RMON information Parameter Description • Hypertext Transfer Protocol (HTTP) • Remote login (RLOGIN) • Trivial File Transfer Protocol (TFTP) • Simple Networking Management Protocol (SNMP) • Hypertext Transfer Protocol Secure (HTTPS) Displaying RMON network host statistics View network host statistics to see Layer 3 traffic statistics for each host. The network layer host MIB monitors traffic packets in and out of hosts based on the network layer address. Procedure 1.
RMON configuration using ACLI Displaying RMON protocol distribution statistics View protocol distribution statistics to see traffic statistics that each protocol generates by local area network (LAN) segment. Procedure 1. Log on to the switch to enter User EXEC mode. 2.
Chapter 9: RMON configuration using EDM This section contains procedures to configure RMON using Enterprise Device Manager (EDM). For information about RMON statistics, see the following sections in the Statistics chapter: • Enabling RMON statistics on page 142 • Viewing RMON statistics on page 143 Enabling RMON globally About this task You must globally enable RMON before you can use RMON2 functions.
RMON configuration using EDM Name Description Enable Enables RMON. If you select the Enable check box, the RMON agent starts immediately if the amount of memory specified by MemSize is currently available in the device. To disable RMON, clear the Enable check box and click Apply to save the new setting to NVRAM, and then restart the device. The default is disabled. UtilizationMethod Controls whether RMON uses a half-duplex or full-duplex formula to calculate port usage.
Enabling RMON1 history Enabling RMON1 history About this task Use RMON1 to establish a history for a port and configure the bucket interval. For example, to gather RMON statistics over the weekend, you must have enough buckets to cover two days. Configure the history to gather one bucket every hour, and cover a 48-hour period. After you configure the history characteristics, you cannot modify them; you must delete the history and create another one. Procedure 1.
RMON configuration using EDM Name Description TrapOption Indicates whether the system sends RMON traps to the owner of the RMON alarm (the manager who created the alarm entry) or to all trap recipients in the system trap receiver table. The default value is toOwner. MemSize Specifies the RAM size, in bytes, available for RMON to use. The default value is 250 Kilobytes.
Viewing RMON1 history statistics Table 27: Variable definitions Parameter Description SampleIndex Identifies the particular sample this entry represents among all samples associated with the same history control entry. This index starts at one and increases by one as each new sample is taken. Utilization Specifies the best estimate of the mean physical layer network utilization on this interface during the sampling interval, in hundredths of a percent.
RMON configuration using EDM Parameter Description A repeater port must detect a collision when two or more stations transmit simultaneously. Thus, a probe placed on a repeater port can record more collisions than a probe connected to a station on the same segment. Probe location plays a small role when 10BASE-T. 14.2.1.4 (10BASE-T) of IEEE standard 802.3 defines a collision as the simultaneous presence of signals on the DO and RD circuits (transmitting and receiving at the same time).
Creating an RMON1 alarm 12. In the FallingEventIndex box, type a falling threshold event index. 13. In the Owner box, type the owner of the alarm. 14. Click Insert. Alarms field descriptions Use the data in the following table to use the Alarms tab. Name Description Index Uniquely identifies an entry in the alarm table. Each entry defines a diagnostic sample at a particular interval for an object on the device. The default is 1.
RMON configuration using EDM Name Description is deltaValue, the system subtracts the value of the selected variable at the last sample from the current value, and the system compares the difference with the thresholds. You cannot modify this object if the associated alarmStatus object is equal to valid. The default is deltaValue. Value Specifies the value of the statistic during the last sampling period.
Viewing RMON alarms Name Description alarmRisingThreshold. You cannot modify this object if the associated alarmStatus object is equal to valid. FallingEventIndex Specifies the index of the eventEntry that the system uses after a falling threshold is crossed. The eventEntry identified by a particular value of this index is the same as identified by the same value of the eventIndex object. If there is no corresponding entry in the eventTable, no association exists.
RMON configuration using EDM Creating an RMON1 event Create a custom rising and falling RMON1 event to specify if alarm information is sent to a trap, a log, or both. Procedure 1. In the navigation tree, expand the following folders: Configuration > Serviceability > RMON. 2. Click Alarms. 3. Click the Events tab. 4. Click Insert. 5. In the Description box, type an event name. 6. In the Type option, select an event type. The default configuration is log-and-trap.
Viewing RMON1 events Viewing RMON1 events View RMON1 events to see how many events occurred. Procedure 1. In the navigation tree, expand the following folders: Configuration > Serviceability > RMON. 2. Click Alarms. 3. Click the Events tab. Events field descriptions Use the data in the following table to use the Events tab. Name Description Index Uniquely identifies an entry in the event table. Each entry defines one event that the system generates after the appropriate conditions occur.
RMON configuration using EDM 5. Click Delete. Viewing the RMON log About this task View the trap log to see which activity occurred. Procedure 1. In the navigation tree, expand the following folders: Configuration > Serviceability > RMON. 2. Click Alarms. 3. Click the Log tab. Log field descriptions Use the data in the following table to use the Log tab. Name Description Time Specifies the creation time for this log entry.
Viewing the protocol directory Protocol Directories field descriptions Use the data in the following table to use the Protocol Directories tab. Name Description Index Shows a unique identifier for the entry in the table.
RMON configuration using EDM Name Description MatrixConfig Describes and configures the probe support for the network layer and application layer host tables for this protocol. The value can be one of the following: • notSupported • supportedOff • supportedOn Owner Shows the entity that configured this entry. Viewing the data source for protocol distribution statistics View the Distribution Control tab to see the network segment data source on which the protocol distribution statistics are measured.
Viewing protocol distribution statistics Viewing protocol distribution statistics View protocol distribution statistics to see traffic statistics that each protocol generates by local area network (LAN) segment. Procedure 1. In the navigation pane, expand the following folders: Configuration > Serviceability > RMON. 2. Click Protocol Distribution. 3. Click the Distribution Stats tab. Distribution Stats field descriptions Use the data in the following table to use the Distribution Stats tab.
RMON configuration using EDM Address Map Control field descriptions Use the data in the following table to use the Address Map Control tab. Name Description Index Shows a unique identifier for the entry in the table. DataSource Shows the source of data for the entry. DroppedFrames Shows the total number of frames that the probe receives and drops but does not include in the StatsDropEvents value. This event can occur if the probe is out of resources and sheds the load from this collection.
Viewing the data source for host statistics Name Description HostAddress Shows the network address for this entry. The format of the value depends on the protocol portion of the local index. Source Shows the interface or port on which the network address was most recently seen. PhysicalAddress Shows the physical address on which the network address was most recently seen. LastChange Shows the value of the sysUpTime when the entry was created or last changed.
RMON configuration using EDM Name Description that were not counted because they had MAC-layer errors. AHDropFrames Shows the total number of frames that the probe receives and drops but does not include in the StatsDropEvents value. This event can occur if the probe is out of resources and sheds the load from this collection. This value does not include packets that were not counted because they had MAC-layer errors. Owner Shows the entity that configured this entry.
Viewing application host statistics Name Description InOctets Shows the number of octets transmitted to this address, excluding octets in packets that contained errors. This value counts octets in the entire packet that contained the protocol, not just the particular protocol frames. OutOctets Shows the number of octets transmitted by this address, excluding octets in packets that contained errors.
RMON configuration using EDM Name Description fragmented network-layer packet can increment the counter several times. InOctets Shows the number of octets transmitted to this address, excluding octets in packets that contained errors. This value counts octets in the entire packet that contained the protocol, not just the particular protocol frames. OutOctets Shows the number of octets transmitted by this address, excluding octets in packets that contained errors.
Chapter 10: Service Level Agreement Monitor The switch supports the Service Level Agreement Monitor (SLA Mon™) agent as part of the Avaya SLA Mon solution. SLA Mon uses a server and agent relationship to perform end-to-end network Quality of Service (QoS) validation and to distribute monitoring devices. You can use the test results to target underperforming areas of the network for deeper analysis. SLA Mon server and agent The switch supports the SLA Mon agent.
Service Level Agreement Monitor Figure 4: SLA Monitor network An SLA Mon agent remains dormant until it receives a User Datagram Protocol (UDP) discovery packet from a server. The agent accepts the discovery packet to register with an SLA Mon server. If the registration process fails, the agent remains dormant until it receives another discovery packet. An agent can attempt to register with an SLA Mon server once every 60 seconds.
Limitations This test is similar to traceroute but also includes DSCP values at each hop in the path from the source to the destination. The destination does not need to be an SLA Mon agent. Limitations SLA Mon agent communications are IPv4–based. Agent communications do not currently support IPv6.
Service Level Agreement Monitor Note: The SLA Mon agent IP address must not use the IP address of an IP interface on the switch. slamon agent ip address {A.B.C.D} [vrf WORD<1-16>] 3. (Optional) Configure the UDP port for agent-server communication: slamon agent port <0–65535> 4. (Optional) Restrict which servers an agent can use: slamon server ip address {A.B.C.D} [{A.B.C.D}] slamon server port <0–65535> 5.
SLA Mon configuration using CLI SLAMon SLAMon SLAMon SLAMon Configured Server Port: 50011 0 Agent-To-Agent Communication Port: 50012 Configured Agent-To-Agent Communication Port: 0 Configured Agent Address Vrf Name: Next steps If you have configured SLA Mon, but the agent does not function as expected, use the show khi performance pthread [{slot[-slot][,...]}] command to verify that the slamon task is running.
Service Level Agreement Monitor Variable Value If you disable the agent, it does not respond to discovery packets from a server. If you disable the agent because of resource concerns, consider changing the server configuration instead, to alter the test frequency or duration, or the number of targets. server ip address {A.B.C.D} [{A.B.C.D}] Restricts the SLA Mon agent to use the server at this IP address only. The default is 0.0.0.0, which means the agent can register with any server.
SLA Mon configuration using EDM Procedure 1. In the navigation pane, expand the Configuration > Serviceability folders. 2. Click SLA Monitor. 3. Click the SLA Monitor tab. 4. For the status, select enabled. 5. In the ConfiguredAgentAddr field, enter the SLA Mon agent IP address 6. Configure optional parameters as required. 7. Click Apply. SLA Monitor field descriptions Use the data in the following table to use the SLA Monitor tab. Name Description Status Enables or disables the SLA Mon agent.
Service Level Agreement Monitor Name Description ConfiguredServerAddr Restricts the SLA Mon agent to use the server at this IP address only. If the default of 0.0.0.0 is used, then the SLA Mon agent can register with any server. ConfiguredServerPort Restricts the SLA Mon agent to use this registration port only. The default is 0, which means the agent disregards the source port information in server traffic. The server must use the same port.
Chapter 11: MACsec performance MACsec statistics MAC Security (MACsec) is an IEEE 802® standard that allows authorized systems in a network to transmit data confidentially and to take measures against data transmitted or modified by unauthorized devices. The switch supports the following statistics that provide a measure of MACsec performance.
MACsec performance Statistics Description LatePkts Specifies the number of packets received that have been discarded for this Secure Channel (SC) with Replay Protect enabled. Note: The current release does not support Replay Protect. NotValidPkts Specifies the summation of packets that were discarded in all SAs of the SC because they were not valid with one of the following conditions: • MACsec was operating in strict mode • The packets received were encrypted but contained erroneous fields.
Viewing MACsec statistics using the ACLI Viewing MACsec statistics using the ACLI Use the following procedure to view MAC Security (MACsec) statistics using ACLI. Viewing MACsec statistics Perform this procedure to view the MACsec statistics. Procedure 1. Enter Privileged EXEC mode: enable 2. View the general MACsec statistics: show macsec statistics [{slot/port[/sub-port][-slot/port[/sub-port]] [,...]}] 3.
MACsec performance 1/49 0 0 0 100037 0 Delayed Unchecked Ok Octets Octets PortId Packets Packets Pkts Validated Decrypted --------------------------------------------------------------------------1/49 0 0 0 53528828 0 Switch:1#show macsec statistics 1/49 secure-channel outbound =========================================================================== MACSEC Port Outbound Secure Channel Statistics =========================================================================== Protected Encrypted Octets
Viewing MACsec statistics using EDM Field Description the maximum transmission unit (MTU) of the common port interface. RxUntaggedPkts Specifies the number of received packets without the MAC security tag (SecTAG), with MACsec not operating in strict mode. RxNoTagPkts Specifies the number of received packets without the MAC security tag (SecTAG), with MACsec operating in strict mode.
MACsec performance Field Description UnusedSAPkts Specifies the summary of received unencrypted packets on all SAs of this secure channel, with MACsec not in strict mode. NoUsingSAPkts Specifies the summary of received packets that were discarded along with either encrypted packets or packets that were received with MACsec operating in strict mode. LatePkts Specifies the number of packets received that have been discarded for this secure channel (SC) with Replay Protect enabled.
Viewing MACsec statistics using EDM Field Description OctetsDecrypted Specifies the number of octets of plaintext recovered from received packets that were integrity protected and encrypted. Viewing secure channel (SC) outbound statistics Use this procedure to view the secure channel (SC) outbound statistics using EDM. Procedure 1. On the Device Physical View, select port 1/49 or 1/50. 2. In the navigation tree, expand the following folders: Edit > Port > General. 3. Click the SC Outbound Stats tab.
Chapter 12: RMON alarm variables RMON alarm variables are divided into three categories. Each category has subcategories. The following table lists the alarm variable categories and provides a brief variable description. RMON alarm variables Table 31: RMON alarm variables Category Subcategory Security Errors Interface Variable Definition rcCliNumAccessViolations.0 The number of CLI access violations detected by the system. rcWebNumAccessBlocks.0 The number of accesses the Web server blocked.
Category Subcategory Ethernet Variable Definition ifOutDiscards The number of outbound packets discarded even though no errors were detected to prevent the packets being transmitted. One possible reason for discarding such a packet is to free buffer space. ifOutErrors For packet-oriented interfaces, the number of outbound packets that were not transmitted because of errors.
RMON alarm variables Category Subcategory Variable Definition dot3StatsSingleCollisionFrames A count of successfully transmitted frames on a particular interface where transmission is inhibited by exactly one collision.
Category Subcategory Variable Definition interface later than 512 bit-times into the transmission of a packet; 512 bit-times corresponds to 51.2 microseconds on a 10 Mb/s system. A (late) collision included in a count represented by an instance of this object is also considered as a (generic) collision for purposes of other collisionrelated statistics. dot3StatsExcessiveCollisions A count of frames where the transmission on a particular interface fails due to excessive collisions.
RMON alarm variables Category Subcategory Variable Definition dot3StatsFrameTooLongs A count of frames received on a particular interface that exceeds the maximum permitted frame size. The count represented by an instance of this object increments when the frameTooLong status is returned by the MAC service to the LLC (or other MAC user). Received frames for which multiple error conditions obtained are, according to the conventions of IEEE 802.
Category Subcategory MLT Variable Definition continued processing. An example of why they were discarded can be lack of buffer space. This counter does not include any datagrams discarded while awaiting reassembly. ipOutDiscards.0 The number of output IP datagrams where no problems were encountered to prevent transmission to the destination, but that were discarded (for example, for lack of buffer space).
RMON alarm variables Category Subcategory Variable Definition rcStatMltEtherSingleCollFrames The number of successfully transmitted frames on a particular MLT where transmission is inhibited by exactly one collision. rcStatMltEtherMultipleCollFrames The number of successfully transmitted frames on a particular MLT where transmission is inhibited by more than one collision.
Category Subcategory Other Variable Definition asserted when attempting to transmit a frame on a particular MLT. The count represented by an instance of this object increments at most once for each transmission attempt, even if the carrier sense condition fluctuates during a transmission attempt. rcStatMltEtherFrameTooLong A count of frames received on a particular MLT that exceeds the maximum permitted frame size.
RMON alarm variables Category Traffic Subcategory Interface Variable Definition rcStatOspfBufferAllocFailures.0 The number of times that OSPF failed to allocate buffers. rcStatOspfBufferFreeFailures.0 The number of times that OSPF failed to free buffers. ifInOctets The total number of octets received on the interface, including framing characters.
Category Subcategory RmonEther Stats Variable Definition ifoutBroadcastPkts The total number of packets that higher level protocols requested transmitted, and that were addressed to a broadcast address at this sublayer, including those discarded or not sent. ifLastChange The value of sysUpTime at the time the interface entered its current operational state.
RMON alarm variables Category Subcategory Variable Definition etherStatsUndersizePkts The total number of packets received that are less than 64 octets long (excluding framing bits, but including FCS octets) and were otherwise well formed. etherStatsOversizePkts The total number of packets received that are longer than 1518 octets (excluding framing bits, but including FCS octets) and were otherwise well formed.
Category Subcategory ICMP Variable Definition ipFragOKs.0 The number of IP datagrams successfully fragmented. ipFragCreates.0 The number of IP datagram fragments generated as a result of fragmentation. ipReasmReqds.0 The number of requests to reassemble fragments. ipReasmOKs.0 The number of fragments reassembled successfully. IcmpInSrcQuenchs.0 The number of ICMP Source Quench messages received. icmpInRedirects.0 The number of ICMP redirect messages. icmpInEchos.
RMON alarm variables Category Subcategory Snmp Variable Definition icmpOutAddrMasks.0 The number of ICMP Address mask messages sent. icmpOutAddrMasksReps.0 The number of ICMP Address mask reply messages sent. icmpOutDestUnreachs.0 The number of ICMP destination unreachable messages sent. icmpOutTimeExcds.0 The number of ICMP time exceeded messages sent. snmpInPkts.0 The total number of messages delivered to the SNMP entity from the transport service. snmpOutPkts.
Category Subcategory Variable Definition generate an SNMP PDU that contains the value readOnly in the error-status field; as such, this object is provided as a means of detecting incorrect implementations of the SNMP. snmpInGenErrs.0 The total number of SNMP PDUs delivered to the SNMP protocol entity and for which the value of the error-status field is genErr. snmpInTotalReqVars.
RMON alarm variables Category Subcategory Bridge Variable Definition snmpOutNoSuchNames.0 The total number of SNMP PDUs generated by the SNMP protocol entity and for which the value of the error-status field is noSuchName. snmpOutBadValues.0 The total number of SNMP PDUs sent that were generated by the SNMP protocol entity and for which the value of the error-status field is badValue. snmpOutGenErrs.
Category Subcategory Utilization Variable Definition rcStgPortForwardTransitions The number of times this port transitioned from the Learning state to the Forwarding state. rcStgPortInConfigBpdus The number of Config BPDUs received by this port. rcStgPortInTcnBpdus The number of Topology Change Notification BPDUs received by this port. rcStgPortOutConfigBpdus The number of Config BPDUs transmitted by this port.
RMON alarm variables Category Subcategory Variable Definition rcSysSwitchFabricUtil.0 Percentage of switching fabric utilization. rcSysBufferUtil.0 Buffer utilization as a percentage of the total amount of buffer space in the system. A high value indicates congestion. rcSysNVRamUsed.0 Nonvolatile RAM (NVRAM) in use in kilobytes. rcSysLastChange.0 Last management-initiated configuration change since sysUpTime. rcSysLastVlanChange.
Category Subcategory Igmp MLT Variable Definition ospfASBdrRtrCount The total number of autonomous system border routers reachable within this area. ospfAreaLSACount The total number of link-state advertisements in this area's link state database. ospfIfState This signifies a change in the state of an OSPF virtual interface. ospfIfEvents The number of times this OSPF interface changed the state or an error occurred. ospfVirtIfState The state of the OSPF virtual link.
RMON alarm variables Category January 2017 Subcategory Variable Definition rcStatMltIfExtnIfHCInOctets The total number of octets received on this MLT interface including framing characters detected by the high-count (64-bit) register. rcStatMltIfExtnIfHCInUcastPkts The number of packets delivered by this MLT interface to a higher MLT that were not addressed to a multicast or broadcast address as detected by the high-count (64-bit) register.
Note: In addition to these elements that are offered in a graphical way by EDM, you can manually set any valid OID in the variable field to be monitored by an alarm. For these cases, the name of the variable cannot be translated automatically in OID, the exact OID must be set as a sequence of numbers. January 2017 Performance Management on Avaya VSP 4000 Series Comments on this document? infodev@avaya.