
Managing Faults on Avaya Virtual Services Platform 7200 Series and 8000 Series Version 4.2.1

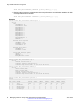
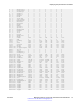
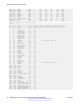
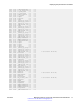
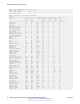
Table Of Contents
- Contents
- Chapter 1: Introduction
- Chapter 2: New in this release
- Chapter 3: Fault management fundamentals
- Chapter 4: Key Health Indicators using ACLI
- Chapter 5: Key Health Indicators using EDM
- Chapter 6: Link state change control using ACLI
- Chapter 7: Link state change control using EDM
- Chapter 8: RMON configuration using ACLI
- Chapter 9: RMON configuration using EDM
- Enabling RMON globally
- Enabling RMON on a port or VLAN
- Enabling RMON1 history
- Disabling RMON1 history
- Viewing RMON1 history statistics
- Creating an RMON1 alarm
- Creating an RMON1 port history alarm
- Viewing RMON1 alarms
- Deleting an RMON1 alarm
- Creating a default RMON1 event
- Creating a nondefault RMON1 event
- Viewing RMON1 events
- Viewing the RMON log
- Deleting an event
- Viewing the protocol directory
- Viewing the data source for protocol distribution statistics
- Viewing protocol distribution statistics
- Viewing the host interfaces enabled for monitoring
- Viewing address mappings
- Viewing the data source for host statistics
- Viewing network host statistics
- Viewing application host statistics
- Chapter 10: Viewing statistics using ACLI
- Chapter 11: Viewing statistics using EDM
- Chapter 12: Log and trap fundamentals
- Chapter 13: Log configuration using ACLI
- Chapter 14: Log configuration using EDM
- Chapter 15: SNMP trap configuration using ACLI
- Chapter 16: SNMP trap configuration using EDM
- Chapter 17: RMON alarm variables
- Glossary

show khi performance pthread [{slot[-slot][,...]}]
7. Display internal memory management resource performance and utilization statistics for KHI
on the specified slot or all slots:
show khi performance slabinfo [{slot[-slot][,...]}]
Example
Switch:1>show khi performance buffer-pool 1
Slot:1
CPP:
UsedFBuffs: 12
FreeFBuffs: 3060
RxQ0FBuffs: 0
RxQ1FBuffs: 0
RxQ2FBuffs: 0
RxQ3FBuffs: 0
RxQ4FBuffs: 0
RxQ5FBuffs: 0
RxQ6FBuffs: 0
RxQ7FBuffs: 0
TxQueueFBuffs: 0
NoFbuff: 0
Network stack system:
UsedMbuf: 244
FreeMbuf: 47606
SocketMbuf: 19
Network stack data:
UsedMbuf: 4
FreeMbuf: 10748
Letter API message queue:
QHigh: 0
QNormal: 0
FreeQEntries: 51200
Switch:1>show khi performance cpu 1
Slot:1
Current utilization: 8
5-minute average utilization: 8
5-minute high water mark: 13 (02/13/13 14:00:47)
Switch:1>show khi performance memory 1
Slot:1
Used: 514560 (KB)
Free: 521260 (KB)
Current utilization: 49 %
5-minute average utilization: 49 %
5-minute high water mark: 22 (10/08/14 14:48:01)
Switch:1>show khi performance process 1
Slot:1
--------------------------------------------------------------------------------
PID PPID PName VmSize VmLck VmRss VmData VmStk VmExe VmLib
--------------------------------------------------------------------------------
1 0 init 1936 0 656 164 88 32 1556
2 0 kthreadd 0 0 0 0 0 0 0
3 2 migration/0 0 0 0 0 0 0 0
4 2 ksoftirqd/0 0 0 0 0 0 0 0
5 2 watchdog/0 0 0 0 0 0 0 0
Key Health Indicators using ACLI
24 Managing Faults on Avaya VSP 7200 Series and 8000 Series June 2015
Comments on this document? infodev@avaya.com