Managing Faults on Avaya Virtual Services Platform 7200 Series and 8000 Series Release 5.0 NN47227-702 Issue 05.
© 2014-2015, Avaya, Inc. All Rights Reserved. Notice While reasonable efforts have been made to ensure that the information in this document is complete and accurate at the time of printing, Avaya assumes no liability for any errors. Avaya reserves the right to make changes and corrections to the information in this document without the obligation to notify any person or organization of such changes.
Nortel Products” or such successor site as designated by Avaya. For Heritage Nortel Software, Avaya grants Customer a license to use Heritage Nortel Software provided hereunder solely to the extent of the authorized activation or authorized usage level, solely for the purpose specified in the Documentation, and solely as embedded in, for execution on, or for communication with Avaya equipment.
Marks without prior written consent from Avaya or such third party which may own the Mark. Nothing contained in this site, the Documentation, Hosted Service(s) and product(s) should be construed as granting, by implication, estoppel, or otherwise, any license or right in and to the Marks without the express written permission of Avaya or the applicable third party. Avaya is a registered trademark of Avaya Inc. All non-Avaya trademarks are the property of their respective owners.
Contents Chapter 1: Introduction............................................................................................................ 7 Purpose.................................................................................................................................. 7 Related resources................................................................................................................... 7 Subscribing to e-notifications................................................................
Contents Viewing the data source for protocol distribution statistics......................................................... 43 Viewing protocol distribution statistics..................................................................................... 44 Viewing the host interfaces enabled for monitoring................................................................... 44 Viewing address mappings.....................................................................................................
Chapter 1: Introduction Purpose This document provides information on features in VSP Operating System Software (VOSS). VOSS runs on the following product families: • Avaya Virtual Services Platform 4000 Series • Avaya Virtual Services Platform 7200 Series • Avaya Virtual Services Platform 8000 Series Fault Management provides information about how to prevent faults and improve the performance of the Avaya Virtual Services Platform 7200 Series and 8000 Series switches.
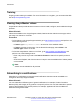
Introduction Training Ongoing product training is available. For more information or to register, you can access the Web site at http://avaya-learning.com/. Viewing Avaya Mentor videos Avaya Mentor videos provide technical content on how to install, configure, and troubleshoot Avaya products. About this task Videos are available on the Avaya Support website, listed under the video document type, and on the Avaya-run channel on YouTube.
Related resources Procedure 1. In an Internet browser, go to https://support.avaya.com. 2. Type your username and password, and then click Login. 3. Under My Information, select SSO login Profile. 4. Click E-NOTIFICATIONS. 5. In the GENERAL NOTIFICATIONS area, select the required documentation types, and then click UPDATE. 6. Click OK. 7. In the PRODUCT NOTIFICATIONS area, click Add More Products. 8. Scroll through the list, and then select the product name. 9. Select a release version. 10.
Introduction 11. Click Submit. Support Go to the Avaya Support website at http://support.avaya.com for the most up-to-date documentation, product notices, and knowledge articles. You can also search for release notes, downloads, and resolutions to issues. Use the online service request system to create a service request. Chat with live agents to get answers to questions, or request an agent to connect you to a support team if an issue requires additional expertise.
Support 3. In the Search dialog box, select the option In the index named .pdx. 4. Enter a search word or phrase. 5. Select any of the following to narrow your search: • Whole Words Only • Case-Sensitive • Include Bookmarks • Include Comments 6. Click Search. The search results show the number of documents and instances found. You can sort the search results by Relevance Ranking, Date Modified, Filename, or Location. The default is Relevance Ranking.
Chapter 2: New in this document The following sections detail what is new in Managing Faults on Avaya Virtual Services Platform 7200 Series and 8000 Series, NN47227-702. Remote Monitoring (RMON) RMON1 (or legacy RMON) is not supported in VOSS 5.0. However, RMON2 is still supported. RMON1 is the original version of the protocol, which collects information for OSI Layer 1 and Layer 2 in Ethernet networks.
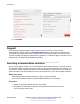
Chapter 3: Fault management fundamentals Fault management includes the tools and features available to monitor and manage faults. This section provides overview for local alarms, remote monitoring (RMON), link stage changes (port flapping), and Connectivity Fault Management. Local alarms The switch contains a local alarms mechanism. Local alarms are raised and cleared by applications running on the switch. Active alarms are viewed using the show alarm database command in ACLI.
Fault management fundamentals Figure 1: OSI model and RMON The RMON2 feature is a management information base (MIB) or a group of management objects that you use to obtain or configure values using the Simple Network Management Protocol (SNMP). Avaya supports a partial implementation of RMON2.
Remote Monitoring (RMON) RMON2 MIBs This section describes the following MIBs, on which RMON2 can collect statistics: protocol directory, protocol distribution, address map, network-layer host, and application layer host. Protocol directory MIB The protocol directory is a master directory that lists all of the protocols RMON2 can monitor. The protocols include network layer, transport layer, and application layer protocols, under the OSI model.
Fault management fundamentals Application layer host MIB The application layer host MIB monitors traffic statistics by application protocol for each host. The system populates an entry for the management IP of the switch to represent the network segment where the system collects the statistics. You have to enable each host interface that you want to monitor on the switch. The system only collects statistics for this group from packets that go to the CP.
Chapter 4: Key Health Indicators using ACLI The Key Health Indicators (KHI) feature of the switch provides a subset of health information that allows for quick assessment of the overall operational state of the device. Note: The KHI feature is not intended to provide a comprehensive debugging solution. Instead, KHI identifies key information that could lead Avaya support personnel towards discovery of a specific failure.
Key Health Indicators using ACLI show khi performance pthread [{slot[-slot][,...]}] 7. Display internal memory management resource performance and utilization statistics for KHI on the specified slot or all slots: show khi performance slabinfo [{slot[-slot][,...
Displaying KHI performance information 6 7 8 9 10 11 12 13 14 15 16 17 18 19 22 23 24 25 26 27 28 29 38 55 1351 1749 1762 1773 1779 1781 1782 4366 4660 4672 4700 4702 4749 4780 4785 4794 4795 4796 4797 4798 4799 4800 4801 4839 4840 4841 4842 4843 4844 4845 4846 4847 4848 4849 4850 4851 4852 4853 4854 4855 4856 2 2 2 2 2 2 2 2 2 2 2 2 2 2 2 2 2 2 2 2 2 2 2 1 2 1 1 1 1 1 1762 1782 2 2 2 2 4366 4749 4780 4780 4780 4780 4780 4794 4795 4797 4796 4780 4780 4780 4780 4780 4780 4780 4780 4780 4780 4780 4839 4841
Key Health Indicators using ACLI 4857 4858 4859 4860 4907 4946 4949 4973 4982 4989 4847 4846 4848 4849 4847 4780 4946 4946 4973 4982 logger logger logger logger logger slamon.sh logger slamon_second.
Displaying KHI performance information 4788 4789 4790 4791 4792 4793 4785 4794 4795 4802 4803 4804 4808 4796 4805 4806 4807 4809 4797 4810 4811 4812 4813 4814 4815 4816 4798 4799 4800 4801 4839 4873 4874 4875 4876 4840 4865 4866 4867 4868 4841 4861 4862 4863 4864 4842 4908 4909 4910 4911 4912 4913 4914 4915 4916 4917 4918 4919 4920 4921 4922 4923 4924 4925 4926 4780 4780 4780 4780 4780 4780 4785 4794 4795 4795 4795 4795 4795 4796 4796 4796 4796 4796 4797 4797 4797 4797 4797 4797 4797 4797 4798 4799 4800 4
Key Health Indicators using ACLI 4927 4928 4929 4930 4931 4933 4934 4935 4936 4937 4938 4939 4940 4941 4942 4943 4944 4947 4948 4955 4961 4962 4963 4965 4968 4984 4995 4996 4997 4998 4999 5000 5001 5002 5003 5004 5005 5006 5007 5008 5009 5010 5011 5012 5013 5014 5015 5072 5074 5075 5084 5085 5086 4843 4869 4870 4871 4872 4844 4877 4878 4879 4880 4845 4881 4842 4842 4842 4842 4842 4842 4842 4842 4842 4842 4842 4842 4842 4842 4842 4842 4842 4842 4842 4842 4842 4842 4842 4842 4842 4842 4842 4842 4842 4842 48
Displaying KHI performance information 4882 4883 4885 4846 4901 4902 4903 4904 4847 4896 4897 4898 4899 4900 4905 4906 5016 5017 5018 5019 5020 5022 5023 5024 5056 5057 5058 5059 5060 5061 5062 5063 5064 5065 5066 5067 5068 5071 4848 4884 4886 4887 4888 4849 4889 4890 4891 4892 4893 4894 4895 4850 4851 4852 4853 4854 4855 4856 4857 4858 4859 4860 4907 4946 4949 4845 4845 4845 4846 4846 4846 4846 4846 4847 4847 4847 4847 4847 4847 4847 4847 4847 4847 4847 4847 4847 4847 4847 4847 4847 4847 4847 4847 4847 4
Key Health Indicators using ACLI 4973 4982 4989 4990 4973 4982 4989 4989 slamon_second.s ns_exec slac slac 0.0 0.0 0.0 0.0 0.0 0.0 0.0 0.
Displaying KHI control processor information kmalloc-256 kmalloc-128 kmalloc-64 kmalloc-32 kmalloc-16 kmalloc-8 kmalloc-192 kmalloc-96 352 896 5120 896 1536 2560 273 966 351 895 5120 883 1535 2558 273 900 256 128 64 32 16 8 192 96 16 32 64 128 256 512 21 42 1 1 1 1 1 1 1 1 22 28 80 7 6 5 13 23 22 28 80 7 6 5 13 23 Variable definitions Use the data in the following table to use the show khi performance command. Table 1: Variable definitions Variable Value {slot[-slot][,...
Key Health Indicators using ACLI 3/7 3/7 3/7 3/7 Ether2_ARP_Request(10) Ether2_ARP_Other(11) Ether2_IPv4_PIM_MC(24) Ether2_IPv4_PIM_UC(26) 0 1 153 4 1 0 151 0 Variable definitions Use the data in the following table to use the show khi cpp command. Table 2: Variable definitions Variable Value slot/port[-slot/port][,...]} Identifies the slot and port in one of the following formats: a single slot and port (1/1).
Chapter 5: Key Health Indicators using EDM The Key Health Indicators (KHI) feature of the switch provides a subset of health information that allows for quick assessment of the overall operational state of the device. Note: The KHI feature is not intended to provide a comprehensive debugging solution. Instead, KHI identifies key information that could lead Avaya support personnel towards discovery of a specific failure.
Key Health Indicators using EDM Name Description PortStatsClear Clears port statistics. Displaying KHI port information About this task Use the following commands to display key health information about the types of control packets and protocols received on a port and sent to the control processor. Procedure 1. In the Device Physical View, select a port. 2. In the navigation tree, expand the following folders: Configuration > Graph. 3. Click Port. 4. Click the CPP Stats tab.
Chapter 6: Link state change control using ACLI Detect and control link flapping to bring more stability to your network. Controlling link state changes Configure link flap detection to control state changes on a physical port. Procedure 1. Enter Global Configuration mode: enable configure terminal 2. Configure the interval for link state changes: link-flap-detect interval <2-600> 3. Configure the number of changes allowed during the interval: link-flap-detect frequency <1-9999> 4.
Link state change control using ACLI Variable definitions Use the data in the following table to use the link-flap-detect command. Table 3: Variable definitions Variable Value Automatically disables the port if state changes exceed the link-flap threshold. By default, auto-port-down is enabled. Use the no operator to remove this configuration. To set this option to the default value, use the default operator with the command.
Chapter 7: Link state change control using EDM Detect and control link flapping to bring more stability to your network. Controlling link state changes About this task Configure link flap detection to control link state changes on a physical port. Procedure 1. In the navigation tree, expand the following folders: Configuration > Edit > Diagnostics. 2. Click General. 3. Click the Link Flap tab. 4. Configure the parameters as required. 5. Click Apply.
Chapter 8: RMON configuration using ACLI This section contains procedures to configure RMON using Avaya Command Line Interface (ACLI). Enabling RMON globally Enable RMON globally, and then enable RMON on the host interfaces you want to monitor. By default, RMON is disabled globally. Procedure 1. Enter Global Configuration mode: enable configure terminal 2.
Displaying RMON information configure terminal 2. Enable RMON on a particular VLAN: vlan rmon <1-4059> 3. Enter GigabitEthernet Interface Configuration mode: enable configure terminal interface GigabitEthernet {slot/port[/sub-port][-slot/port[/subport]][,...]} Note: If your platform supports channelization for 40 Gbps ports and the port is channelized, you must also specify the sub-port in the format slot/port/sub-port. 4.
RMON configuration using ACLI show rmon {address-map|application-host-stats WORD<1–64>|ctl-table| network-host-stats|protocol-dist-stats} The following sections provide examples for each parameter. Displaying RMON status View the current RMON status on the switch.. Procedure View RMON status: show rmon Example Switch: show rmon RMON Info : Status : enable Displaying RMON address maps View the maps of network layer address to physical address to interface.
Displaying RMON information Parameter Description HOSTADDR Shows the network address for this entry. The format of the value depends on the protocol portion of the local index. SOURCE Shows the interface or port on which the network address was most recently seen. PHYADDR Shows the physical address on which the network address was most recently seen. LASTCHANGE Shows when the entry was created or last changed. If this value changes frequently, it can indicate duplicate address problems.
RMON configuration using ACLI Parameter Description so a single, fragmented network-layer packet can increment the counter several times. INOCT Shows the number of octets transmitted to this address, excluding octets in packets that contained errors. This value counts octets in the entire packet that contained the protocol, not just the particular protocol frames. OUTOCT Shows the number of octets transmitted by this address, excluding octets in packets that contained errors.
Displaying RMON information ================================================================================ Address Map Control Table ================================================================================ IDX DATASOURCE DROPFRAMES OWNER -------------------------------------------------------------------------------1 0.0.0.
RMON configuration using ACLI Parameter Description MATRIXCFG Describes and configures the probe support for the network layer and application layer host tables for this protocol. The values can be one of the following: • NOT SUPPORTED • SUPPORTED OFF • SUPPORTED ON NHDROPFRAMES Shows the total number of network host frames that the probe receives and drops. This value does not include packets that were not counted because they had MAC-layer errors. OWNER Shows the entity that configured this entry.
Displaying RMON information Job aid The following table describes the fields in the output for the show rmon network-host-stats command. Parameter Description HOSTADDR Shows the host address for this entry. INPKT Shows the number of packets without errors transmitted to this address. This value is the number of link-layer packets so a single, fragmented network-layer packet can increment the counter several times. OUTPKT Shows the number of packets without errors transmitted by this address.
Chapter 9: RMON configuration using EDM This section contains procedures to configure RMON using Enterprise Device Manager (EDM). Enabling RMON globally About this task You must globally enable RMON before you can use an RMON function. If you attempt to enable an RMON function before the global flag is disabled, EDM informs you that the flag is disabled and prompts you to enable the flag. Enable RMON globally, and then enable RMON on the host interfaces you want to monitor.
Enabling RMON on a port or VLAN Enabling RMON on a port or VLAN Use the following procedure to enable RMON on an interface. Before you begin • Enable RMON globally. Procedure 1. Enable RMON on a VLAN: a. In the navigation pane, expand the following folders: Configuration > VLAN. b. Click VLANs. c. Click the Advanced tab. d. In the row for the VLAN, double-click the RmonEnable field, and then select enable. e. Click Apply. 2. Enable RMON on a port: a. In the Device Physical View, select a port. b.
RMON configuration using EDM Protocol Directories field descriptions Use the data in the following table to use the Protocol Directories tab. Name Description Index Shows a unique identifier for the entry in the table.
Viewing the data source for protocol distribution statistics Name Description MatrixConfig Describes and configures the probe support for the network layer and application layer host tables for this protocol. The values can be one of the following: • notSupported • supportedOff • supportedOn Owner Shows the entity that configured this entry.
RMON configuration using EDM Viewing protocol distribution statistics View protocol distribution statistics to see traffic statistics that each protocol generates by local area network (LAN) segment. Procedure 1. In the navigation pane, expand the following folders: Configuration > Serviceability > RMON. 2. Click Protocol Distribution. 3. Click the Distribution Stats tab. Distribution Stats field descriptions Use the data in the following table to use the Distribution Stats tab.
Viewing address mappings Address Map Control field descriptions Use the data in the following table to use the Address Map Control tab. Name Description Index Shows a unique identifier for the entry in the table. DataSource Shows the source of data for the entry. DroppedFrames Shows the total number of frames that the probe receives and drops but does not include in the StatsDropEvents value. This event can occur if the probe is out of resources and sheds the load from this collection.
RMON configuration using EDM Name Description HostAddress Shows the network address for this entry. The format of the value depends on the protocol portion of the local index. Source Shows the interface or port on which the network address was most recently seen. PhysicalAddress Shows the physical address on which the network address was most recently seen. LastChange Shows the value of the sysUpTime when the entry was created or last changed.
Viewing network host statistics Name Description that were not counted because they had MAC-layer errors. AHDropFrames Shows the total number of frames that the probe receives and drops but does not include in the StatsDropEvents value. This event can occur if the probe is out of resources and sheds the load from this collection. This value does not include packets that were not counted because they had MAC-layer errors. Owner Shows the entity that configured this entry.
RMON configuration using EDM Name Description InOctets Shows the number of octets transmitted to this address, excluding octets in packets that contained errors. This value counts octets in the entire packet that contained the protocol, not just the particular protocol frames. OutOctets Shows the number of octets transmitted by this address, excluding octets in packets that contained errors.
Viewing application host statistics Name Description fragmented network-layer packet can increment the counter several times. InOctets Shows the number of octets transmitted to this address, excluding octets in packets that contained errors. This value counts octets in the entire packet that contained the protocol, not just the particular protocol frames. OutOctets Shows the number of octets transmitted by this address, excluding octets in packets that contained errors.
Chapter 10: Log and trap fundamentals Use the information in this section to help you understand Simple Network Management Protocol (SNMP) traps and log files, available as part of the switch System Messaging Platform. Overview of traps and logs System log messaging On a UNIX-based management platform, you can use system log (syslog) messaging to manage event messages. The switch syslog software communicates with a server software component named syslogd on the management workstation.
Overview of traps and logs • Command line interface (CLI) log • software (SW) • Central Processing Unit (CPU) • Internet Protocol (IP) • Virtual Local Area Network (VLAN) • policy • Simple Network Management Protocol (SNMP) log The switch can send information in the system log file, including ACLI command log and the SNMP operation log, to a syslog server. View logs for CLILOG module to track all ACLI commands executed and for fault management purposes.
Log and trap fundamentals Table 4: Log commands accessible for various users Access level role Commands Administrator The remove and delete commands. No user at any access level. The following commands: • more • edit • rename • copy Administrator All configuration commands can only be accessed by the individual in the administrator role, other than the preceding commands. Administrator and auditor All show commands for log files.
Log message format Important: The switch does not reply to SNMP requests sent to the Virtual Router Redundancy Protocol (VRRP) virtual interface address; it does, however, reply to SNMP requests sent to the physical IP address. An SNMP manager and agent communicate through the SNMP protocol. A manager sends queries and an agent responds; however, an agent initiates traps.
Log and trap fundamentals The following messages are examples of an informational message for CLILOG: CP1 [07/18/14 13:23:11.253] 0x002c0600 00000000 GlobalRouter CLILOG INFO 135.55.40.200 rwa show log file name-of-file log.40300001.1806 13 TELNET: CP1 [07/18/14 13:24:19.739] 0x002c0600 00000000 GlobalRouter CLILOG INFO 135.55.40.200 rwa term more en 15 TELNET: CP1 [07/18/14 13:24:22.577] 0x002c0600 00000000 GlobalRouter CLILOG INFO 135.55.40.200 rwa show log 16 TELNET: CP1 [01/12/70 15:13:59.
Log message format Table 5: Severity levels Severity level Definition EMERGENCY A panic condition that occurs when the system becomes unusable. Usually a severity level of emergency is usually a condition where multiple applications or server are affected. You must correct a severity level of alert immediately. ALERT Any condition requiring immediate attention and correction.
Log and trap fundamentals • Error • Alert • Emergency The following table shows the default mapping of internal severity levels to syslog severity levels. Table 6: Default and system log severity level mapping UNIX system error codes System log severity level Internal severity level 0 Emergency Fatal 1 Alert — 2 Critical — 3 Error Error 4 Warning Warning 5 Notice — 6 Info Info 7 Debug — Log files The log file captures hardware and software log messages, and alarm messages.
Log file transfer continues to create a new log file with incremental sequence number on the internal flash for logging. Log file transfer The system logs contain important information for debugging and maintaining the switch. After the current log file reaches the configured maximum size, the system creates a new log file for logging. The system transfers old log files to a remote host. You can configure up to 10 remote hosts, which creates long-term backup storage of your system log files.
Log and trap fundamentals can avoid this if you rename the log file to something other than the format used by system messaging. • If your TFTP server is a UNIX-based machine, files written to the server must already exist. For example, you must create dummy files with the same names as your system logs. This action is commonly performed by using the touch command (for example, touch bf860005.001).
Chapter 11: Log configuration using ACLI Use log files and messages to perform diagnostic and fault management functions. Configuring a UNIX system log and syslog host Configure the syslog to control a facility in UNIX machines that logs SNMP messages and assigns each message a severity level based on importance. About this task You can log system log messages to external system log hosts with both IPv4 and IPv6 addresses with no difference in functionality or configuration using ACLI. Procedure 1.
Log configuration using ACLI Configure optional syslog host parameters by using the variables in the following variable definition tables. 8. View the configuration to ensure it is correct: show syslog [host <1–10>] Example Switch:1(config)# syslog enable Switch:1(config)# syslog host 1 address 47.17.143.
Configuring a UNIX system log and syslog host Variable Value • If the value is circuitless-ip, then for all syslog messages (in-band or out-of-band), the circuitless IP address is used in the IP header. If you configure multiple circuitless IPs, the first circuitless IP configured is used. max-hosts <1-10> Specifies the maximum number of syslog hosts supported, from 1–10. The default is 5. Use the data in the following table to use the syslog host command.
Log configuration using ACLI Configuring logging Configure logging to determine the types of messages to log and where to store the messages. About this task Note: The platform logs CLILOG and SNMPLOG as INFO. Normally, if you configure the logging level to WARNING, the system skips all INFO messages. However, if you enable CLILOG and SNMPLOG the system logs ACLI Log and SNMP Log information regardless of the logging level you set. This is not the case for other INFO messages. Procedure 1.
Configuring the remote host address for log transfer Variable Value • 2: Error — only error and more serious messages are recorded • 3: Manufacturing — this parameter is not available for customer use • 4: Fatal — only fatal messages are recorded screen Configures the log display on the screen to on. Use the no form of the command to stop the log display on the screen: no logging screen transferFile <1–10> address {A.B.C.
Log configuration using ACLI Table 8: Variable definitions Variable Value 1–10 Specifies the file ID to transfer. address {A.B.C.D} Specifies the IP address of the host to which to transfer the log file. The remote host must be reachable or the configuration fails. filename WORD<0-255> Specifies the name of the file on the remote host. If you do not configure a name, the current log file name is the default. Configuring system logging System logs are a valuable diagnostic tool.
Configuring system message control Table 9: Variable definitions Variable Value flags logging Enables or disables logging to a file a flash file. The log file is named using the format log.xxxxxxxx.sss. The first six characters after the prefix of the file name log contain the last three bytes of the chassis base MAC address. The next two characters specify the slot number. The last three characters denote the sequence number of the log file.
Log configuration using ACLI Switch:1(config)# sys msg-control max-msg-num 10 Switch:1(config)# sys msg-control control-interval 15 Switch:1(config)# sys msg-control Variable definitions Use the data in the following table to use the sys msg-control command. Table 10: Variable definitions Variable Value action Configures the message control action. You can either suppress the message or send a trap notification, or both. The default is suppress.
Viewing logs Switch:1# configure terminal Add a force message control pattern. If you use a wildcard pattern (****), all messages undergo message control. Switch:1(config)# sys force-msg **** Variable definitions Use the data in the following table to use the sys force-msg command. Table 11: Variable definitions Variable Value WORD<4-4> Adds a forced message control pattern, where WORD<4-4> is a string of 4 characters. You can add a four-byte pattern into the force-msg table.
Log configuration using ACLI Switch:1(config)#show logging file CP1 [02/06/15 22:38:20.678:UTC] 0x00270428 00000000 GlobalRouter cle: Start CP1 [02/06/15 22:38:21.770:UTC] 0x0027042b 00000000 GlobalRouter s sockserv started, pid:4794 CP1 [02/06/15 22:38:21.771:UTC] 0x0027042b 00000000 GlobalRouter s oom95 started, pid:4795 CP1 [02/06/15 22:38:21.771:UTC] 0x0027042b 00000000 GlobalRouter s oom90 started, pid:4796 CP1 [02/06/15 22:38:21.772:UTC] 0x0027042b 00000000 GlobalRouter s imgsync.
Configuring ACLI logging Variable definitions Use the data in the following table to use the show logging file command. Table 12: Variable definitions Variable Value alarm Displays alarm log entries. event-code WORD<0–10> Specifies a number that precisely identifies the event reported. module WORD<0-100> Filters and lists the logs according to module. Specifies a string length of 0–100 characters.
Log configuration using ACLI About this task Note: The platform logs CLILOG and SNMPLOG as INFO. Normally, if you configure the logging level to WARNING, the system skips all INFO messages. However, if you enable CLILOG and SNMPLOG the system logs ACLI Log and SNMP Log information regardless of the logging level you set. This is not the case for other INFO messages. Procedure 1. Enter Global Configuration mode: enable configure terminal 2. Enable ACLI logging: clilog enable 3.
Configuring ACLI logging CP1 rwa CP1 rwa CP1 rwa CP1 rwa CP1 rwa CP1 rwa CP1 rwa CP1 rwa CP1 rwa CP1 rwa CP1 rwa CP1 rwa [02/15/13 06:50:25.972] ena [02/15/13 06:50:30.288] conf t [02/15/13 06:50:39.412] show vlan basic [02/15/13 06:51:09.488] show isis spbm [02/15/13 06:56:00.992] spbm 23 b-vid 2 primar1 [02/15/13 06:56:59.092] show isis [02/15/13 07:10:54.928] show isis interface [02/15/13 07:12:33.404] show isis spbm [02/15/13 07:45:28.596] ena [02/15/13 07:45:30.236] conf t [02/15/13 07:46:29.
Chapter 12: Log configuration using EDM Use log files and messages to perform diagnostic and fault management functions. This section provides procedures to configure and use the logging system in Enterprise Device Manager (EDM). Configuring the system log About this task Configure the system log to track all user activity on the device. The system log can send messages of up to ten syslog hosts. Procedure 1. In the navigation tree, expand the following folders: Configuration > Edit > Diagnostics. 2.
Configuring the system log table Name Description OperState Specifies the operational state of the syslog service. The default is active. Header Specifies the IP header in syslog packets to circuitlessIP or default. • If the value is default, the IP address of the VLAN is used for syslog packets that are transmitted in-band using input/output (I/O) ports. • If the value is circuitlessIP, the circuitless IP address is used in the IP header for all syslog messages (in-band or out-of-band).
Log configuration using EDM Name Description Id Specifies the ID for the syslog host. The range is 1–10. AddressType Specifies if the address is an IPv4 or IPv6 address. Address Specifies the IP address of the syslog host. You can log system log messages to external system log hosts with both IPv4 and IPv6 addresses. UdpPort Specifies the UDP port to use to send messages to the syslog host (514–530). The default is 514. Enable Enables or disables the sending of messages to the syslog host.
Chapter 13: SNMP trap configuration using ACLI Use Simple Network Management Protocol (SNMP) traps and notifications to gather information about device activities, alarms, and other information on management stations. For more information about how to configure SNMP community strings and related topics, see Configuring Security on Avaya Virtual Services Platform 7200 Series and 8000 Series, NN47227-601.
SNMP trap configuration using ACLI show snmp-server host Example Configure the target table entry. Configure an SNMPv3 host. Switch:1>enable Switch:1#configure terminal Switch:1(config)#snmp-server host 198.202.188.207 port 162 v2c ReadView inform timeout 1500 retries 3 mms 484 Switch:1(config)#snmp-server host 198.202.188.207 port 163 v3 authPriv Lab3 inform timeout 1500 retries 3 Variable definitions Use the data in the following table to use the snmp-server host command.
Configuring an SNMP notify filter table enable configure terminal 2. Create a new notify filter table: snmp-server notify-filter WORD<1-32> WORD<1-32> 3. Ensure that the configuration is correct: show snmp-server notify-filter Example Switch(config)# snmp-server notify-filter profile3 99.3.6.1.6.3.1.1.4.
SNMP trap configuration using ACLI Configuring SNMP interfaces Configure an interface to send SNMP traps. If the switch has multiple interfaces, configure the IP interface from which the SNMP traps originate. Procedure 1. Enter Global Configuration mode: enable configure terminal 2. Configure the destination and source IP addresses for SNMP traps: snmp-server sender-ip {A.B.C.D} {A.B.C.D} 3.
Enabling SNMP trap logging Variable Value sender-ip Configures the SNMP trap receiver and source IP addresses. Specify the IP address of the destination SNMP server that receives the SNMP trap notification in the first IP address. Specify the source IP address of the SNMP trap notification packet that is transmitted in the second IP address. If this address is 0.0.0.
SNMP trap configuration using ACLI CP1 [02/06/15 22:39:58.530:UTC] 0x00004595 00000000 GlobalRouter SNMP INFO Boot ed with file CP1 [02/06/15 22:39:59.547:UTC] 0x00004603 00400003.67108870 DYNAMIC CLEAR Glob alRouter SNMP INFO 2k card up(CardNum=1 AdminStatus=1 OperStatus=1) CP1 [02/06/15 22:39:59.547:UTC] 0x00004603 00400003.67108870 DYNAMIC CLEAR Glob alRouter SNMP INFO 2k card up(CardNum=2 AdminStatus=1 OperStatus=1) CP1 [02/06/15 22:39:59.547:UTC] 0x00004603 00400003.
Chapter 14: SNMP trap configuration using EDM Use Simple Network Management Protocol (SNMP) traps and notifications to gather information about device activities, alarms, and other information on management stations. This section provides procedures to configure and use SNMP traps in Enterprise Device Manager (EDM). For information about how to configure SNMP community strings and related topics, see Configuring Security on Avaya Virtual Services Platform 7200 Series and 8000 Series, NN47227-601.
SNMP trap configuration using EDM Target Table field descriptions Use the data in the following table to use the Target Table tab. Name Description Name Specifies a unique identifier for this table. The name is a community string. TDomain Specifies the transport type of the address. ipv4Tdomain specifies the transport type of address is an IPv4 address. ipv6Tdomain specifies the transport type of address is IPv6. The default is ipv4Tdomain. TAddress Specifies the transport address in xx.xx.xx.
Configuring target table parameters Configuring target table parameters About this task Configure the target table to configure the security parameters for SNMP. Configure the target table to configure parameters such as SNMP version and security levels. Procedure 1. In the navigation tree, expand the following folders: Configuration > Edit > SnmpV3. 2. Click Target Table. 3. Click the Target Params Table tab. 4. Click Insert. 5. In the Name box, type a target table name. 6.
SNMP trap configuration using EDM Configuring SNMP notify filter profiles About this task Configure the SNMP table of filter profiles to determine whether particular management targets receive particular notifications. Procedure 1. In the navigation tree, expand the following folders: Configuration > Edit > SnmpV3. 2. Click Notify Table. 3. Click the Notify Filter Table tab. 4. Click Insert. 5. In the NotifyFilterProfileName box, type a name for the notify filter profile. 6.
Enabling authentication traps About this task Configure the profile table to associate a notification filter profile with a particular set of target parameters. Procedure 1. In the navigation tree, expand the following folders: Configuration > Edit > SnmpV3. 2. Click Notify Table. 3. Click the Notify Filter Profile Table tab. 4. Click Insert. 5. In the TargetParamsName box, type a name for the target parameters. 6. In the NotifyFilterProfileName box, type a name for the notify filter profile. 7.
SNMP trap configuration using EDM Name Description AuthenticationTraps Enables or disables the sending of traps after an error occurs. The default is disabled. LastErrorCode Specifies the last reported error code.
Glossary Application Programming Interface (API) Defines how to access a software-based service. An API is a published specification that describes how other software programs can access the functions of an automated service. Autonomous System Number (ASN) A two-byte number that is used to identify a specific AS. Avaya command line interface (ACLI) A textual user interface. When you use ACLI, you respond to a prompt by typing a command. After you enter the command, you receive a system response.
Glossary link-state advertisement (LSA) Packets that contain state information about directly connected links (interfaces) and adjacencies. Each Open Shortest Path First (OSPF) router generates the packets. Logical Link Control (LLC) A protocol used in LANs to transmit protocol data units between two end stations. This LLC layer addresses and arbitrates data exchange between two endpoints.
Simple Network Management Protocol (SNMP) Simple Network Management Protocol (SNMP) SNMP administratively monitors network performance through agents and management stations. spanning tree A simple, fully-connected active topology formed from the arbitrary physical topology of connected bridged Local Area Network components by relaying frames through selected bridge ports.