Aladin User manual Pierre Fernique Translation: Caroline Bot, Mark Allen 1 Introduction Aladin is an interactive software sky atlas allowing the user to visualize digitized astronomical images, superimpose entries from astronomical catalogues or databases. Most of available image and catalogue over the Internet are available and notably SIMBAD, NED, VizieR, MAST/STScI, CADC, HEASARC, SLOAN, NVSS… Aladin is dedicated to professional astronomers.
(see the copyright). It has been translated in English, French, Italian, German, Persian, Russian, Chinese… Aladin is mainly used for : Visualizing and checking catalogues and images Searching and browsing available astronomical data Preparing observations Creating field charts The Aladin software can be used directly in a Web page for dynamically visualizing astronomical data into a simple navigator such as Internet Explorer or Firefox.
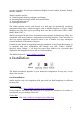
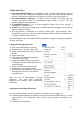
Installation under Macintosh uses a classic “dmg” package. Download it, open it, and copy the “Aladin.app” file in your “Applications” folder. That’s all! Under Linux and other Unix systems URL: http://aladin.u-strasbg.fr/java/Aladin.tar Installation under Linux uses a classic “tar” file. Download it, and unpack it via the command “ tar xvf Aladin.tar” or equivalent tool. That's all! Note: Aladin can be used with local data.
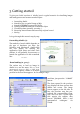
3 Getting started To give you a brief overview of Aladin, here's a typical scenario for visualizing images and catalogues around an astronomical object: 1. 2. 3. 4. 5. 6. 7. Launching Aladin Searching for an optical image of M51 Searching SIMBAD around this object Loading NOMAD catalogue around this object Visualizing data (panning, zooming…) Browsing measurement and accessing original record Saving Let’s go through this scenario step by step.
Thus, for loading Simbad data, you have to click on the Simbad tab, and without changing the parameter value in the form fields (identical to the previous position), press the “SEARCH” button again. Notice that for a catalogue, you have to write its name in the VizieR form before submitting the request. In our example, as NOMAD is a large survey, you can directly select it in the “Surveys” tab by clicking on the corresponding line. After that, you must press the "SUBMIT" button.
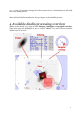
Measurements and original record access (6) Catalogues or tables may overlaid on images - in this case SIMBAD and NOMAD. Each of these objects can be selected via a mouse selection (direct click on a object or mouse box selection). The selected objects appear surrounded by with a small green square. The associated measurements are displayed as a table in the measurement frame. Some values are underlined in blue as a "Web link". The first link is usually used to display the full original record.
view => PNG ”for getting an image file of the current view in a format that you will easily use in any desktop tools. After this brief Aladin introduction, let’s go deeper to the available process. 4 Available Aladin processing overview Aladin works mainly on 3 types of data: images, catalogues and graphic overlays. These data types are displayed in one or several "views". For each of these elements, Aladin has a set of tools.
Aladin definitions An astronomical image is a rectangular array of values representing a field of view of the sky. The astronomical image is usually provided with other information about its origin and its calibration (sky position, pixel size, type of projection...); An astronomical catalogue is a table, or several tables, for which each row contains information about an astronomical object called a "source" (ID, sky position, physical measurements...
catalogue column generator; catalogue astrometrical calibration (without sky coordinates). Graphical overlays processing functions Contour extraction; Graphical tools: Distance measurement; Tag tool; Hand drawn tool; Free text; Cut graph along a segment or in the 3rd dimension for cubes. Coordinate grid; Instrument field of view (FoV) overlays; moving; rotation.
3. Popup menus available via a mouse right click or CTRL click (Mac); 4. Some keyboard shortcuts. Note: it is also possible to perform these operations via a script mode via described at the end of this manual (see 7.1) We will discover the various GUI components and how they work.
5 The graphical interface in details Aladin offers a rich graphical interface for achieving in a few clicks most basic functions. The two main windows are: The “main window” for displaying and manipulating the data; The “server selector” for locating and accessing the astronomical data, locally or via Internet.
Tip: The relative proportions of the different components can be adjusted using the on the bottom of the tool bar. Click and Drag for adjusting Guided tour Menu: Help => Aladin guided tour… Help => Show me how to… For discovering the main window, Aladin offers a “guided tour” you will find in the “Help” menu. Once activated, use your mouse over the various elements of the main window for displaying a description of the pointed component.
the operations and simultaneously, the mouse pointer will move alone displaying the corresponding actions. 5.1.1 The stack The stack represents all the data loaded in memory and which can be displayed in a view. The stack is structured as a set of "planes" stacked one above another. The user symbolized by the eye – observes the stack from the top. Types of plane The planes may be of different types depending on the nature of the data they contain.
a colour composite of the two (or three) image may be constructed, and multiple images may be directly compared by creating 'blink' planes. It is possible to load the stack with images and catalogues that do not fall in the same part of the sky. Using a single view window, it is possible to switch between different fields by clicking on the relevant image planes. Also, using multiple view windows will allow simultaneous viewing of different fields (see 5.1.2 multiview).
Menu : Short key: Edit => Properties Ctrl + Enter The “prop” button brings up a window with properties of a plane. This is also available from the main menu Edit->Properties, and from the contextual menu in the stack. The properties window lists the name of the plane and the origin of the data, and other properties dependent on the nature of the plane. Certain properties may be altered in this window. For example, the plotting symbols and colour of catalogue planes.
projection of the enclosed catalogue planes should be “local” (restricted to images in that folder), or “global” (to project on all images beneath it in the stack). 5.1.2 The view The viewing panel is the main component of the Aladin interface. The view shows a display of the data activated in the stack. Most of the time, it is an image onto which graphical symbols are overdrawn to represent the sources from catalogues.
Object location In order to trace astronomical objects to their precise location, Aladin is based on the astronomical solution linked to the image, e.g. a centralized tangential projection. Most of the time, images are given with an astronomical solution (this is the case in particular for the one in the FITS format). If this is not the case, for example for a JPEG image given by the user, it is possible to compute its astronomical solution (menu: Image => Astrometrical calibration – see5.8).
fully to the right, the image located on top will completely hide the corresponding part of the image below. It can be useful to swap image planes in the stack in order to modify the background/foreground images. Reticle Menu: Overlay => Reticle… The Reticle marks a particular location in the view. Usually, this is the location clicked most recently. The Reticle can be displayed as a small magenta cross or as two orthogonal lines. One can also choose to not display it (menu Graphic => Reticle).
highlighted with a small green square. If the selected objects are astronomical sources, then the associated measures will appear in the measure panel below the view (see 5.1.6.). Selected objects, if they are graphical additions and not sources from catalogues, can be moved around. For this, one needs to click and slide one of the small green squares that appeared during the selection. Furthermore, if these objects are instruments field of view (see 5.2.6 - FoV), corners can be used to perform rotations.
Coordinates grid Icon: Menu: Short key: grid Overlay => Grid Alt+G Activating a grid can be done either with the “grid” icon located below the view, or using the menu “Overlay => Grid”. The grid step depends on the current zoom factor in order to only display a reasonable number of sectors. The grid frame is the same as the one used to display the current location with the mouse. It is not possible to display simultaneously different grids corresponding to different referentials.
thousands of view can be created (see 6.5 – thumbnails creations). Only the views that are visible make use of random access memory (RAM). Allocations of the views The allocation of an image to a view is done by drag and drop of the respective plane logo onto the selected panel. It is also possible to create, as many views as there are images in the stack by using the menu “View => Create one view per image".
images are identical but pixels have been put out of shape. Matched views are automatically selected and can be noticed by their blue frames. If the orientation was also matched, the affected images are framed in red. Locked view Menu: View => Lock view When one double-clicks on a view, all the other views relative to the same region of the sky will be centred automatically on the clicked location. This is also the case if one clicks on the measures (see 5.1.6).
Outside the size of the display window, both modes are identical. The use of Aladin in “full screen” or “simple window” mode changes the normal usage in certain ways: Manipulation icons are shown on the right hand side.
Tip: The mode “simple window” presents all the basic function from Aladin. It can be used by default (see 8.1 – user profiles) and in particular if Aladin is used as an applet (see 7.2 – Aladin in a web browser) 5.1.3 The tool bar Located vertically in between the stack and the view, the “tool bar” enables a quick access to the most used tools: select pan.
The four buttons giving access to the graphical tools to measure distance, to draw by hand, to place tags or to write text are always clickable. Choosing one of them leads automatically to the creation of a plane “drawing” on top of the stack.
pixels for the peak below. This method is useful for example to make a quick approximation for the width at half maximum of a star. On top of this, for an image in real colours (see 8.2 – supported data types), the levels for the three components Red/Green/Blue will be shown simultaneously. Depth cut associated with the “Tag” tool The location and selection of a tag (with the “Tag" tool) in an image cube will generate also a cutting plot. However, this time it is along the depth of the cube.
The “magnifying glass” tool Button: Menu: Short key: mglss Image =>Magnifier glass, Pixel table Ctrl+G When the magnifying glass is activated, the zoom panel (bottom right of the main window) will be temporarily used to show a zoom of the pixels around the mouse pointer while it moves around the view. Using displacement keys (left, down, right, up arrows) is then possible to move pixel by pixel the mouse pointer.
The delete tool is highly dependant on the context. Depending on the element(s) selected with the mouse, it will delete one of the following: The graphical addition(s); The view(s); The plane(s). Furthermore, by pressing simultaneously the "SHIFT" key, all the data loaded in Aladin will be deleted. Use with care, there is no “undo” function in Aladin! The other tools accessible via the tool bar are detailed in the other sections of the document. 5.1.
Note: The reference system is used for displaying coordinates but also for entering coordinates in any Aladin forms. Pixel value The pixel value can be given in three ways: 8 bits: The “one colour” level (usually grey) is used for current display. It gives a value between 0 and 255 that depends mainly on the contrast parameters that were chosen.
Script command The location field can also be used, not only for a location, but also to type any other script command (see 7.1 – Aladin with script) Let’s look at the bottom of the main window: the “measures panel”. 5.1.6 The measures The “measure panel " is located at the bottom of the Aladin main window. It is used to visualise measures associated to the sources. It is a really powerful tool that enables you to select, sort and filter tables.
Measures from different catalogues If the selected sources come from different catalogues, tables with different columns will be shown one after the other. The colour of the square at the beginning of the line is useful to disentangle them (the colour is the same as the plane in the stack). The headline always corresponds to the last selected line (clicked with the mouse) or the one below the mouse pointer.
The “Edit” menu has a sub-menu that enables you to select all sources, i.e. all the sources existing in the catalogues planes loaded in the stack. It is also possible to select only the sources from one or the other plane through the menu “Edit => select all objects in the selected planes”. On would have to select beforehand the aforementioned planes in the stack (see 5.1.1). Selection with the mouse The selection with the mouse is the mostly used method.
Some examples: Star sources which measures contain the “star” word sources which column “otype” has the value “uv” otype=uv mag*>=12 first column in which the name starts with “mag”, the numerical value should be larger or equal to 12 |pm*|<5 same as above byt only the absolute value is taken into account type!=g* column “type” in which values that do not start with the ‘g’ letter bmag!="" column “bmag” that is not empty Unselecting Menu: Short key: Edit => Unselect objects … Ctrl+U To unsel
Selecting a line of measure with an expression The input box used to select sources is also used to select a specific line of measures. Thus, writing an expression - WITHOUT validating it (neither Enter, not the “Go” button) – and using the two arrows on the right side of the input box enables you to select the previous/following measure line that corresponds to the expression. The “up arrow” and "down arrow” keys, or the mouse wheel also let you switch to the previous or the next measure respectively.
Add/compute a new column Aladin gives you the possibility to add a new column of values. This operation is described with further details in section 5.7. Export measures Menu: catalogue => Create a new plane with … Contextual menu: Create a new plane with … Measures can be easily paste in the clipboard from the exploitation system in order to paste them to another application.
Tabs and forms can evolve with time and with new possibilities coming in the astronomical community. Each time it starts, Aladin accesses a “yellow pages” mechanism for the astronomical services in order to be up to date. It then adds or modifies the respective tabs when changes are detected (see technical details on the “cache” Erreur : source de la référence non trouvée). 5.2.1 Servers list You will find there most of the world wide astronomical centres that distribute data on the internet.
Giving the target The target can be either the identifier of an astronomical object recognized by the Sesame process (query in SIMBAD + NED + some large catalogues), either astronomical coordinates in sexagesimal format in the J2000 referential. Some examples: M1 NGC2045 Galactic centre 2 31 59 +89 15 54 12:59:48.70 +27:58:50.0 Giving a radius The query radius corresponds to the radius of the cone search on the sky. This value can be followed by a unit (“°”, “' ““"“ or “deg”, “arcmin”, “arcsec”).
Some servers need two steps to load the data: first you need to indicate the region on the sky, then you select among the available images or catalogues, those of which you would the columns; A click on an element displays information relative to this data, as well as some specific query parameters; Each element is preceded by a check box that enables you to select the elements to load.
5.2.5 The control band The server selector shows at its bottom a control band that is common to all forms. Reset: Delete all selection fields in the current form; Clear: Reinitialize the current form by putting back defaults values, and in particular the target and radius corresponding to the previously loaded data; Help: Displays an help panel on how to use the window; SUBMIT: starts the current form query; Close: Close the window. 5.2.
write a file name “.aladin_idha” that will be used to reload this description in a quick manner for the next time. “All VO” – All the VO in one click! This tab lets you query all the servers known by Aladin, not only the one shown on the right and left part of the window, but all the other servers described in the “yellow pages” of the Virtual Observatory. The form can be used to restrain the query to images servers and/or catalogues servers and/or spectral ones.
“SExtractor “ -The source extraction This form gives access to the “SExtractor” tool (Bertin & Arnouts, 1996 http://terapix.iap.fr/) and to generate a source catalogue from the current image. This form is described in details in section 6.4. 5.2.7 Aladin’s form characteristics The “Aladin images” tab opens the access form for images based at CDS (Strasbourg –France) especially for Aladin. You will find there, among others, the DSS, 2MASS, DENIS, IRAS-IRIS, WENS images.
The general form (“All VizieR”) lets you give either the name or the number of the catalogue directly (CDS/ADC nomenclature) in the specific field, or to obtain a list of catalogues that fulfil some criteria (free text, authors, … wavelengths, mission names or astronomical keywords). This query can be restrained by a cone search specified by the “Target/Radius” fields. This functionality is extremely useful to determine all the catalogues that have at least one observation in this field.
"All columns“and "whole catalogue" Some VizieR forms have two check boxes. The first one allows you to download all the columns of the concerned catalogues – and not only the default ones. The other check box allows you to download the whole catalogues without taking into account a specific target. This last option is limited to the first million sources. 5.2.9Characteristics of the SkyBot form The “SkyBot” tab opens a form to access solar system objects (except planets).
Furthermore, it is possible to give in the target field, the name of an asteroid or a comet so that SkyBot replaces it by its celestial position on the mentioned date. To do so, it is mandatory to press the button “Get coord. for this object+epoch…”. 5.2.10 Adding a personal server The “server selector” window can be adapted to your own servers. It is then possible to define a personal server that will add a tab and a form.
The 256 pixel values can be displayed either with grey levels, in positive or negative, or with a colour table that will make a correspondence between each pixel value and a specific colour. It is however possible that “interesting” pixels are not those of your interest, or that the autocut algorithm is not well suited for the characteristics of the images you wish to display.
the blue. If you move the mouse pointer on the histogram, the pixel values is displayed in abscissa as well as the corresponding red, green and blue values in ordinates on the right hand side of the histogram. Simultaneously, the final colour is shown in the above strip. Transfer functions By default, Aladin uses a linear function to relate the pixel value => entry for the colour table.
Gray: BB: A: Stern: Rainbow: Eosb: Fire: Note: IDL users can also dynamically load a colour table with the IDL-Aladin library (see 7.4). Quick pixels exploration By moving above the colour strip on top of the window with the mouse pointer, Aladin will temporarily use a specific colour table to enhance the location of the corresponding pixels in the image. The image will be displayed with grey levels and corresponding pixels in red.
specifying explicitly in the control band. If you click on the “use Aladin autocut algorithm”, Aladin will proceed again with its autocut algorithm without looking for meaningful pixels in between the limits you indicated. If the check is not activated, lower and upper threshold will be taken as specified. The button “Reset” is a short-cut to get all the image dynamics back.
histogram will evolve dynamically respectively to the current image. All adjusting possibilities of the pixel dynamics are the same as for a single image. In the case of large data cubes (several hundreds of megabytes), modifying operations of the initial threshold can take several seconds before the results gets displayed on all the images of the cube. Contrast tuning in the view Aladin has a contour extraction tool that lets you generate isophotes for and image.
Tip: The properties window associated to a contour plane (menu: Edit => Properties) lets you adjust the levels and colours of each contour afterwards. 5.5 Dealing with catalogue filters Button Menu: filter catalogue => Create a filter… Filtering catalogues in Aladin is a powerful tool to visualise sources in a clever way. Default behaviour (no filter) By default, Aladin displays sources with graphical symbols, all the same symbols for a given plane (shape and colour).
ellipsoidal errors for the location, arrows for which the location and size are relative to proper motion values … Showing a filter in the stack The filter is displayed as a peculiar plane in the stack and applies to all catalogue planes located above the filter plane. Using a predefined filter Aladin has some predefined filters that correspond to the usual handlings in astronomy. You can then select one of them and apply them instantaneously with the menu “catalogue => Predefined filters”.
Numerous commented examples that can be the base for your own filters; Buttons giving access to reference columns in the catalogues currently loaded in Aladin; A button giving access to graphical “actions” to perform; Buttons giving access to mathematical functions and to available units. You can also reload a filter from a previously saved file. Syntax To understand the filter syntax, let’s start with the following example.
log( abs(${Fi})/${Fx} ) > 44 { draw } It is mandatory to use quotes (") for strings. Joker keys are allowed ‘ ?’ et ‘*’ ; The “undefined(…)” operation enables you to see lines that don’t have a value for a given column. Graphical actions Two actions are available: Draw: to draw a source; Hide: rarely used, it enables you to hide specific sources. When using a “draw”, the action can be on the shape and/or on the colour of the plot.
Specific functions FILLCIRCLE: filled circle; FIXEDCIRCLE : Circle with a fixed size (not relative to the zoom value in the view); PM: arrow for which the orientation and the size are a function of two angles indicating a proper motion; LINE: drawing of a line segment, very useful to display the results of a correlation between two catalogues. The CIRCLE, FILLCIRCLE and RAINBOW functionalities take two optional parameters giving the minimum and maximum parameters used to draw.
to select a column by a simple click on it in the measure panel. To do so, you need to choose the sub-menu “Pick…” when you click on “Columns” or “UCDs”. Physical units Indicating physical units (e.g. arcmin, Jy, …) in the test enables you to get rid of the manual conversion for expressions using columns in which values are not expressed in the same unit. Units can be made as shown in the following example. This is a powerful example to describe generic filters.
Filter dedicated to a single specific catalogue plane Some servers offer a list of filters dedicated to their data (Simbad, NED, Skybot…). They appear in the data query form (see 5.2 Server Selector) as a scrolling list at the end of the query parameters. A dedicated filter, if activated does not appear in the stack and applies only to specific the catalogue plane. It prevents any other generic filter to be implemented on this plane.
5.6catalogues cross-match Button Menu: cross catalogue => Cross match objects… Aladin has an integrated cross-match tool for sources. The goal is to establish the shared sources between two catalogues. The cross-match tool will consider 2 catalogue planes, do the correlation and generate a new catalogue plane containing the shared sources. The window controlling the cross-match can be access by the button “cross” or with the menu “catalogue => Cross match objects”.
Positional cross-match The positional cross-match board lets you give two catalogues, as well as the corresponding locations (ra, dec). If there is no ambiguity, column names will have been selected automatically by Aladin. It is then necessary to give the upper limit on the offset, or even the lower limit offset between sources to be crossmatched. It is given in arc seconds. Finally, the selector gives 3 choices: 1.
By using the “Advanced options” button located in each of the cross-match forms, it is possible to explicitly choose the columns to be kept, as well as to specify suffix or prefix for column names. Columns and UCDs When the mouse pointer moves over the buttons that select columns, the buttons in correspondence between the two catalogues will be displayed on a blue background.
Note: Some UCD should not appear more than one time in a table (“meta_main”). Hence, if the correspondence is displayed on a red background, it means that there is a conflict between UCDs. To avoid this, you need to click on the dominating column name by holding the Ctrl key. Without further indications, the first column from the first catalogue will be dominating. 5.
Computing expression To create a new column, one needs to indicate the computing expression that Aladin will use to create values for this new column. The writing is done in the central box called “Expression”. The syntax uses usual conventions for algebraic expressions. References to other columns keep the syntax: ${column_name} To avoid writing mistakes, the main window gives a list of buttons showing the column names for the chosen catalogue.
Finally, Aladin also know how to deal with an astrometrical calibration if the image was loaded from a list that is in accordance to the Virtual Observatory Standard: SIA (Simple Image Access, see 8.2 – supported data types). Tip: In both first cases, the FITS header can be seen with the menu Edit => FITS header. An image can have several astrometrical calibrations, especially if you generated them manually.
Calibration by WCS header The third board displays FITS keywords giving the parameters for the calibration in the WCS standard. If you know this standard, you can directly modify these parameters. It is for example possible to use the astrometrical solution from another image directly by copy/paste of its WCS parameters. Tip: It is also possible to modify a value in a WCS keyword via the script command: set PlanID FITS:keyword=value (see 7.
centre (too wide a star), a message will be display to say that the clicked location will be taken as it is. Tips: It can be useful to perform the “symmetry” of the DSS image in order to get closer to the orientation of the image to calibrate ( Image => Symmetry) It is better to only display the bright stars with little proper motion. Using a filter an a catalogue ease the pointing of corresponding sources, for example: $[pos.pm;pos.eq.dec]<3 mas/yr && $[pos.pm;pos.eq.ra]<3 mas/yr && $[phot.
catalogue with only XY positions If you load a table or catalogue without celestial positions but with two columns representing the XY coordinates that Aladin could detect (based on the column names and/or the attached UCDs), the calibration window of the catalogue is instantaneously opened, inviting you to create a calibration for these sources.
selected planes, Aladin will use them to fill the form, else Aladin will take the 3 images on top of the stack, or else the 2 first ones. If the image associated wavelengths are known, Aladin will sort them according to this parameter Specific case for 2 images It is possible to only select 2 images. In such a case, the 3 rd colour component will be computed according to the 2 other by taking the average of the two other images.
manipulated like any other image in Aladin. The average will be used for regions that overlap. Cube or “animated sequence " A data cube is displayed in Aladin as an animated sequence, i.e. image after image. The logo in the stack is seen by a double line at its bottom as a symbol of the depth of the cube. How to manage a cube is described in the section on “the view” in 5.1.2. Tip: It is possible to add a new image to an existing data cube.
Access to the window The window controlling the resampling can be opened with the menu “Image => Resampling”. You need to select beforehand the image to resample in the stack. In the window, you need to specify the reference image, whether you wish to keep or not the “full” pixels, or just the “grey levels” code on 8 bits (quicker), choose the estimation method for the pixel values and at the end, say whether the original image needs to be replaced by the newly sampled image, or kept in the stack.
Convolution Furthermore, the menu “Image => Convolution …” lets you “convolve” the current image with a specific array, i.e. to compute a new image according to the product of each pixel from the original image (and their neighbours) with a specific array. The sub-menu gives the array usually used in astronomy (Gauss, Mex, TopHat…) with different sizes. You can also define you own convolution matrix by using the script command: “conv” (see Erreur : source de la référence non trouvée).
Generate a “clickable” map When save the Aladin view, the format “PNG+LINK” is offered. This format is dedicated to the creation of " Web clickable maps”. The view is save with the classical PNG format. A second file is generated simultaneously with a “.lnk” extension. It contains an ASCII format that is very simple for clickable objects present in the view, their position in the PNG image and a URL to access to the whole associated record.
Interface language management Aladin does support several languages for its graphical interface. It is possible to create your own translation if the language you wish to have is not yet supported. To do so, use the “New translation?" button and specify – in English 00 you language and the “2 letter” code that corresponds to it (e.g. “French” –“fr”).
scroll through the already submitted commands in order to re-edit them, modify them or execute them again. Tip: Be careful always write after the “Command>” prompt. If it is not displayed, press the Enter key to get a new line. Alternative to the console To rapidly give a command without opening the console, it is possible to type it directly in the location field used by Aladin to indicate the current position under the mouse. Please refer to the “Aladin by script” section (see 7.
6.2The Macro Controller Menu : Tools => Macro Controller To facilitate repetitive tasks Aladin provides a macro controller which is based on Aladin script commands (see 7.1). It allows for the script commands to include input variables that allow for the execution of a set of commands for a list of object names. The macro controller window is divided into 3 parts : The top panel allows the input of a script. The variables can be specified as $1, $2 etc.
Configuration of VO Tools Aladin facilitates the use of SAMP with a window that presents a list of applications that may be ‘connected interoperably’ with Aladin. This window provides a way of easily installing other applications, that will then be listed in the “Tools -> VO Tools” menu. the list of tools is managed dynamically so that it includes the latest versions of those applications.
The main menu “Interop” allows you to access all SAMP functions, and notably the SAMP options. It is also possible to use the contextual menu directly associated to the “antenna” (right click, or Ctrl click). Transfer of Data Once Aladin is connected to another application it is possible to send and receive data (images, tables, ...) and to create new entries in the stack.
Note : The SAMP actions are dependent on the applications, and it is possible that a selection of an object is simply ignored by a SAMP compatible application. Indeed some applications allow for configuration of the SAMP interoperability behaviors. 6.
objects in a list. The list may be defined by a selection of objects in a catalogue plane of the stack, or as a set of interactively 'tagged' objects. Aladin will generate as many views (see 5.1.2) as there are objects in the list.
7 Aladin for experts In this section we briefly outline some of the advanced features of Aladin. These include: How to use Aladin in script mode; How to use Aladin as an applet; Extending the capabilities by developing java plug-ins for Aladin; How to use IDL with Aladin 7.1 Aladin script mode As an alternative to the graphical interface, Aladin may be controlled by contextual commands.
The list of Aladin script commands Help on the script commands may be obtained via the “Help -> Help on script commands” menu item. This displays the online help in the main Aladin window. Each script command may be clicked to provide an explanation of the command and the input parameters. Using the planes of the stack as 'variables' In the context of a script, it is possible to use the planes of the stack as variables. The planes may be referred to by name, or by their position in the stack.
This method is very practical when the script includes arithmetic operations on image planes in the stack (addition, subtraction, multiplication, normalization, convolution…). Example : Make an image of the difference of 2 images in J and F bands : A = get Aladin(J) M1 B = get Aladin(F) M1 Diff = A – B 7.2 Make your data visible in the Aladin applet As indicated in section 2, Aladin may be used as an extension of a web browser (IExplorer, Firefox, Mozilla …) as a java applet.
Using JavaScript Aladin in applet mode may also be controlled via a JavaScript function with the following reference: document.aladin.execAsyncCommand(script) In contrast to the previous method, the use of the “-script” parameter with JavaScript allows modification of the behavior of the Aladin applet. It is not necessary to restart Aladin for each new data set to be visualized. For more information about controlling Aladin via JavaScript, refer to the FAQ (http://aladin.u-strasbg.fr/java/FAQ.
Writing Aladin plug-ins Writing plug-ins requires a reasonable understanding of the Java language. It involved extending the “AladinPlugin” object class in order to access the methods required for manipulation of the stack, and handling of images and catalogues. The documentation for creating plug-ins is available http://aladin.ustrasbg.fr/java/FAQ.htx#plugins. There are a lots of tutorial plug-ins examples for helping you to start. 7.
It is also possible to use the “-outreach” command line parameter, respectively “preview ” when you start Aladin in a console. In these cases, a student cannot change the profile view the “user preferences” 8.2Supported data types Most of data types used in astronomy, either for images or catalogues, or meta-data are supporting by Aladin. The usual compression methods are also supported.
GZIP Compression Can be used with any other formats Aladin recognizes automatically the data type by analyzing the data content. The file name extension or the “Content-type” definition for an http stream is not required. Exception : the AJS format (Aladin script) is an exception of this rule. In case of ambiguity, Aladin will look for an “.ajs” file name extension and/or on this first line comment “#AJS”. 8.
For images having a few hundred megabytes, Aladin will use some space on disk for temporary full pixel value storage. The impact on the fluidity is not really sensible; For several gigabyte images, Aladin will deploy a strategy in two steps: a first low resolution but fast display for the whole image, and when the user zooms on a enough small area, a second full resolution display but requiring to load from disk all concerned pixels.
Short keys View Zoom in Zoom out Pan Next image 1 view 2 views 4 views 9 views 16 views One view per image Scale match Scale/rotation match Full screen Preview mode F8 or mouse wheel F7 or mouse wheel Alt+Z Tab F1 Maj+F2 F2 F3 F4 F9 Alt+S Alt+Q F11 F12 Print Magn.
Table of content 1 Introduction......................................................................................................................3 2 Installation........................................................................................................................4 3 Getting started...................................................................................................................7 4 Available Aladin processing overview.....................................................
8.1 User profiles............................................................................................................88 8.2 Supported data types...............................................................................................89 8.3 FITS standard and astrometrical calibration..........................................................90 8.4 Performances and technical constraints.................................................................90 8.4.1 Image management......................
Index lexical AJ.............................................................82 AJS...........................................................82 Applet.........................................................3 Autocut....................................................46 BMP.........................................................68 BSV..........................................................82 Catalogue..................................................... calibration.......................................
properties.............................................14 select.....................................................13 PNG....................................7, 20, 47, 68, 82 Preferences..............................................69 Profile......................................................69 Reticle.......................................................17 RICE........................................................82 Save............................................................6 Saving...........
NGC 1313, NGC 1808, NGC 2203, NGC 2359, NGC 2442, NGC 4438, NGC 6070, NGC 253, Orion nebulea, RCW 38, Hercules cluster, M1, M16, M65, M83, M96. Two coloured composition (DSS2 J/F or R/I) done by Aladin.