
User manual

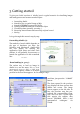


Thus, for loading Simbad data, you have to click on the Simbad tab, and without
changing the parameter value in the form fields (identical to the previous position),
press the “SEARCH” button again. Notice that for a catalogue, you have to write its name
in the VizieR form before submitting the request. In our example, as NOMAD is a large
survey, you can directly select it in the “Surveys” tab by clicking on the corresponding
line. After that, you must press the "SUBMIT" button.
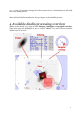
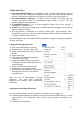
Data visualization (4)
There are 4 components to the data
visualization window:
1. The stack: shows all the downloaded
data as a stack of “planes”. The user
eye is on the top of this stack and sees
all activated planes by transparency.
2. The zoom: shows the image area
currently visible (blue rectangle)
according to the factor and the centre
of the zoom.
3. The view: displays the image area
currently visible according to the
activated stack planes, zoom factor
and the overlaid graphics and table
planes.
4. The measurements: shows the
measurements associated to the objects selected in the view via the mouse
(magnitude, parallax…)
Plane activation: Enabling or disabling a plane is done by clicking on the small
checkbox on the left of the plane logo in the stack. It is also possible to arrange planes
within the stack via the mouse (click and drag) (note that an image on top of the stack
hides catalogues below).
zooming by using the mouse wheel. The view will be automatically centred on this
object.
5