Facebook Page Insights Product Guide for Facebook Page owners Businesses will be better in a connected world. That’s why we connect 800M people and their friends to the things they care about, using social technologies that drive business growth. Pages are where you connect with people.
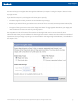
Page Insights Get started To see insights about your Facebook Page, visit your Page and click on the Insights tab on the left-hand side of your Page.* * Please note that the new Page Insights is initially launching as a preview. To access it during the preview period, please visit facebook.com/insights and click on your Page, or click on “View Insights” on the right-hand side of your Page, then follow the instructions at the top of the Insights page. © 2011 Facebook, Inc. All rights reserved.
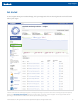
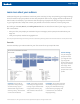
Page Insights You can review your Insights data through the dashboard, or export it using the ‘Export’ button in the top right corner.
Page Insights Understand the overall performance of your Page The four metrics at the top of your Insights tab allow you to quickly understand the size and engagement of your audience. You should monitor these metrics closely to assess the success of your marketing strategy. Total Likes: The number of unique people who like your Page. Friends of Fans: The number of unique people who are friends with your fans, including your current fans.
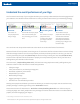
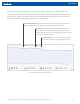
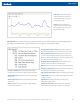
Page Insights Posting regularly with engaging content gets more people to talk about your business with their friends. As a result, you end up reaching more people overall. The following graph shows you how the posts that you publish to your Page influence the number of people talking about you, and how the number of people talking about you influences your overall reach.
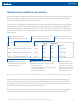
Page Insights Optimize how you publish to your audience Your ultimate goal as a Page owner is to publish content that will reach a large audience, and that your audience will engage and share your content with friends. Now you can use Page Insights to better understand what your audience wants to hear about.
Page Insights ! Each of the columns of the list of posts gives you a different perspective on the success of your publishing strategy, depending on your objectives. For example, if you are a movie studio and want to drive awareness of a new movie, you will mostly focus on “reach” and “engaged users” to understand how many people your trailer reached and how many watched it.
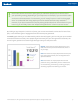
Page Insights The Engaged Users graph allows you to understand the different types of engagements your post generated. Anyone clicking anywhere on your post is considered an “Engaged User.” The types of engagement you can find in the pie chart include all the different ways people can consume your post (clicking on a link, viewing a picture, watching a video...), spread it to friends (by liking it, commenting on it, answering a Question, RSVP-ing to an event, etc...
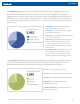
Page Insights Learn more about your audience Understanding who your audience is and how you’re reaching it is key to optimizing your Page strategy. This information helps you publish content that people will want to see, engage with and talk about to their friends. For example, if you discover that the majority of people who like your Page are men 18 to 24, you might decide to adapt the content you publish to fit with the interests of these young men.
Page Insights New Likes: The total number of unique people who have liked your Page each day during your selected date range. Unlikes: The total number of unique people who have unliked your Page each day during your selected date range. Like Sources: The number of times your Page was liked, broken down by where the Like happened (on your Page, from News Feed, on your website, etc.), during your selected date range.
Page Insights Reach tab The Reach tab helps you understand who the people you are reaching are and how you managed to reach them. Gender and Age: The percentage of people who saw any content about your Page in the last seven days for each age and gender bracket, as of the last day of your selected date range. This is based on the data people enter in their profile.
Page Insights Reach graph: This graph shows how many people have seen any content about your Page and whether these people were reached through an organic, paid or viral channel. People might see your content through more than one of these channels, so the sum of your organic, paid and viral reach might be larger than your total Page reach. Organic: The number of unique people, fans or nonfans, who saw any content about your Page in their News Feed, Ticker or on your Page.
Page Insights Page Views: The number of times your Page was viewed on each day during your selected date range. Unique Visitors: The number of unique people who visited your Page on each day during your selected date range. Total Tab Views: The number of times each of your Page tabs were viewed during your selected date range. External Referrers: The number of times people arrived on your Page from a URL that is not part of facebook.com, during your selected date range.
Page Insights Talking About This tab The Talking About This tab helps you understand who the people talking about your Page are, and the types of stories they’re telling friends about your business. Gender and Age: The percentage of people who talked about your Page in the last 7 days for each age and gender bracket as of the last day of your selected date range. This is based on the data people enter in their profile.
Page Insights Focus on engaging your audience The best way to get your audience to engage with your content and share it with friends is to understand deeply what the people you’re reaching care about. Page Insights gives you the data you need to gather these consumer insights. You should visit Page Insights on a regular basis to track which of your posts resonated with your audience and generated the most engagement so you can post more of this type of content.