
User's Manual


© 2011 Facebook, Inc. All rights reserved. Product specifications subject to change without notice.
12
Page Insights
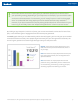
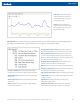
Reach graph: This graph shows how many people have seen any content about your Page and whether
these people were reached through an organic, paid or viral channel. People might see your content
through more than one of these channels, so the sum of your organic, paid and viral reach might be
larger than your total Page reach.
Organic: The number of unique people, fans or non-
fans, who saw any content about your Page in their
News Feed, Ticker or on your Page.
Paid: The number of unique people who saw an ad
or Sponsored Story that pointed to your Page.
Viral: The number of unique people who saw this
post from a story published by a friend.
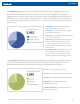
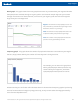
Frequency graph: This graph shows the number of people who have seen content about your Page in
the last 7 days, broken down by the number of times they saw it during that time.
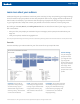
Please note that you can further refine the data shown in the Reach and Frequency graphs by selecting
to see all content about the Page, only Page posts only, or only content about the Page generated by
users from the dropdown menu.
For example, you can see on this graph that
about 5,000,000 people were exposed to any
content about your Page once, and about
2,000,000 people were exposed to it twice.