
IR Series Brochure


0
0.2
0
.4
0.6
0.8
1
1.2
1
.4
1.6
0 50 100 150 200 250 300 350 400 450 500
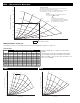
K=90
K=860
K
=160
K
=260
K=350
K
=500
30dB(A)
35dB(A)
40dB(A)
45dB(A)
50dB(A)
5
5dB(A)
232 cfm
(
1)
(2)
(3)
Flow Rate, Q (cfm)
Static Pressure, Ps (inH2Og)
S
ound:
The sound pressure level (LpA) is
a
pproximately 1/3 between the 50dB(A) line
and the 55dB(A) line so the expected sound
pressure will be approx. 52dB(A)
C
alculation example:
The airflow (cfm) and sound pressure level can be found from the graph
w
hen the K factor and static pressure are known.
If the Iris Damper is set to 260
(1)
and the differential pressure between the
two pressure taps is 0.8 in.WG
(
2)
, the airflow (q) is 232 cfm.
(
3)
F
ormula:
N
ote that the formula: q = K x ∆p can be used to get
the same result, 0.8 x 260 = 232
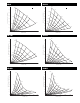
0
0.1
0.2
0.3
0.4
0.5
0.6
0.7
0.8
0.9
1
0 20 40 60 80 100 120 140 160 180
K=50
K=70
K=100
K=130
K=220
K=310
30dB(A)
35dB(A)
40dB(A)
45dB(A)
50dB(A
)
55dB(A)
K=170
Flow Rate, Q (cfm)
Static Pressure, Ps (inH2Og)
0
0.2
0.4
0.6
0.8
1
1.2
1.4
1.6
0 50 100 150 200 250
K=80
K=320
K=50
K=120
K=175
K=280
30dB(A)
35dB(A)
40dB(A)
45dB(A)
50dB(A
)
55dB(A)
K=225
Flow Rate, Q (cfm)
Static Pressure, Ps (inH2Og)
IR4
Sound Power Level L
W
Sound power level (Lw) for each frequency band can be found by applying the formula: Lw = LpA + Kok
IR6 - Calculation Example
63 125 250 500 1K 2K 4K
IR4 11 10 3 -2 -8 -16 -24
IR5 7 8 2 -4 -11 -19 -27
IR6 9 6 1 -5 -11 -18 -27
IR8 9 5 1 -5 -12 -17 -24
IR10 6 1 -4 -3 -4 -17 -24
IR12 3 1 -4 -4 -9 -13 -19
IR16 3 1 -4 -4 -9 -13 -19
IR20 14 8 2 -3 -8 -11 -14
IR25
12
6
1
-3 -8 -11 -14
T
olerance
+/- 6
+/- 5 +/- 2 +/- 2 +/- 2 +/- 2 +/- 3
Sound Data
SIZE
Mid-frequency (octave band) Hz
IR5
From the example above, sound pressure level (LpA) is
52dB(A).
Sound power level (Lw) can now be found from the table.
The sound power level (Lw) in the 500Hz octave band is:
LpA (from graph) + Kok (correction factor from table) = Lw
or 52 + (-5) = 47dB(A).