
Datasheet


Revised 08/04
5
TECHNICAL INFORMATION FOR TGS2600
2-2 Temperature and humidity dependency
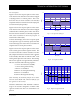
Figure 6 shows the temperature and humidity
dependency of TGS2600 in clean air. The Y-axis
shows the ratio of sensor resistance in clean air under
various atmospheric conditions (Rs) to the sensor
resistance in clean air at 20˚C/65%RH (Ro).
Fig. 6 - Temperature and humidity dependency (Rs/Ro)
in clean air
Fig. 7 - Temperature and humidity dependency (Rs/Ro)
in 10ppm of hydrogen
Table 1 - Temperature and humidity dependency
(typical values of Rs/Ro for Fig. 6)
Table 1 shows a table of values of the sensor’s
resistance ratio (Rs/Ro) under the same conditions
as those used to generate Figure 6.
Figure 7 shows the temperature and humidity
dependency of TGS2600 in hydrogen. The Y-axis
shows the ratio of sensor resistance in 10ppm of
hydrogen under various atmospheric conditions (Rs)
to the sensor resistance in clean air under the same
atmospheric conditions (Ro).
.H.R
)C˚(
.H.R%04 .H.R%56 .H.R%58 .H.R%001
01-53.2
006.1
0116.124.152.1
0203.100.139.
0399.08.07.
0487.16.45.
0536.84.34.
0.1
1
10
-20-100102030405060
40%
65%
85%
100%
Rs/Ro
Ambient temperature (˚C)
Gas: air
RH%:
0.1
1
-20-100102030405060
40%
65%
85%
100%
Rs/Ro
Ambient temperature (˚C)
Gas: 10ppm hydrogen
RH%: