
Guide


www.flexpoint.com Copyright
©
2015 Flexpoint Sensor Systems Page 6 of 15
10
11
12
13
14
15
16
17
18
1
3
6
v
+
v
+
R
M
R
1
R
HI
IN
OUT
R
LO
GND
REF
Bend
Sensor
LED1
v
+
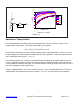
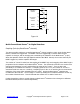
Figure 1.3 Flexpoint LED Display Demo for Bend Sensor
®
Device
Bend Sensor
®
LED Display Demo:
This simple Bend Sensor
®
LED display demo uses a display driver to translate an analog input into ten
separate voltage levels. As each level is attained, current is drawn through an LED, lighting it.
Consecutive LEDs in a bank are lit as the input voltage goes from high to low. The LM3915 is a
logarithmic display driver. Since the voltage divider response curve, and therefore the input, is roughly
logarithmic, a logarithmic driver better follows the response.
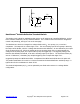
The input consists of the Bend Sensor
®
device in a simple voltage divider with R
M
. The resistor R
M
is
chosen to maximize the use of the Bend Sensor
®
device dynamics. Replacing R
M
with a resistor in series
with a pot will allow the user to adjust the sensitivity range of the Bend Sensor
®
device. As the pot is
adjusted to a low value, the high deflection dynamics of the Bend Sensor
®
device will be displayed.
When the pot is adjusted to a high value, the low deflection dynamics will be displayed.
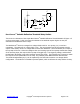
The display driver has an internal unity gain buffer at the input that isolates the Bend Sensor
®
device and
minimizes bias current errors. In the configuration shown, a 9 volt battery is used as the voltage source.
The top of the driver’s ladder is about 7.2 volts (3 diode drops below V+), while the bottom is at about
0.6 V (1 diode drop above ground). The input ranges from 7.8 volts (2 diode drops below V+) to
ground. At the output, R1 is used to control the amount of current drawn through the LEDs, and
therefore controls LED brightness. Pin 9 of the driver can be tied to the voltage source if bar output
instead of dot output is desired.