
Reference

Components
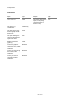
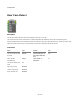
Connectors
Inputs Type Outputs Type
View to draw onto
View The same View as the
input, but anything
connected here is
drawn on top
View
The array of y-
coordinates
Float Array
The area of the view
that the graph will be
drawn into
Area
The pen defining the
colour, thickness and
style of the lines
Pen
Radius of the dots
(grid sq.)
Float
True if the graph is
centred on zero, False
otherwise
Boolean
True if you want to log
the x-axis, False
otherwise
Boolean
True if you want a
curved line, False
otherwise
Boolean
140 of 494