
Data Sheet


Diagnosing line voltage distortion..
Using an Oscilloscope
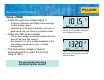
• Check the input line voltage
– Connect the oscilloscope to Phase and the ground
lead to Neutral
– The waveform reveals sine wave peaks that are
rounded, almost becoming a “flat top” (figure 3)
– When this occurs, the ratio between “peak” versus
“rms” measured values is smaller than 1.4, as it
should be
– Figure 4 shows a circuit with an ideal line voltage
wave shape
Figure 3.
Oscilloscope
waveform
displaying flat
top input line
voltage
Figure 4.
Ideal line
voltage
sine wave
The waveform distortion is caused by a
non-linear load attached to the same feeder
circuit, and not necessarily the VSD or motor