
Application Note


6 Fluke Corporation Using a Fluke ScopeMeter 125 to Troubleshoot FOUNDATION™ Fieldbus Installations
Signal quality and noise
In general conversation, sig-
nals on a bus are referred to as
“digital signals” as though they
change state from low to high
almost instantaneously. In real-
ity, that is not the case. For some
types of networks, the speed of
signal transitions is quite critical.
For Fieldbus networks, transi-
tion speeds, as such, are not so
critical. However, an excessive
slowdown in transitions can
eventually lead to signal attenu-
ation, if the transitions take so
long that the flat tops and bot-
toms of pulses do not stabilize.
For this reason, the Fluke 125
can record the rise and fall times
of pulses and reveal whether the
times are within either preset or
user-defined limits.
Transitions (edges) that are
too slow, may indicate that the
trunk section is too long, that the
cable is incorrectly specified or
damaged or that a terminator is
broken or missing. A check of the
transition times of the signal will
reveal any differences in this
parameter along the network
and, thereby, help identify hard-
ware faults.
Pulse overshoot is also an
indication of out-of-spec imped-
ances within a network. A
broken or missing terminator
or incorrect wiring can cause
such anomalies. So, excessive
overshoot should foster further
monitoring of the hardware.
If the network picks up noise
from other equipment, it will lead
to degradation of the signal’s
fidelity and will manifest itself
as noise on the waveform and
as instability of the edges. Such
instability is often called jitter,
which indicates that transitions
are not exactly in line with sys-
tem timing. Too much jitter may
lead to communication loss.
Visual waveform
inspection
Another level of analysis offered
by the Fluke 125 uses what is
known as the eye-pattern mode
to visually inspect signals on a
bus. Once the mode is selected,
the Fluke 125 screen shows the
waveshape of the ac-signal on
the bus. The eye-pattern applies
a long-lasting persistence mode
to the screen. Any curve drawn
will remain on screen until the
user decides to clear the screen
or to alter the mode of operation
of the instrument.
This dedicated scope mode
gives a user excellent insight
into bus-activity and into over-
all signal quality. (Of course,
there needs to be activity on the
bus for the scope to record any
curves.)
Slow-changing edges do not
necessarily indicate network
trouble, but great differences in
speed transition are grounds for
further investigation.
If only an occasional curve is
captured with an obviously dif-
ferent waveshape, chances are
that a single device has hard-
ware problems or is not powered
properly. Finding the location of
that device can be accomplished
by monitoring several different
points along the trunk while
taking into account normal sig-
nal attenuation. The closer to the
transmitting device that monitor-
ing occurs, the larger the signal
amplitude of the pulses from the
offending device will be.
Wide spreading of both the
high and low levels may serve
as an indicator of signal attenua-
tion along the trunk. Inconsistent
distribution of signal levels may
signal a discontinuity in the net-
work or a device that is putting
out a signal too low in amplitude.
The eye-pattern mode also
allows for an analysis of the
noise levels on the network.
Noise can interfere with the
signal and corrupt or halt com-
munications. Poor connections in
the cable shield or disconnected
shielding can allow the picking
up of disruptive noise levels.
Installing and routing
When motor drives are pres-
ent, install network cabling as
far away as possible from the
motor-drive output cables. Net-
work cables are more sensitive to
some devices’ power cables than
others. For instance, the cables
between a motor drive and the
motor are a likely source for
excessive noise.
Once noise is introduced into a
spur or a section of the trunk, the
noise signal is easily transferred
and will likely manifest itself at
various points on the network,
depending on how the network
routes the noise. That probability
means that a source of excessive
noise and a device with com-
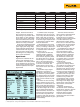
Figure 8: This series of Fluke 125 screens
show how the trace builds up over successive
acquisitions using the instrument’s eye-
pattern display mode.
Figure 9: A Fluke 125 screen showing a
cluttered and noisy signal.