
Datasheet

6 Fluke Corporation Fluke 430 Series II Three-Phase Energy and Power Quality Analyzers
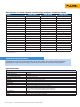
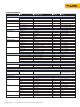
Flicker
Plt, Pst, Pst(1min) Pinst 0.00 to 20.00 0.01 ± 5 %
Unbalance
Volts % 0.0 % to 20.0 % 0.1 % ± 0.1 %
Amps % 0.0 % to 20.0 % 0.1% ± 1 %
Mains signaling
Threshold levels Threshold, limits and signaling duration is
programable for two signaling frequencies
— —
Signaling frequency 60 Hz to 3000 Hz 0.1 Hz
Relative V% 0 % to 100 % 0.10 % ± 0.4 %
Absolute V3s (3 second avg.) 0.0 V to 1000 V 0.1 V ± 5 % of nominal voltage
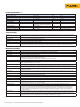
Trend recording
Method Automatically records min, max and average values over time for all readings being displayed for the three phases and neutral
simultaneously
Sampling 5 readings/s continuous sampling per channel, 100/120** reading/s for 1/2 cycle values and Pinst
Recording time 1 hr up to 1 year, user selectable (default setting 7 days)
Averaging time Minimum of 1 second
Memory Data is stored on SDcard (8GB included 32GB max)
Events 434-II: Tabulated in event list
435-II & 437-II: Tabulated in event list, including 50/60** waveform cycles and 7.5s 1/2 cycle rms Voltage and Amps trend
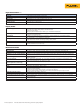
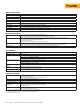
Measurement method
Vrms, Arms 10/12 cycle contiguous non-overlapping intervals using 500/416
2
samples per cycle in accordance with IEC 61000-4-30
Vpeak, Apeak Absolute highest sample value within 10/12 cycle interval with 40 μs sample resolution
V Crest Factor Measures ratio between the Vpeak and Vrms
A Crest Factor Measures ratio between the Apeak and Arms
Hz Measured every 10 sec in accordance with IEC61000-4-30. Vrms½, Arms½ Value is measured over 1 cycle, commencing at a
fundamental zero crossing, and refreshed each half-cycle.
This technique is independent for each channel in accordance with IEC 61000-4-30.
Harmonics Calculated from 10/12-cycle gapless harmonic group measurements on Voltage and Amps according to IEC 61000-4-7
Watt Full and fundamental real power display. Calculates average value of instantaneous power over 10/12 cycle period for each
phase. Total Active Power PT = P1 + P2 + P3.
VA Full and fundamental apparent power display. Calculates apparent power using Vrms x Arms value over 10/12 cycle period.
var Fundamental reactive power display. Calculates reactive power on fundamental positive sequence components. Capacitive and
inductive load is indicated with capacitor and inductor icons.
VA Harmonics Total disturbance power due to harmonics. Calculated for each phase and for total system based upon total apparent power and
fundamental real power.
VA Unbalance Unbalance power for total sytem. Calculated using symmetrical components method for fundamental apparent power and total
apparent power.
Power factor Calculated total watt/VA
Cos j Cosine of angle between fundamental voltage and current
DPF Calculated fundamental Watt/VA
Energy/energy cost Power values are accumulated over time for kWh values. Energy cost is calculated from user defined /kWh cost variable
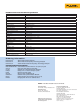
Unbalance The supply voltage unbalance is evaluated using the method of symmetrical components according to IEC61000-4-30
Flicker According to IEC 61000-4-15 flickermeter—functional and design specification.
Includes 230 V 50 Hz lamp and 120 V 60 Hz lamp models.
Transient capture Captures waveform triggered on signal envelope. Additionally triggers on dips, swells, interruptions and Amps level
Inrush current The inrush current begins when the Arms half cycle rises above the inrush threshold, and ends when the Arms half cycle
rms is equal to or below the inrush threshold minus a user-selected hysteresis value. The measurement is the square root of
the mean of the squared Arms half cycle values measured during the inrush duration. Each half-cycle interval is contiguous
and non-overlapping as recommended by IEC 61000-4-30. Markers indicate inrush duration. Cursors allow measurement of
peak Arms half cycle.
Mains signaling Measurements are based on: either the corresponding 10/12-cycle rms value interharmonic bin or the rms of the four nearest
10/12-cycle rms value interharmonic bins per IEC 61000-4-30. Limit setup for Monitor mode follows EN50160 standard limits.
Time synchronization Optional GPS430-II timesync module provides time uncertainty ≤ 20 ms or ≤ 16.7 ms for time tagging of events and time
aggregated measurements. When synchronization is not available, time tolerance is ≤ 1-s/24h
Product specifications cont.