
Operation Manual


Basic Cabling Testing
ACR
7
7-25
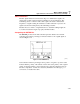
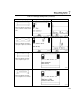
Figure 7-15 shows a plot of NEXT and attenuation limits, along with the resulting
ACR plot. Notice that the ACR is lower where NEXT and attenuation values are
near each other.
70.0
NEXT
GOOD
ATTEN.
GOOD
0 100
Frequency in MHz
Limit in dB
60.0
50.0
40.0
30.0
20.0
10.0
0.0
20 40 60 80
ACR
GOOD
oy37f.eps
Figure 7-15. A Plot of NEXT, Attenuation, and the Resulting ACR