
Specifications
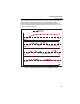
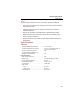
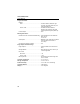
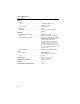

Visual IR Thermometer
Measurements
25
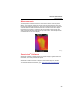
Measurements
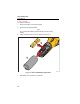
The temperature measurement of the center area is shown at the top of the
display. The emissivity setting also shows at the top of the display. When the
hot and cold markers are turned on, move the Product until the hot or cold spot
coincides with the middle measurement area. Point the Product at an object
that is likely to be hotter or colder than its surroundings for best results. The
value of the hot/cold point shows at the top of the screen. This example shows
a measurement on the VT04 display.
hak13a.jpg
Smartview
®
Software
Smartview
®
software contains features to analyze images, organize data and
information, and make professional reports.
Smartview includes a function to export IR and visible images as .is2 files.
To download Smartview software, go to: http://www.fluke.com/vtsmartview