® Fluke 434/435 Three Phase Power Quality Analyzer Users Manual EN April 2006, rev. 3, Dec. 2008 © 2006, 2007, 2008 Fluke Corporation, All rights reserved. Printed in The Netherlands All product names are trademarks of their respective companies.
Table of Contents Chapter Title Page General Aspects.................................................................................................1-1 Introduction.......................................................................................................... 1-1 Limited Warranty & Limitation of Liability........................................................ 1-2 Declaration of Conformity................................................................................... 1-3 Shipment Note ..
Fluke 434/435 Users Manual Input Connections..............................................................................................6-1 Introduction.......................................................................................................... 6-1 Input Connections ................................................................................................ 6-1 Scope Waveform and Phasor ...........................................................................7-1 Introduction..........
Contents (continued) Transients ...........................................................................................................14-1 Introduction.......................................................................................................... 14-1 Waveform Display ............................................................................................... 14-1 Tips and Hints......................................................................................................
Fluke 434/435 Users Manual Tips and Maintenance........................................................................................22-1 Introduction.......................................................................................................... 22-1 Cleaning the Analyzer and its Accessories .......................................................... 22-1 Storing the Analyzer ............................................................................................
Chapter 1 General Aspects Introduction This chapter informs you about a number of general and important aspects concerning the Fluke 434/435 Three Phase Power Quality Analyzer (hereafter referred to as ‘Analyzer’). This concerns: • Warranty and Liability Conditions. • Declaration of Conformity. • Shipment Note: Survey of items that should be included in your Analyzer Kit. • Contacting a Service Center.
Fluke 434/435 Users Manual Limited Warranty & Limitation of Liability Each Fluke product is warranted to be free from defects in material and workmanship under normal use and service. The warranty period is three years for the Analyzer and one year for its accessories. The warranty period begins on the date of shipment. Parts, product repairs and services are warranted for 90 days.
General Aspects Declaration of Conformity 1 Declaration of Conformity Declaration of Conformity for Fluke 434/435 Three Phase Power Quality Analyzers Manufacturer Fluke Industrial B.V.
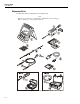
Fluke 434/435 Users Manual Shipment Note The following items are included in your Analyzer Kit: Note: When new, the Analyzer’s rechargeable NiMH battery is not charged. Refer to Chapter 4 – Powering the Analyzer. Figure 1-1.
General Aspects Contacting a Service Center # 1 Description 1 Power Quality Analyzer 2 Decal Set for Input Sockets 3 Hang Strap 4 Alligator Clips. Set of 5 5 Test Leads, 2.5 m.
Fluke 434/435 Users Manual See explanation in manual Direct Current Safety Approval Earth Double Insulation (Protection Class) Conformité Européenne Alternating Current Recycling information Disposal information Do not apply around or remove from hazardous live conductors. Do no dispose of this product as unsorted municipal waste. Go to Fluke’s website for recycling information Warning To avoid electrical shock or fire: • Review the entire manual before use of the Analyzer and its accessories.
General Aspects Safety Information: Read First • 1 For the BC430 use only AC line plug adapters or AC line cords that comply with local safety regulations. Slider switch on BC430 Battery Charger / Power Adapter to select line power voltage: 115V 230V Max. Input Voltage at Voltage Banana Inputs to Ground: Input A (L1), B (L2), C (L3), N to Ground: 1000 V Cat III, 600 V Cat IV. Max. Voltage at Current BNC Inputs (See marking): Input A (L1), B (L2), C (L3), N to Ground: 42 V peak.
Fluke 434/435 Users Manual 1-8
Chapter 2 About This Manual Introduction This Users Manual gives full and comprehensive information on how to use the Fluke 434 and 435 Three Phase Power Quality Analyzers effectively and in a safe manner. Read it carefully to learn about safe use of the Analyzer and its accessories and to take full advantage of all measuring modes. The Analyzer is also supplied with a printed Getting Started Guide which provides basic information and can be used as a quick reference.
Fluke 434/435 Users Manual - Logger (17) - Power Quality Monitoring (18). 2-2 • Chapter 19. Cursor and Zoom: how to investigate measurement details. • Chapter 20. Setting up the Analyzer: a comprehensive explanation of adjustments to customize measurements. • Chapter 21. Using Memory, printer and PC: how to save, recall and delete screenshots and data formats. How to make hard copies of measurement results and setup of communication with PC. • Chapter 22.
Chapter 3 Features Of Fluke 434/435 Introduction The Analyzer offers an extensive and powerful set of measurements to check power distribution systems. Some give a general impression of power system performance. Others are used to investigate specific details. This chapter gives an overview on how to perform measurements in a logical order. The measuring modes are described in detail in Chapter 7 to 18. Each measuring mode is explained in a separate chapter.
Fluke 434/435 Users Manual Measuring modes to investigate details Phase voltages. Should be close to the nominal value. Voltage waveforms must be a sine wave that is smooth and free from distortion. Use Scope Waveform to check the waveform shape. Use Dips & Swells to record sudden voltage changes. Use Transients mode to capture voltage anomalies. Phase currents. Use Volts/Amps/Hertz and Dips & Swells to check current/voltage relations.
Chapter 4 Basic Operations and Menu Navigation Introduction This chapter deals with a number of general aspects of the Analyzer’s operation: • Tilt Stand and Hang Strap • Powering the Analyzer • Display Brightness • Locking the keyboard • Menu navigation • Display Contrast • Reset to Factory Defaults Tilt Stand and Hang Strap The Analyzer has a tilt stand that allows viewing the screen at an angle when placed on a flat surface.
Fluke 434/435 Users Manual A hang strap is supplied with the Analyzer. The figure below shows how to attach the strap correctly to the Analyzer. Figure 4-2. Fixing the hang strap Powering the Analyzer The Analyzer has a built-in rechargeable NiMH battery that can power it for more than 6 hours when fully charged. When powered by the battery, the battery condition symbol in the screen header indicates the charge condition. This symbol ranges from fully charged .
Basic Operations and Menu Navigation Display Brightness 4 Caution To prevent decrease of battery capacity, charge it at least twice a year. Power On/Off: Press to power up or down with the last setup configuration. The welcome screen shows what Analyzer settings are currently in use. At power on a single beep can be heard. To save battery power, the Analyzer display dims automatically when no keys are operated during a certain time. This time is adjustable.
Fluke 434/435 Users Manual Highlight baudrate: . Adjust the required transmission speed. Highlight the Printer type you want to use: ENTER F5 . Press to confirm the selection. Press to return to the next higher menu SETUP USER PREF. This menu is the starting point for many adjustments such as Display Contrast Adjustment and Reset to Factory Defaults. Display Contrast Use submenu SETUP USER PREF as a starting point.
Chapter 5 Display Information Introduction The Analyzer uses five different screen types to present measuring results in the most effective way. The features these screens have in common are explained in this chapter. Details that are specific for a certain measuring mode are presented in the chapter explaining that mode. The screen header is presented in the selected information language. The figure below gives an overview of the screen types 1 .. 5; common features are explained under A ... F.
Fluke 434/435 Users Manual Phase Colors Measuring results belonging to different phases are presented with individual colors. If for a certain phase - voltage and current are displayed simultaneously, the voltage color has a dark tone and the current has a light tone. The set of phase colors can be chosen via the SETUP key and function key F4 – USER PREF. For detailed information see Chapter 20. Screen Types Below you will find a brief description of each screen type and its purpose.
Display Information Screen information common for all screen types 5 Screen information common for all screen types Refer to Figure 5-1, item A ... F A Measuring mode: the active measuring mode is shown in the screen header. B Measuring values: main numerical measuring values. Background colors differ per phase and for voltage or current. If Cursor is on, the values at the Cursor are shown. C Status indicators.
Fluke 434/435 Users Manual E Status line: following information appears on the screen. How to adjust these items is explained in Chapter 20 – General Settings. Following information is given: Date of Analyzer’s real time clock. Date format may be month-day-year or day-month-year. Time of day or cursor time. Nominal line voltage and frequency: are a reference for the measurements. GPS signal strength indicator. Number of phases and wiring configuration for the measurement.
Chapter 6 Input Connections Introduction This chapter explains how to make connection to the power distribution system under test and how to adjust the Analyzer settings. Check that the Analyzer setup meets the characteristics of the system under test and the accessories that are used. This concerns: • wiring configuration • nominal frequency • nominal voltage • properties of voltage leads and current clamps The actual setup is shown in the welcome screen that appears after power up.
Fluke 434/435 Users Manual Figure 6-1. Mounting the decals for voltage and current inputs De-energize power systems before making connections whenever possible. Always use appropriate equipment for personal protection. Avoid working alone and work according to the warnings listed in Chapter 1, Safety Information. For a 3-phase system make the connections as shown in Figure 6-2. Figure 6-2.
Input Connections Input Connections 6 Before making any measurements, set the Analyzer up for the line voltage, frequency, and wiring configuration of the power system you want to measure. This is explained in Chapter 20, General Settings. Scope Waveform and Phasor display are useful to check if voltage leads and current clamps are connected correctly.
Fluke 434/435 Users Manual 6-4
Chapter 7 Scope Waveform and Phasor Introduction Scope mode shows voltages and currents in the power system under test by means of waveforms or vector diagram. Also numerical values are shown such as phase voltages, phase currents, frequency, and phase angles between voltages and currents. Scope Waveform To access the Scope Waveform screen: c SCOPE The Scope Waveform screen offers an oscilloscope style of display of voltage and/or current waveforms with a fast update rate.
Fluke 434/435 Users Manual F4 Switch between voltage readout per phase (A/L1,B/L2,C/L3,N) or phase-to-phase (AB,BC,CA) for 3phase Y configuration. F5 Switch between HOLD and RUN of screen update. Cursor. When the Cursor is on, the waveform values at the Cursor are displayed in the screen header. Positioning the Cursor across the left or right screen end brings the next screen out of a maximum of 6 within viewing area. Zoom.
Scope Waveform and Phasor Tips and Hints 7 Tips and Hints Scope Waveform gives a clear view of current and voltage waveform shapes. Voltage waveforms in particular should be smooth and sinusoidal. If you see voltage distortion, it is a good idea to check the harmonics display. The rms voltages and frequency should be close to their nominal values. Waveform and Phasor display are also useful to check if voltage leads and current clamps are connected correctly.
Fluke 434/435 Users Manual 7-4
Chapter 8 Volts/Amps/Hertz Introduction Volts/Amps/Hertz displays a Meter screen with important numerical measuring values. The related Trend screen shows the changes over time of all values in the Meter screen. Meter screen To access the VOLTS/AMPS/HERTZ Meter screen: c MENU d ENTER The Meter screen gives an overview of voltages and currents in all phases. Also frequency and Crest Factors are shown. The Crest Factor CF indicates the amount of distortion: a CF of 1.
Fluke 434/435 Users Manual Available function keys: F1 Switch between voltage readout per phase (A/L1,B/L2,C/L3,N) or phase-to-phase (AB,BC,CA) for 3phase Y configuration. F4 Access to the Trend screen. For description see below. F5 Switch between HOLD and RUN of screen update. Switching from HOLD to RUN invokes a menu to select immediate (NOW) or TIMED start time which allows you to define start and duration of the measurement.
Volts/Amps/Hertz Tips and Hints 8 Zoom. Allows you to expand or shrink the display vertically or horizontally to view details or to fit a complete graph within the screen area. Zoom and Cursor are operated by the arrow keys and explained in Chapter 19. Offset and Span of the Trends are auto ranging for a good display in most cases, but they are adjustable when required. The adjustment menu is reached via the SETUP key and function key F3 - FUNCTION PREF. See Chapter 20, FUNCTION PREFerences.
Fluke 434/435 Users Manual 8-4
Chapter 9 Dips & Swells Introduction Dips & Swells records Dips, Interruptions, Rapid Voltage Changes, and Swells. Dips (Sags) and Swells are fast deviations from the normal voltage. Magnitude may be ten up to hundreds of volts. Duration may vary from a half cycle to a few seconds as defined in EN61000-4-30. The Analyzer allows you to choose nominal or sliding reference voltage. A sliding reference voltage uses measured values filtered with a 1minute time constant.
Fluke 434/435 Users Manual Figure 9-2. Characteristics of a voltage swell During an Interruption the voltage sinks well below its nominal value. In three phase systems an interruption begins when the voltage on all phases are below threshold and ends when one phase is equal to or above the interruption threshold plus hysteresis. The trigger conditions for interruptions are threshold and hysteresis. Interruptions are characterized by duration, magnitude and time of occurrence. Figure 9-3 explains this.
Dips & Swells Trend 9 Steady time Maximum voltage change Voltage tolerance Normal voltage Voltage step Rate of change Voltage tolerance Steady time Transition time Figure 9-4. Characteristics of a rapid voltage change In addition to the voltage, current is also recorded. This allows you to see cause and effect of deviations. Function key F4 – EVENTS accesses event tables where voltage events are listed in sequence.
Fluke 434/435 Users Manual The screen builds up from the right side of the screen and the corresponding values are displayed in the screen header. Available function keys: F1 Assign up/down arrow keys to select the voltage or current channels to be displayed. F2 Cursor on/off. F3 Assign the arrow keys to Cursor or Zoom operation. F4 Access to Events tables. F5 Switch between HOLD and RUN of screen update.
Dips & Swells Tips and Hints 9 The following Abbreviations and Symbols are used in the tables: Abbreviation Description Symbol Description CHG Rapid Voltage Change Rising voltage edge DIP Voltage Dip Falling voltage edge INT Voltage Interruption Change upwards SWL Voltage Swell Change downwards Available function keys: F3 Switch between NORMAL and DETAILED event table. F4 Return to Trend screen. F5 Access Trend screen with Cursor on and positioned on the highlighted event.
Fluke 434/435 Users Manual 9-6
Chapter 10 Harmonics Introduction Harmonics measures and records harmonics and interharmonics up to the 50th. Related data such as DC components, THD (Total Harmonic Distortion), and K-factor are measured. Harmonics are periodic distortions of voltage, current, or power sinewaves. A waveform can be considered as a combination of various sinewaves with different frequencies and magnitudes. The contribution of each of these components to the full signal is measured.
Fluke 434/435 Users Manual e ENTER The Bar Graph display shows the percentage contribution of each of the components related to the full signal. A signal without distortion should show a 1st harmonic (= the fundamental) at 100 % while the others are at zero: in practice this will not occur because there always is a certain amount of distortion resulting in higher harmonics. A pure sinewave becomes distorted when higher frequency components are added to it. Distortion is represented by the THD percentage.
10 Harmonics Meter screen Switch between HOLD and RUN of screen update. Switching from HOLD to RUN invokes a menu to select immediate (NOW) or TIMED start time which allows you to define start and duration of the measurement. F5 Meter screen To access the Harmonics Meter screen: f F3 The Meter screen display shows 8 measurements per phase. Using the SETUP key and function key F3 - FUNCTION PREF you can choose the screen contents. For detailed information see Chapter 18, FUNCTION PREFerences.
Fluke 434/435 Users Manual Available function keys: F1 Assign up/down arrow keys to select a row from the Meter screen for Trend display. F2 Cursor on/off. F3 Assign arrow keys to Cursor or vertical Zoom operation. F4 Return to Meter screen. F5 Switch between HOLD and RUN of screen update. Switching from HOLD to RUN invokes a menu to select immediate (NOW) or TIMED start time which allows you to define start and duration of the measurement.
Chapter 11 Power & Energy Introduction Power & Energy displays a Meter screen with all important power parameters. The related Trend screen shows the changes over time of all measuring values in the Meter screen. Fluke 434/435 can also display energy usage and offers verification of energy meters with a pulse output. For power calculations you can choose Fundamental or Full.
Fluke 434/435 Users Manual e ENTER The Meter screen displays power data for each phase and in total: real or active power (kW), apparent power (kVA, the product of rms voltage and current), reactive power (kVAR, the reactive component of apparent power caused by phase shift between AC current and voltage in inductors and capacitors), power factor (PF, the ratio of real power to apparent power for the total rms including harmonics), displacement power factor (DPF or cos ϕ, the ratio of real power to appar
11 Power & Energy Meter screen F1 F2 F3 F4 F5 Figure 11-1. Verification of an energy meter with pulse output Available function keys: F1 Switch between voltage readout per phase (A/L1,B/L2,C/L3,N) or phase-to-phase (AB,BC,CA) for 3phase Y configuration. F3 Switch Energy popup screen on. F4 Access Trend screen. For description see below. F5 Switch between HOLD and RUN of screen update.
Fluke 434/435 Users Manual Available function keys: F2 Pulse count mode on/off. F3 Switch Energy popup screen off. F4 Manual pulse count. For description see above. F5 Reset for Energy screen. Trend To access the Power & Energy Trend screen: g F4 The figures in the Meter screen are instantaneous values that update constantly. Changes in these values over time are recorded whenever the measurement is active.
11 Power & Energy Trend Available function keys: F1 Assign up/down arrow keys to select a row from the Meter screen for Trend display. The selected row is displayed in the screen header. F2 Cursor on/off. F3 Assign the arrow keys to Cursor or Zoom operation. F4 Return to Meter screen. F5 Switch between HOLD and RUN of screen update. Switching from HOLD to RUN invokes a menu to select immediate (NOW) or TIMED start time which allows you to define start and duration of the measurement. Cursor.
Fluke 434/435 Users Manual Tips and Hints Power mode can be used to record apparent power (kVA) of a transformer over several hours. Look at the Trend and find out if there are times that the transformer is overloaded. You can transfer loads to other transformers, stagger the timing of loads, or if necessary replace the transformer with a larger one. Interpretation of Power Factor when measured at a device: • PF = 0 to 1: not all supplied power is consumed, a certain amount of reactive power is present.
Chapter 12 Flicker Introduction Flicker quantifies the luminance fluctuation of lamps caused by supply voltage variations. The algorithm behind the measurement meets EN61000-4-15 and is based on a perceptual model of the human eye / brain sensory system. The Analyzer converts duration and magnitude of voltage variations into an ‘annoyance factor’ caused by the resulting flicker of a 60 W lamp. A high flicker reading means that most people would find the luminance changes irritating.
Fluke 434/435 Users Manual d e ENTER Flicker is characterized by: short term severity Pst (measured over 1 min for fast feedback), short term severity Pst (measured over 10 min) and a long term severity Plt (measured over 2 hours). This data and also the related D-parameters Dc, Dmax, and TD (acc. to EN61000-3-3) are displayed in the Meter screen. A popup Meter screen can be switched on to show the peak values of the D-parameters that occurred during the measurement.
12 Flicker Trend Trend To access Flicker Trend screen: g F4 The parameters in the Meter screen update over time. They are recorded whenever the measurement is on. Trend displays the changes in these values over time. All values in the Meter screen are recorded, but the Trends from each row in the Meter screen are displayed one at a time. Press function key F1 to assign the arrow keys to row selection. The Trend display may consist of 6 screens.
Fluke 434/435 Users Manual Tips and Hints Use the PF5 flicker trend and half-cycle voltage or current trends to find the source of flicker. Press function key F1 to assign the arrow keys to selection of flicker, voltage, and current trends. The 10 min (Pst) uses a longer measuring period to eliminate the influence of random voltage variations. It is also long enough to detect interference from a single source with a long working cycle such as electrical household appliances, and heat pumps.
Chapter 13 Unbalance Introduction Unbalance displays phase relations between voltages and currents. Measuring results are based upon the fundamental frequency component (60 or 50 Hz using method of symmetrical components). In a 3-phase power system, the phase shift between voltages and between currents should be close to 120°. Unbalance mode offers a Meter screen, a related Trend display, and a Phasor display.
Fluke 434/435 Users Manual The Meter screen shows all relevant numerical values: negative voltage unbalance percentage, zero sequence voltage unbalance percentage (in 4-wire systems), negative current unbalance percentage, zero sequence current unbalance percentage (in 4-wire systems), fundamental phase voltage, frequency, fundamental phase current, angle between phase-neutral voltages relative to the reference phase A/L1 and angles between voltage and current for each phase.
Unbalance Phasor 13 to define start and duration of the measurement. Cursor. When the Cursor is on, the Trend values at the Cursor are displayed in the screen header. Moving the Cursor off the left or right side of the screen brings the next of six screens into the viewing area. Zoom. Allows you to expand or shrink the display vertically or horizontally to view details or to fit a complete graph within the screen area. Zoom and Cursor are operated by the arrow keys and explained in Chapter 19.
Fluke 434/435 Users Manual Available function keys: F1 Selection of signals to be displayed: V displays all voltages, A displays all currents. A (L1), B (L2), C (L3), N (neutral) give simultaneous display of phase voltage and current. F3 Return to Meter screen. F4 Access to trend screen. F5 Switch between HOLD and RUN of screen update. Switching from HOLD to RUN invokes a menu to select immediate (NOW) or TIMED start time which allows you to define start and duration of the measurement.
Chapter 14 Transients Introduction The Fluke 434/435 Analyzer can capture waveforms at high-resolution during a variety of disturbances. The Analyzer will give a snapshot of the voltage and current waveforms at the precise time of the disturbance. This allows you to see the waveforms during dips, swells, interruptions, current swells and transients. Transients are fast spikes on the voltage (or current) waveform.
Fluke 434/435 Users Manual e ENTER f F3 g F5 In the Start menu you can choose a trigger event or a combination of trigger events, transients (Volt) and current (AMP) trigger level, and Immediate or Timed start of the measurement. The Analyzer may be set up to capture waveforms each time it sees: Voltage Transient, Voltage Swell, Voltage Dip, Voltage Interruption, or Current swell. Dips (sags) and swells are fast deviations from the nominal voltage.
14 Transients Tips and Hints Available function keys: F1 Selection of waveform set to be displayed: V displays all voltages, A displays all currents. A (L1), B (L2), C (L3), N (neutral) give simultaneous display of phase voltage and current. F2 Access submenu for Cursor and Zoom operation. F3 Assign up/down arrow keys to browse through all captured screens. F4 Switch between voltage readout per phase (A/L1,B/L2,C/L3,N) or phase-to-phase (AB,BC,CA) for 3phase Y configuration.
Fluke 434/435 Users Manual 14-4
Chapter 15 Inrush Introduction Inrush Currents can be captured by Fluke 434/435. Inrush Currents are surge currents that occur when a large, or low-impedance load comes on line. Normally the current will stabilize after some time when the load has reached normal working condition. For example the start-up current in induction motors can be ten times the normal working current. Inrush is a ‘single shot’ mode that records current and voltage Trends after a current event (the trigger) has occurred.
Fluke 434/435 Users Manual e ENTER f F3 Use the arrow keys in the Start menu to adjust the trigger limits: expected inrush time, nominal current, threshold, and hysteresis. The maximum current determines the vertical height of the current display windows. Threshold is the current level that triggers the trend capture. The inrush time is the time between trigger and the time that the current falls to the value indicated by Hysteresis and is indicated on the trend display between two vertical markers.
15 Inrush Tips and Hints Use Cursor and Zoom to investigate details of the recorded Trends. Selection of channels to be displayed is done with the up/down arrow keys. Press function key F1 to assign the arrow keys to this. Via the SETUP key and function key F3 - FUNCTION PREF you can set up the default values of the trigger limits (expected inrush time, maximum current, nominal current, threshold, hysteresis) and Offset and Span of the Trend display.
Fluke 434/435 Users Manual 15-4
Chapter 16 Mains Signaling Introduction Mains Signaling is a function available in the Fluke 435. In the Fluke 434 it is available as an option. Power distribution systems often carry control signals to switch appliances on and off remotely (also known as ripple control). These control signals have a frequency that is higher than the normal 50 or 60 Hz line frequency and range up to about 3 kHz. Amplitude is significantly lower than that of the nominal line voltage.
Fluke 434/435 Users Manual d e ENTER f F3 g F5 The traces build up from the right side. Readings in the header correspond to the most recent values plotted on the right. With the up/down arrow keys you can select readout as a percentage of nominal line voltage or as a 3 second average voltage (V3s). The Neutral conductor is not used for Mains Signaling, but is shown for troubleshoot purposes.
16 Mains Signaling Events Table Available function keys: F1 Assign up/down arrow keys to select a set of trends and the belonging readout. F2 Cursor on/off. F3 Assign the arrow keys to Cursor or Zoom operation. F4 Access to Events tables. F5 Switch between HOLD and RUN of screen update. Switching from HOLD to RUN invokes a menu to select Immediate or Timed Start and Duration of the measurement. Cursor. When the Cursor is on, the Trend values at the Cursor are displayed in the screen header.
Fluke 434/435 Users Manual Two ways to access Trend: 1. Use the up/down arrow keys to highlight an event in the table. To access Trend press the ENTER key. The Cursor is on, in the mid of screen and located on the selected event. 2. Press Function key F5 to view the Trend part showing the most recent measuring values. Cursor and Zoom can be switched on afterwards when required. Tips and Hints. To capture control signals it is essential to know their frequencies in advance.
Chapter 17 Logger Introduction Logger is a function available in the Fluke 435. In the Fluke 434 it is available as an option. Logger gives you the possibility to store multiple readings with high resolution. The readings are observed during adjustable time intervals. At the end of the interval the min, max, and average values of all readings are stored in a long memory and the next observation interval starts. This process continues for the Duration of the observation period.
Fluke 434/435 Users Manual e ENTER The set of readings to be logged is selectable in the menu under function key F1 – SETUP READINGS. With the up/down arrow keys you can select five sets of predefined readings (Default 1 – 5) and two sets of user definable readings (User 1, 2). Table 17-1 gives an overview of the readings available under Default 1 ... 5. This also gives you an impression of the readings available for logging. When ready press F5 – OK.
Logger Start Menu 17 Figure 17-3. Vfund available for logging Removing a selected reading: Use the arrow keys to highlight the reading to be removed from the ‘Selected’ column. Press function key F4 – REMOVE to remove the reading. You can highlight a reading in the ‘Selected’ column and move it upwards with function key F3 – MOVE. This reading then will appear at a higher level in the Trend and Meter screens with measuring data.
Fluke 434/435 Users Manual Table 17-1. Overview of readings available for Default 1 ... 5 Default 1 Default 2 Default 3 Default 4 Default 5 Volt Volt & Amp Volt & Amp & Power Volt & Amp & Power & Harm. Monitor Readings V rms V rms V rms V rms V rms V pk V pk V pk V pk A rms CF Volt CF Volt CF Volt CF Volt THD V ½ cycle V ½ cycle V ½ cycle V ½ cycle DC ...
Logger Trend 17 Available function keys in Start menu: F1 Access to Readings Select menu. F2 Access to the menu to define the name of the file with logging data. F3 Access to the menu to clear the memory reserved for logging data. F5 Start of the logging and access to Logging Trend screen. Trend To access the Logger Trend screen: f F5 All readings are recorded during logging, but not all of them are visible at a time.
Fluke 434/435 Users Manual trace in the viewing area. Zoom and Cursor are operated by the arrow keys and explained in Chapter 19. Offset and Span of the Trends are auto ranging for a good display in most cases, but they are adjustable when required. The adjustment menu is reached via the SETUP key and function key F3 - FUNCTION PREF. See Chapter 20, FUNCTION PREFerences Meter screen To access the Logger Meter screen: g F3 This screen displays all current readings of the logger function.
Logger Events 17 In Normal mode major event characteristics are listed: start time, duration, and voltage magnitude. Detail shows details of threshold crossings per phase.
Fluke 434/435 Users Manual 17-8
Chapter 18 Power Quality Monitoring Introduction Power Quality Monitoring or System Monitor displays a Bar graph screen. This screen shows whether important Power Quality parameters meet requirements. Parameters include: 1. RMS voltages 2. Harmonics 3. Flicker 4. Dips/Interruptions/Rapid Voltage Changes/Swells (DIRS) 5. Unbalance/Frequency/Mains Signaling. Figure 18-1 shows the screen and its properties.
Fluke 434/435 UNBALANCE FREQUENCY MAINS SIGNALING DIPS INTERRUPTIONS RAPID VOLTAGE CHANGES SWEELS B / L2 C / L3 A / L1 B / L2 C / L3 A / L1 B / L2 C / L3 A / L1 PER PHASE ALL PHASES Users Manual Figure 18-1. Power Quality Monitor Main Screen The length of a bar increases if the related parameter is further away from its nominal value. The bar turns from green to red if an allowed tolerance requirement is violated.
18 Power Quality Monitoring Introduction The meaning of the bar graphs with a wide base and a narrow top is explained below. By way of example this is done for the RMS voltage. This voltage for instance has a nominal value of 120 V with a tolerance of + and – 15% (tolerance range between 102 … 138 V). The momentary RMS voltage is constantly monitored by the Analyzer. It calculates an average from these measuring values across 10-minute observation periods.
Fluke 434/435 Users Manual The table below gives a survey of the aspects of Power Quality Monitoring: Parameter Available Bar Graphs Limits V rms 3, one for each phase Probability 100 %: upper & lower limit Probability x %: upper & lower limit 10 minutes Harmonics 3, one for each phase Probability 100 %: upper limit Probability x %: upper limit 10 minutes Flicker 3, one for each phase Probability 100 %: upper limit Probability x %: upper limit 2 Hrs.
18 Power Quality Monitoring Events Table d F5 Power Quality Monitoring is reached via the MONITOR key and a menu for Immediate or Timed start. With the left/right arrow keys you can position the Cursor on a particular Bar Graph. Measuring data belonging to the bar is shown in the screen header. Detailed measurement data is available under the Function keys: F1 RMS voltage: events table, trends. F2 Harmonics: bar graphs, events table, trends. F3 Flicker: events table, trends.
Fluke 434/435 Users Manual The following Abbreviations and Symbols are used in the tables: Abbreviation Meaning Symbol Meaning CHG Rapid Voltage Change High value of 100 % limit has been violated DIP Voltage Dip Low value of 100 % limit has been violated INT Voltage Interruption High value of x % limit has been violated SWL Voltage Swell Low value of x % limit has been violated Hx Number of the harmonic that violated its limits Unbalance event Change upwards Change downwards Available fu
18 Power Quality Monitoring Trend Display Two ways to access Trend: 1. Use the up/down arrow keys to highlight an event in the table. To access Trend press the ENTER key. The Cursor is on, in the mid of screen and located on the selected event. Zoom is set to 4. 2. Press Function key F4 to view the Trend part showing the most recent measuring values. Cursor and Zoom can be switched on afterwards when required.
Fluke 434/435 Users Manual Bar Graph Screen Figure 18-4. Bar Graph Screen The main system monitor display shows the worst harmonic for each of the three phases. Function key F2 brings up a screen with Bar Graphs showing the percentage of time each phase spent within limits for 25 harmonics and Total Harmonic Distortion (THD). Each Bar Graph has a wide base (representing an adjustable limit of e.g. 95 %) and a narrow top (representing the limit of 100 %).
Chapter 19 Cursor and Zoom Introduction This chapter explains how to use Cursor and Zoom to display and investigate details of Waveform, Trend, and Bar Graph displays. Cursor and Zoom have a certain amount of interaction and are both operated by the arrow keys. The Cursor is a vertical line that can be positioned on a point on a Waveform, Trend, or Bar Graph. The measured values at that point are displayed in the screen header.
Fluke 434/435 Users Manual Figure 19-3. Waveform display with cursor and zoom on Press Function key F2 to obtain a subset with keys to control Cursor and Zoom: • Press F3 to switch the Cursor on. Use the left/right arrow keys to move the Cursor horizontally along the waveforms. The value of the waveforms at the Cursor is displayed in the screen header as shown in Figure 19.2. • Press F4 to assign the arrow keys to Zoom operation as shown in Figure 19.3.
19 Cursor and Zoom From Events Table to Trend Display with Cursor On Figure 19-6. Trend display with cursor and zoom on The Function keys F1, F2, and F3 and the arrow keys are used to operate Cursor and Zoom: • Operate F2 to switch the Cursor on. Use the left/right arrow keys to move the Cursor horizontally along the trends. The value of the trends at the Cursor is displayed in the screen header as shown in Figure 19.5. Observe that the screen update stops now (recording of data continues!).
Fluke 434/435 Users Manual d ENTER Press ENTER to obtain trend display with the cursor on and positioned on the highlighted event in the table. Cursor on Bar graph Displays As an example the Three-phase Voltage Harmonics display as shown in Figure 19.7 is used. Cursor and Zoom for other Bar Graph displays function identically. Figure 19-7. Cursor on bar graphs On Bar Graph displays the Cursor is always on.
Chapter 20 Setting up the Analyzer Introduction The SETUP key accesses menus to view and change Analyzer settings. At delivery the Analyzer is adjusted to settings that match your local situation and the supplied accessories.
Fluke 434/435 Users Manual Figure 20-1. Welcome screen at power-on The Settings are grouped in four functional sections and are explained accordingly in four sections of this manual chapter: • General Settings: Date, Time, GPS time synchronization, wiring Configuration, nominal Voltage, nominal Frequency, current and voltage probe type, information language, survey and installation of options.
Setting up the Analyzer General Settings 20 General Settings To access the General Settings menus: 1. 2. SETUP F4 1 2 3 4 3. 5 6 7 8 4. ENTER F1 9 F2 10 F3 11 F4 12 F5 13 The actual settings are shown in the SETUP entry screen. Use the key operations described above to change an item. Read below how to make adjustments: 1 User name/address: see section USER PREFerences. 2 Date, Time: Use F3 to choose between date and time adjustment.
Fluke 434/435 Users Manual 20-4 6 Freq: adjustment of Nominal Frequency. Use the up/down arrow keys to select 60 or 50 Hz. Press Function key F5 – OK to confirm. 7 Limits: see section Limits Settings. 8 Clamp, A range, V scale: adjustment of the Analyzer to the characteristics of current clamps and voltage leads. The default selection is valid for the accessories as supplied with the Analyzer.
Setting up the Analyzer General Settings 20 Below you will find a step-by-step example on how to change wiring configuration to 3phase Wye IT (IT = Interrupted Terra = Interrupted Ground). c SETUP The active configuration is indicated behind Config. Config is highlighted indicating that this item can be adjusted when you press the ENTER key. The belonging configuration symbol is shown on the right side of the screen.
Fluke 434/435 Users Manual g F5 An information screen shows up that informs you on how to connect the Analyzer to the power system under test. When done press F5. h F5 Return to Setup entry screen. The new configuration is indicated behind Config. and the belonging configuration symbol is shown on the right side of the screen.
Setting up the Analyzer FUNCTION PREFerences 20 FUNCTION PREFerences To access the FUNCTION PREFerences menus: 1. SETUP F3 1 2 3 4 5 6 7 8 9 10 11 12 2. 3. F1 ENTER 13 F3 F1 14 15 F4 16 FUNCTION PREFerences allows you to customize data presentation of measuring functions. This concerns for instance Offset and Span of Trend and Waveform displays. The entry menu is available in the selected information language. The table below gives a survey adjustable items for each function.
Fluke 434/435 Users Manual Measuring Function/ Measuring Data to be adjusted Settings Type Screen Type 1. Scope Waveform/Phasor Volt, Amp (separate for Phase and Neutral) Range, Persistence On/Off Phasor rotation/Phase sequence, Angle +/- 2.
Setting up the Analyzer FUNCTION PREFerences 20 14 F2 – AGGREGation INTERVAL: access to the menu to choose between a 3 seconds aggregation interval of 150/180 cycles (50/60 Hz) or a 200 ms interval of 10/12 cycles (50/60 Hz). This feature is used for rms based readings in: Volts/Amps/Hertz, Power & Energy, Harmonics Table (Volt, Amp), Unbalance (Unbal (%), Vfund, Afund), Logger. The screen header indicates ‘3s’ if the 3 second interval is active.
Fluke 434/435 Users Manual g F4 Press function key F4 to select AUTO OFF. h Use the left/right arrow keys to decrease the Voltage offset. i Use the up/down arrow keys to select Volt span adjustment. Use the left/right arrow keys to increase the Voltage span. j F5 Press function key F5 three times to return to the Volts/Amps/Hertz trend screen with new offset and span. The trends are inside their window now. Function key F4 AUTO ON/OFF.
Setting up the Analyzer USER PREFerences 20 USER PREFerences To access the USER PREFerences menus: 1. SETUP F4 6 3. ENTER F2 F1 7 8 F3 9 F4 10 F4 11 USER PREFerences allows you to customize Phase Identification and Colors, Printer and RS-232 settings, Auto shut-off, Memory Configuration, definition of User name/address (as shown in entry screen), and display contrast. Many menus have a function key to reset to factory default settings.
Fluke 434/435 Users Manual 20-12 2 Phase Colors: use the function keys F1 ... F4 to choose colors as used in the USA, EU, UK, or according to IEC. Or define your own set of colors: use the up/down arrow keys to select a phase and use the left/right arrow keys to select a color. Press function key F5 – OK to confirm. 3 Printer: Use the arrow keys to select and adjust baudrate for use with a printer. Use the up/down arrow keys to select the printer type. Press function key F5 – OK to confirm.
Setting up the Analyzer Limits Adjustments 20 Limits Adjustments To navigate the Limits Setup menus: 1. SETUP 2. 3. 1 ENTER F1 2 1. 2. F2 5 F3 3 F4 6 F5 7 1. F5 2. F5 4 1. 2. 0...9 A...Z 1. 2. 3. 3. 4.
Fluke 434/435 Users Manual Limits Adjustments is used to save, recall, and define sets of limits for: • Power Quality Monitoring. • Dips/Interruptions/Rapid Voltage Changes/Swells. The entry menu is available in the selected information language. Read below how to do this: 20-14 1 Adjust Monitor Limits is the entry menu. It shows the main settings of the active set of limits: name, creation date, and a summary of limits data.
Setting up the Analyzer Limits Adjustments 7 20 Press Function key F5 – BACK to return to the SETUP entry menu. Setup of Monitor Limits, a survey of adjustments. Limits Adjustments 2 Probability percentages (100 % and adjustable): each with adjustable upper and lower limit. Harmonics For each harmonic 2 Probability percentages (100 % and adjustable): each with adjustable upper limit. Flicker Weighing curve (lamp type).
Fluke 434/435 Users Manual 20-16
Chapter 21 Using Memory, Printer, and PC Introduction This chapter explains how to save screens and data into the Analyzer’s memory and how to view, rename and delete them. The second part of the chapter explains how to setup the Analyzer for communication with a PC, laptop, and printer. Note: the Analyzer also has memories to store setups. How to change, save, and recall setups is explained in Chapter 20 Setup. Using memory The Analyzer has three ways of storing measuring results into memory: 1.
Fluke 434/435 Users Manual screenshot is saved as a file with date and time when saved. This occurs via a menu to define a name for the file to be saved. Name definition is done with the arrow keys: the up/down keys for character selection and the left/right keys for character position. Spaces are inserted with Function key F3. How to recall, print, and delete screenshots and how to rename them is explained in the next section ‘Memory Operations’.
Using Memory, Printer, and PC Use of Printer and PC 21 Recalling and deleting Screenshots and Datasets: d F1 Available function keys for recall and delete: F1 Return to main menu. F2 Access to the menu where you can view the highlighted screen shots and data sets. Use the Function keys PREVious or NEXT to view other files. Files are grouped in sequence of date and time. For data sets the entry screen is shown.
Fluke 434/435 Users Manual Figure 21-1. Location of optical interface When started, FlukeView software scans the PC ports to find the connected Analyzer. It is not necessary to adjust baudrate of PC and Analyzer. For other applications communication baudrate can be adjusted as follows: press the SETUP key, then Function key F4 – USER PREFerence, and then select RS-232 using the up/down arrow keys and ENTER. Then adjust the baudrate with the left/right arrow keys and leave the menu with F5 - BACK.
Using Memory, Printer, and PC Use of Printer and PC 21 Figure 21-3. Analyzer, printer DPU-414, and printer adapter cable PAC91 Note The Analyzer is adjustable to different baudrates for PC and printer.
Fluke 434/435 Users Manual 21-6
Chapter 22 Tips and Maintenance Introduction This chapter covers basic maintenance procedures that can be performed by the user. For complete service, disassembly, repair, and calibration information, see the Service Manual. You will find the part number of the Service Manual in section ‘Parts and Accessories’ in this chapter. Cleaning the Analyzer and its Accessories Clean the Analyzer and accessories with a damp cloth and a mild soap. Do not use abrasives, solvents, or alcohol.
Fluke 434/435 Users Manual Proceed as follows to activate the Advanced Functions: • Press the SETUP key to enter the SETUP entry menu. • Press Function key F2 to enter the VERSION & CALIBRATION menu. This readonly menu indicates the options already activated. Also the date of the last instrument calibration is indicated in the menu. • Press Function key F1 to enter the INSTALL OPTION menu.
22 Tips and Maintenance Troubleshooting Optional Accessories. Item Ordering Code Logger Functions for Fluke 434 (Mains Signaling, Logging). Fluke-434/Log Optical Isolated RS-232 Cable PM9080 GPS Synchronization Unit GPS430 Print Adapter for Parallel Printers PAC91 Optical Isolated Trigger Probe (to test energy meters) ITP120 AC Current Clamp 200 A (10 mV/A) and 20 A (100 mV/A) switcheable. i200s AC Current Clamp 2000 A (1 mV/A) and 200 A (10 mV/A) switcheable, flexible.
Fluke 434/435 Users Manual Screen remains black. Make shure that the Analyzer is on: at power-on you should hear a double beep. If the screen remains black, you might have a problem with the screen contrast. Proceed as follows to change Contrast: • Press the SETUP key. • Press Function key F4. • Press the left or right arrow key for five seconds to return to normal display. Operation time of fully charged battery is too short. The Battery may be in poor condition.
Chapter 23 Specifications Introduction Performance Characteristics Fluke guarantees the properties expressed in numerical values within the tolerances stated. Numerical values without tolerances are typical and represent the characteristics of an average instrument excluding accessories. The Analyzer meets the specified accuracy 30 minutes and two complete acquisitions after power-on.
Fluke 434/435 Users Manual Electrical Measurements The following specifications of the instrument are verified using the “implementation verification” table 3 as specified in 61000-4-30 chap-6-2.
23 Specifications Electrical Measurements DISPLAY MODES Waveform display Available in Scope and Transient mode Captures 8 waveforms simultaneously Display update rate 5x per second Up to 10/12 times horizontal zoom Cursors: Single vertical line showing min, max, avg reading at cursor position.
Fluke 434/435 Users Manual MEASUREMENT MODES 23-4 Scope Vrms, Arms, Vcursor, Acursor, Vfund, Afund, Hz, V phase angles, A phase angles Volts/Amps/Hertz Vrms, Vpk, V Crest Factor, Arms, Apk, A Crest Factor, Hz Dips and Swells Vrms½, Arms½ Captures up to 1000 events with date, time, duration, magnitude and phase identification with programmable thresholds Harmonics DC, 1 … 50 Harmonic Volts, THD Volt, Harmonic Amps, THD Amps, K Amps, Harmonic Watts, THD Watts, K Watts, Interharmonic Volts4, Interhar
23 Specifications Electrical Measurements ACCURACY, RESOLUTION AND RANGE Volt/Amps/Hertz Measurement Range Resolution Accuracy Vrms(AC+DC) Fluke 435 1…600 Vrms 0.01 Vrms Fluke 434 600…1000 Vrms 1…1000 Vrms 0.01 Vrms 0.1 Vrms Vpk 1…1400 Vpk 1V 5% of nominal voltage Voltage Crest Factor (CF) 1.0 ... > 2.8 0.01 ± 5% 0…20.00 kArms1 0…20.00 kArms1 0…40 / 400 Arms 30…3000 Arms 0,001…10 Arms1 0,001…10 Arms1 0.1 and 1 Arms 1 Arms ± 0.5% ± 5 counts3 ± 1% ± 5 counts3 ± 1% ± 5 counts3 ± 0.
Fluke 434/435 Users Manual Harmonics Resolution Accuracy Harmonic order (n) DC, 1..50 Grouping: Harmonic groups according to IEC 61000-4-7 Inter-Harmonic order Off, 1..49 Grouping: Harmonic and Interharmonic subgroups according to IEC 61000-4-7 Filtering When measuring harmonics with interharmonics off, harmonics group is used and a 1.5 s smoothing filter is active.
23 Specifications Electrical Measurements Power and Energy Watt (VA, VAR) Fluke 435 Fluke 434 Measurement Range Resolution Accuracy 1.0 … 20.00MW1 1 1.0 … 20.00MW 0.1 … 1 kW1 1 0.1 … 1 kW ± 1% ± 10 counts3 3 ± 1.5% ± 10 counts 00.00 kWhr…200.0 GWhr1 00.00 kWhr…200.0 GWhr1 0.01 Xhr….100 Whr1 ± 1% ± 10 counts3 0.01 Whr….100 Whr1 ± 1.5% ± 10 counts3 Power Factor 0…1 0.01 ± 0.033 Cos ϕ / DPF 0…1 0.01 ± 0.
Fluke 434/435 Users Manual Transient capture Measurement Range Volts cursor reading rms reading ± 6000 Vpk 10 … 1000 Vrms Minimum detect duration 5 µs Sampling rate 200kS/s Resolution Accuracy ± 15% of cursor reading ± 2.5% of Vnominal 1V 1V Inrush mode Measurement Range Arms (AC+DC) 0.000 … 20.00 kArms1 0.001.. 10 Arms1 ± 1% of meas ± 5 counts Inrush Duration mm:ss:mmm between 7.
23 Specifications Electrical Measurements Dips & Swells mode Sampling 100/1202 readings/sec continuous sampling per channel Recording time From 90 sec with 25msec display resolution up to 450 days with 3 hr display resolution. Zoom Up to 12x horizontal zoom Memory 3600 min, max and avg points for each reading Duration 90 s Resolution 25 ms 50 ms 100 ms 180 s 6 min. 12 min. 200 ms 30 min. 1 hr 2.5 hr 7.5 hr 15 hr 30 hr 500 ms 1s 2.5 s 7.
Fluke 434/435 Users Manual Logger mode Sampling Combination of 5 readings/sec and 100/1202 readings/sec continuous sampling per channel depending on the parameter measured Recording time Depends on selected readings and averaging time Zoom Two zoom positions, display all or 1x Memory User configurable shared memory, upt to 15 MB on Fluke 435, Up to 7 MB on Fluke 4344 Nr of readings on 3 phases + N 1 10 100 Averaging time 0.5 s 10 min 2 hr 0.5 s 10 min 2 hr 0.
23 Specifications Electrical Measurements MEASUREMENT METHOD Vrms, Arms 10/122 or 150/180 (selectable) cycle contiguous non overlapping intervals using 500/4162 samples per cycle in accordance with IEC 61000-4-30 Vpeak, Apeak Absolute highest sample value within 10/122 cycle interval with 40µs sample resolution V Crest Factor Measures ratio between the Vpeak and Vrms A Crest Factor Measures ratio between the Apeak and Arms Hz Measured every 10 sec in accordance with IEC61000-4-30 Vrms½ ,Arms½ V
Fluke 434/435 Users Manual Mains Signaling Measurement are based on: either the corresponding 10/12-cycle r.m.s. value interharmonic bin or the rms of the four nearest 10/12-cycle rms value interharmonic bins per IEC 61000-4-30 Limit setup for Monitor mode follows EN50160 “Meistercurve” Time Synchronisation Optional GPS430 timesync module provides time uncertainty ≤ 20 ms or ≤ 16.7 ms2 for time tagging of events and time aggregated measurements.
23 Specifications Electrical Measurements Memory Screens 50 screen memories Data 10 data memories for storing data including recordings Logger User configurable shared memory, up to 15 MB on Fluke 435, Up to 7 MB on Fluke 4344 Limit templates 2 preprogrammed, 2 administrator (programmable via FlukeView), 2 user locations Real-time clock Time and date stamp for AutoTrend, Transient display and SystemMonitor MECHANICAL Size 256 x 169 x 64 mm Weight 2kg POWER Line power Switchable 115V, 230V a
Fluke 434/435 Users Manual COMMON MODE REJECTION RATIO (CMRR) CMRR >60 dB SAFETY Compliance with IEC/EN61010-1-2001, CAN/CSA C22.
23 Specifications Electrical Measurements ELECTRO MAGNETIC COMPATIBILITY (EMC) Compliance with Frequency Fluke 434/435, including standard accessories, conforms to the EEC directive 2004/108/EC for EMC immunity as defined by EN-613261:2006 , with the addition of the table below No Visible Disturbance Disturbance < 0.5 % 80 – 400 MHz All ranges 400 – 600 MHz All other ranges 600 MHz – 1 GHz All ranges 1.4 – 2 GHz (3V/m) All ranges 2 – 2.
Fluke 434/435 Users Manual 23-16
Index —1— 150/180 cycle, 5-3, 20-8 —3— 3 s, 5-3, 20-8 —A— A range, 20-4 Accessories, 1-1 Active power, 11-2 Aggregation interval, 5-3, 20-8 Apparent power, 11-2 Auto On/Off, 20-7 —B— Banana Inputs, 6-1 Bar Graph screen, 5-2 Battery Charger, 1-6 Battery Condition, 22-1 Battery save, 20-12 BNC Inputs, 6-1 Brightness, 4-3 —C— Calibration, 23-1 Capacitive load, 11-2 CF, 8-1 Change Offset and Span, 20-9 Change wiring config, 20-5 Characteristics, 23-1 Charge Batteries, 4-2 CHG, 9-5, 17-7, 18-6 Clamp, 20-4 C
Fluke 434/435 Users Manual Fluke 435, 3-1 Freq, 20-4 Frequency nominal, 5-4 Full, 11-1 Function Preferences, 20-7 Fundamental, 11-1 —G— Getting Started, 2-1 GPS signal, 5-4 GPS Time, 20-2 —H— Hang Strap, 4-1 Harmonics, 10-1 , 18-6 Hysteresis, 9-1, 15-2 —I— Inductive load, 11-2 Inputs, 6-1 Inrush currents, 15-1 Inrush time, 15-2 INT, 9-5, 17-7, 18-6 Interharmonics, 10-1 Interruptions, 9-1 —K— Keyboard Lock, 4-3 K-factor, 10-1 kVA, 11-2 kVAR, 11-2 kW, 11-2 —L— Language, 20-4 Limits, 5-4 Limits Setup, 20
Index (continued) Signaling, 16-1 Single phase, 6-2 Sliding reference voltage, 9-1 Softkeys, 5-4 Span, 20-7 Standard parts, 22-2 Status indicators, 5-3 Status line, 5-4 Stickers, 6-1 Storage, 22-1 Stretch display, 19-1 Swells, 9-1 SWL, 9-5, 17-7, 18-6 Symbols, 5-3, 18-6 System Monitor, 18-1 Sytem Monitor, 3-1 —U— —T— —W— Meter screen, 5-2 Technical data, 23-1 THD, 10-1 Threshold, 9-1, 15-2 Tilt Stand, 4-1 Time, 5-3, 5-4 Transients, 14-1 Trend screen, 5-2 Trigger conditions, 20-7 Troubleshooting, 22-3 —
Fluke 434/435 Users Manual 4