92B/96B/99B/105B ScopeMeter Users Manual 4822 872 00724 March 1996, Rev. 4, 1/99 1996, 1999 Fluke Corporation. All rights reserved. Printed in the Netherlands All product names are trademarks of their respective companies.
I TABLE OF CONTENTS CHAPTER 1 INTRODUCING YOUR SCOPEMETER TEST TOOL SCOPEMETER TEST TOOL FEATURES . . . . . . . . . . . . . . . . . . . . . . . . . . . . . . . . . . . . . . . . . . . . . . . 1-2 USING THE HOLSTER AND THE TILT STAND . . . . . . . . . . . . . . . . . . . . . . . . . . . . . . . . . . . . . . . . . . 1-3 POWERING THE SCOPEMETER TEST TOOL . . . . . . . . . . . . . . . . . . . . . . . . . . . . . . . . . . . . . . . . . . 1-4 MINIMIZING SIGNAL NOISE . . . . . . . . . . . . . . . . . . . . .
92B/96B/99B/105B II CHAPTER 4 Users Manual USING THE DUAL DISPLAY MODE FUNCTIONS MAKING CONNECTIONS . . . . . . . . . . . . . . . . . . . . . . . . . . . . . . . . . . . . . . . . . . . . . . . . . . . . . . . . . . . 4-2 SELECTING A MAIN MODE . . . . . . . . . . . . . . . . . . . . . . . . . . . . . . . . . . . . . . . . . . . . . . . . . . . . . . . . . 4-3 SELECTING RANGES (MANUAL/AUTO RANGE) . . . . . . . . . . . . . . . . . . . . . . . . . . . . . . . . . . . . . . .
III CHAPTER 6 USING ADDITIONAL CAPABILITIES MAKING MEASUREMENTS USING THE CURSORS . . . . . . . . . . . . . . . . . . . . . . . . . . . . . . . . . . . . . 6-2 DELETING MEMORIES . . . . . . . . . . . . . . . . . . . . . . . . . . . . . . . . . . . . . . . . . . . . . . . . . . . . . . . . . . . . . 6-6 SAVING TO MEMORY . . . . . . . . . . . . . . . . . . . . . . . . . . . . . . . . . . . . . . . . . . . . . . . . . . . . . . . . . . . . . . 6-7 RECALLING FROM MEMORY . . . . . . . . . . . . . . . . . . . .
92B/96B/99B/105B IV CHAPTER 9 Users Manual APPENDIXES APPENDIX 9A APPENDIX 9B APPENDIX 9C APPENDIX 9D APPENDIX 9E SPECIFICATIONS . . . . . . . . . . . . . . . . . . . . . . . . . . . . . . . . . . . . . . . . . . . . . . . . . . . . 9-3 PARTS AND ACCESSORIES . . . . . . . . . . . . . . . . . . . . . . . . . . . . . . . . . . . . . . . . . . 9-15 PM8907 INFORMATION . . . . . . . . . . . . . . . . . . . . . . . . . . . . . . . . . . . . . . . . . . . . . . 9-19 WARRANTY AND SERVICE CENTERS . . . . . . .
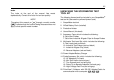
VI ABOUT THIS MANUAL Chapter 1 Introducing the ScopeMeter Test Tool This chapter introduces features and capabilities of your ScopeMeter test tool. Chapter 2 Getting Started This chapter provides a 15-minute demonstration intended for those who are not familiar with the ScopeMeter test tool. Chapter 3 Making Measurements This chapter explores all measurements and specifies the use of the direct Measure Menu key. At any time, you can choose over 30 measurements to get an immediate reading on the display.
VII Index The index at the end of the manual lists words alphabetically. Consult this list to find an item quickly. NOTE Throughout this manual an through a model number ( 92B ) indicates that the function being discussed does not apply to that specific model number. UNPACKING THE SCOPEMETER TEST TOOL KIT The following items should be included in your ScopeMeter® test tool kit (also see the yellow shipment card): 1. ScopeMeter test tool 2. NiCad Battery Pack (installed) 3. Protective Holster 4.
2B/96B/99B/105B VIII WARNING READ "SAFETY" CAREFULLY BEFORE USING YOUR SCOPEMETER TEST TOOL. Users Manual International electrical symbols used are explained below. Caution (see explanation in manual) DOUBLE INSULATION (Protection Class) SAFETY Common (Lo) input symbol, equal potential Recycling symbol The instrument described in this manual is designed to be used only by qualified personnel.
IX The ScopeMeter test tool uses a three-lead connection system for dual input, isolated (electrically floating) measurements. The connections for isolated and grounded measurements are shown in the following illustration. WARNING DO THE FOLLOWING TO AVOID ELECTRICAL SHOCK COM (COMMON) IF A SCOPEMETER TEST TOOL INPUT IS CONNECTED TO >42V PEAK (30V RMS): 1. USE ONLY THE TEST LEAD/PROBE SET SUPPLIED WITH THE SCOPEMETER TEST TOOL (OR SAFETY-DESIGNED EQUIVALENTS WITHOUT EXPOSED METAL CONNECTORS). 2.
X If Safety-Protection is Impaired Use of equipment in a manner not specified may impair the protection provided by the equipment. Before use, inspect probes for mechanical damage and replace damaged probes! Whenever it is likely that safety has been impaired, the instrument must be turned off and disconnected from line power. The matter should then be referred to qualified personnel.
XI DECLARATION OF CONFORMITY for Sample tests Standards used: FLUKE 92B/96B/99B/105B ScopeMeter® Series II Test Tool EN 61010-1 (1993) Safety Requirements for Electrical Equipment for Measurement, Control, and Laboratory Use Manufacturer Fluke Industrial B.V.
92B/96B/99B/105B XII Single Input Connection with Mini Test Hook Single Input Connection with HF Adapter Dual Input Connections with Mini Test Hooks Dual Input Connections with HF Adapters Users Manual Figure 2. Input Connections for High Frequency Electronic Measurement WARNING To prevent electric shock and personal injury, Mini Test Hooks and HF Adapters must not be connected to any voltage higher than 42V peak (30V rms) to earth. Always pay attention to the markings on the accessories.
XIII Single Input Connection with High Voltage Test Pin Single Input Connection with Industrial Alligator Clips (PM9084/001 & AC20) Single Input Connection with High Voltage Test Pin & AC20 Dual Input Connections with Industrial Alligator Clips (PM9084/001 & AC20) Figure 3.
Chapter 1 Introducing your ScopeMeter Test Tool SCOPEMETER TEST TOOL FEATURES . . . . . . . . . ScopeMeter Features . . . . . . . . . . . . . . . . . . . . . . . Scope Capabilities . . . . . . . . . . . . . . . . . . . . . . . . . Digital MultiMeter Capabilities . . . . . . . . . . . . . . . . USING THE HOLSTER AND THE TILT STAND . . . . POWERING THE SCOPEMETER TEST TOOL . . . . . MINIMIZING SIGNAL NOISE . . . . . . . . . . . . . . . . . . . CHARGING THE BATTERY . . . . . . . . . . . . . . . . . . . .
1-2 92B/96B/99B/105B Users Manual SCOPEMETER TEST TOOL FEATURES Scope Capabilities Your ScopeMeter test tool combines the capabilities of an easy-to-use digital storage oscilloscope with the versatility of a digital multimeter. When you select a measurement function, the test tool automatically chooses the best setup to analyze and compare complex waveforms, or simply to read voltage levels. • Triggering includes external triggering and TV line selector.
Introducing The ScopeMeter Test Tool 1-3 USING THE HOLSTER AND THE TILT STAND The ScopeMeter test tool is cradled in a holster that provides shock protection during rough handling. All keys and connections are accessible with the holster in place. You will need to remove the holster only to replace the batteries. (See Chapter 8 for battery replacement instructions.) RELEASE HERE The test tool is also equipped with a multiposition tilt stand, allowing viewing from different angles.
1-4 92B/96B/99B/105B Users Manual POWERING THE SCOPEMETER TEST TOOL The test tool can be powered from any of the following sources. Refer to Figure 1-2. • Internal Battery Pack (PM9086) A rechargeable NiCad Battery Pack comes installed in every test tool. • C Cell Batteries You can use four alkaline batteries in place of the NiCad Battery Pack. (The charger is defeated when standard C cells are installed).
Introducing The ScopeMeter Test Tool MINIMIZING SIGNAL NOISE In general, using your test tool on battery power only will minimize noise pickup. Using the 10:1 probe will help in noise rejection. If you use the Power Adapter (PM8907), connect a test lead from the black 4-mm banana jack COM (common) to the measurement common (ground) of the system under test. This technique reduces or eliminates any power line related noise.
1-6 92B/96B/99B/105B CHARGING THE BATTERY WARNING TO AVOID ELECTRICAL SHOCK, USE ONLY A BATTERY CHARGER THAT IS AUTHORIZED FOR USE WITH SCOPEMETER TEST TOOL. Use the following procedure to charge the battery pack and power the instrument: 1. Connect the Power Adapter/Battery Charger to line voltage. 2. Insert the Power Adapter/Battery Charger low voltage plug into the Power Adapter connector of the ScopeMeter test tool. The test tool can now be used while the NiCad batteries charge slowly.
Introducing The ScopeMeter Test Tool LOOKING AT ALL MEASUREMENT CONNECTIONS The ScopeMeter test tool provides four signal connection points: two safety BNC jack inputs (red INPUT A and grey INPUT B) and two safety 4-mm banana jack inputs (COM EXT.mV). This arrangement is shown in Figure and Ω 1-3. All connections are positioned within a protective recess at the top of the instrument. The banana jacks are also used as Waveform Generator Output.
1-8 92B/96B/99B/105B Users Manual RS-232 Optical Interface Connection The Optically Isolated RS-232 Adapter/Cable (PM9080) can be connected to the test tool for printer output and computer interface. Using the FlukeView software for DOS and Windows adds the following functionality to your ScopeMeter test tool: Storing of measurements in memory for later retrieval. Comparing of measurements with reference examples. Storing, analyzing, and documenting measurements.
Introducing The ScopeMeter Test Tool Reading a Dual Display Main Display: Displays the numeric readings combined with a full screen-width waveform display. Bottom Display: Displays the menu that provides choices available through the function keys and shows which are active. Reading a Scope Display Top Display: Identifies the voltage range, type of signal coupling, selected probe type for INPUT A and INPUT B, time scale, trigger source, and trigger slope.
1 - 10 92B/96B/99B/105B USING THE KEYS Users Manual The keys with a predefined function, regardless of the test tool's mode, are called keys or hard keys. Usally they give access to a menu, where items can be selected. The two yellow keys and ways to find your measurement. provide the possible gives immediate access to a list of measurements. When you choose a measurement, the test tool automatically selects the related main mode. gives access to the Main menu.
Introducing The ScopeMeter Test Tool 1 - 11 Figure 1-6 shows the basic navigation of the test tool. Yellow Yellow Dark grey Hard key Dark grey SubMenu Structure Most common Functions also found under Figure 1-6. Basic Navigation , , , The five blue keys , and are called function keys. These keys change function based on the present active menu. Actual function key definitions appear on the bottom display. Function keys and windows work together to provide a complete menu-driven user interface.
1 - 12 92B/96B/99B/105B STEPPING THROUGH A WINDOW The fixed sequence is as follows: When a window appears, the assignments to the function keys change as follows: is the 'CLOSE' key, which closes the active window. is the 'CANCEL' key, which ignores changed selections and closes the active window. is the 'SELECT ITEM' key, which opens and closes a list box and selects the highlighted item. 1. Stepping through a window has a fixed sequence as shown in Figure 1-7. 3.
Introducing The ScopeMeter Test Tool 1 - 13 USING ON-LINE INFORMATION You can get information about functions at any time by pressing . The short descriptions will help you understand how the test tool functions. When you operate the ScopeMeter test tool, the display provides information about the present condition or explains procedures taking place and asks for confirmation. These messages are always displayed in a box. More information is available by pressing .
Chapter 2 Getting Started ADJUSTING THE DISPLAY . . . . . . . . . . . . . . . . . . . . Adjusting the Contrast . . . . . . . . . . . . . . . . . . . . . . Using the Backlight . . . . . . . . . . . . . . . . . . . . . . . . SELECTING THE PROBE TYPE . . . . . . . . . . . . . . . . 2-3 2-3 2-3 2-4 POWER-ON CONFIGURATIONS . . . . . . . . . . . . . . . Master Reset (Default Startup) . . . . . . . . . . . . . . . Power-on/save memory . . . . . . . . . . . . . . . . . . . . PERFORMING AN EASY SETUP . . . . . .
2-2 92B/96B/99B/105B This chapter provides a 15-minute demonstration intended for those who are not familiar with the ScopeMeter test tool. It gives some hands-on experience, with an emphasis on learning by seeing and doing. Those who are familiar with the test tool can skip the following pages and continue to Chapter 3. • Press to turn on the test tool. Operation begins in the last-known configuration. Factory default settings are used at the first power-on.
Getting Started 2-3 ADJUSTING THE DISPLAY Using the Backlight Adjusting the Contrast You can set the backlight to high or low intensity. At poweron, the backlight is set to high intensity. High intensity becomes extra high when the test tool is connected to the line power. • Use to adjust the contrast of the display to your preference. Note that new contrast adjustment of the display is stored in memory until a new adjustment is made. To set the backlight intensity, do the following: 1.
2-4 92B/96B/99B/105B Users Manual SELECTING THE PROBE TYPE POWER-ON CONFIGURATIONS To prevent measurement errors, ensure that your test tool is adapted to your probe at power-on. Note that the PM8918 probes, delivered with the test tool, have an attenuation of 10:1. There are two different ways to reset the ScopeMeter test tool: the Master Reset, and the power-on/save memory. For accurate measurement, periodic probe calibrations are necessary. This is explained in Chapter 8, "User Maintenance".
Getting Started 2-5 Power-on/save memory This procedure also resets the ScopeMeter test tool and sets the probe range to 10:1. The Reset does not clear the memories. 1. Turn the test tool off. 2. Press and hold . 3. Press and release . The test tool turns on, and you should hear a double beep. input: A PROBE 10:1 appears on the display. 4. Release . Use this feature when you have saved a setup, screen, or waveforn in memory.
2-6 1. 92B/96B/99B/105B + Users Manual Perform a Reset at Power ON. At power-on, all five function key definitions in the bottom display are assigned to the Main menu. Notice that METER is highlighted. Ensure the probe range is 10:1, as indicated on the display. The screen displays a True-rms AC voltage and a DC voltage in large numbers, and the frequency (in Hz) in smaller numbers. An additional scope trace gives a graphical representation of the waveform. 2.
Getting Started 2-7 3. 4. Open the VOLT measurement menu; a list of the voltage measurements appears on the display + Use these keys to choose a measurement. For now, highlight Vrms AC+DC. 5. Press this function key to select Vrms AC+DC. The selected Vrms AC+DC reading appears as the main top reading on the display. The previous readings are now shifted down one. Note that the Hz has been removed. 6. Open the TIME measurement menu; a list of the time-related measurements appears on the display.
2-8 92B/96B/99B/105B Users Manual 8. Some measurements are done in another mode. This message appears in a double-lined box on the display: "This measurement is possible in SCOPE mode. Change to SCOPE mode now ?". 9. The test tool changes automatically to the Scope mode. You can now find the Rise Time measurement result below the waveform area. 10. The left and right cursors move across the display. The intersection of waveform and cursor mark the level for the two horizontal cursors.
Getting Started 2-9 If you have not already done so, perform a 1. Input A + reset. The range increases and ranging is set to MANUAL. A Vrms AC and a V DC reading appear, and the amplitude of the graphical representation decreases. 2. Press this key once to measure a stable display. TOUCH HOLD appears in the top right of the display. 3. Press this key once again to resume new measurements. 4. Press this key. The range decreases.
2 - 10 92B/96B/99B/105B Users Manual 6. Open the Meter-submenu mode. The five function keys are now assigned to the metersubmenu identifiers. 7. Open the More Meter window. The window enables you to change several settings in Meter mode. 8. Go to the next page and find more settings that you can change. 9. Close the window again, without changing the setup configuration of the test tool. This completes the Meter Operations demo; continue with the Scope Operations.
Getting Started 2 - 11 If you have not already done so perform a + reset. 1. Activate the Scope Mode, then press . An image of the waveform appears on the display. The top display shows the attenuator, probe, time base, and trigger information. 2. The waveform amplitude decreases. The attenuator scale in the top display changes to a less sensitive range. Input A 3. The number of periods of the waveform increases. The time base scale in the top display changes to a slower time/DIV. 4.
2 - 12 92B/96B/99B/105B Users Manual 6. The test tool automatically selects attenuation, time base, and triggering to give you a readable display of the waveform. 7. Press this to look at the Trigger menu now. 8. This begins to display as the waveform rises above the trigger level (+SLOPE) or falls below the trigger level (-SLOPE). Watch the display; the waveform starts at a different place as trigger + or - is selected. Continue with +SLOPE selected. 9. This activates the ADJUST LEVEL function.
Getting Started 2 - 13 10. Adjust the trigger level: the " a " icon moves upward as you change the trigger level. When the level is more than the waveform value, RUN changes into NOTRIG, and the display becomes unstable; your test tool is no longer triggered. 11. Adjust the trigger level to about 50% of the waveform amplitude, so that your test tool is triggered again. 12. Turn your ScopeMeter test tool off. You are now able to operate basic functions in routine applications.
Chapter 3 Making Measurements MAKING CONNECTIONS . . . . . . . . . . . . . . . . . . . . . . 3-2 USING THE MEASUREMENT FUNCTIONS . . . . . . . 3-3 USING A SHORTCUT TO MOST COMMONLY MEASUREMENTS . . . . . . . . . . . . . . . . 3-9 ORDERING MEASUREMENT READINGS . . . . . . . 3-10 MEASURING FUNCTIONS NOT AVAILABLE FROM THE MEASURE MENU . . . . . . Additional measurements for Meter and EXT.mV modes . . . . . . . . . . . . . . . . . . . . . . Additional measurements for the Scope mode . . MEASUREMENTS MAP . .
3-2 92B/96B/99B/105B Users Manual MAKING CONNECTIONS ScopeMeter test tool measurement connections are illustrated in Figure 3-1. Use the red INPUT A BNC jack or the red and black 4 mm banana jacks for measurements. The ScopeMeter test tool informs you when to use INPUT A or the banana jacks. The red 4-mm banana jack is used for diode test, continuity test, Ohm measurement, and when you use a Current or Temperature probe with banana jacks.
Making Measurements 3-3 USING THE MEASUREMENT FUNCTIONS Use the Measure menu to choose one or more automatic measurements. Simply choose your desired measurement and the test tool sets itself up and displays the result. • Regardless of the mode you are in, press access the Measure menu. to Measure Menu Press (MORE MEASURE) to access a multipaged (seven pages) list of all possible measurements. Press (PREVIOUS PAGE) and (NEXT PAGE) to step through the pages in the More Measure window.
3-4 On a page, use and to highlight the desired measurement, then press to select. This activates your chosen measurement and closes the window. The measurement result is instantly displayed on the screen. See Figure 3-2 for screen examples in Dual Display mode and Scope mode. 92B/96B/99B/105B Users Manual The measurements in the More Measure window are listed below. Page 1 of 7: OHM Ω Measure the resistor value (Ω) of a resistor connected to the red and black 4-mm banana jacks.
Making Measurements 3-5 Page 2 of 7: NOTE INPUT A in Meter mode can make separate V DC and Vrms AC measurements on the same signal at the same time. V DC and Vrms AC readings are normally displayed together. V DC METER Measure the DC (direct) voltage of the input signal in Meter mode. Vrms AC METER Measure the RMS (Root Mean Square) voltage of the input signal in Meter mode. This is done with DC- coupled input.
3-6 Page 4 of 7: A DC METER Measure the DC current in Meter mode with a Current probe (available as an option) that is connected to the INPUT A BNC. This is done with DCcoupled input. A list box enables you to select the proper range: 1, 10, 100 mV/A, or 1 V/A. A AC METER Measure the AC current in Meter mode with a Current probe (available as an option) that is connected to the INPUT A BNC. This is done with DCcoupled input. A list box enables you to select the proper range: 1, 10, 100 mV/A, or 1 V/A.
Making Measurements Page 5 of 7: Hz METER Measure the frequency of the input signal in Meter mode. Hz SCOPE Measure the frequency of the waveform in Scope mode. At least 11/2 cycles of this waveform must occur between the cursors. duty cycle + METER Measure the ratio between the time the signal is positive to the total period time in Meter mode. It is shown as a percentage figure. duty cycle - METER Measure the ratio between the time the signal is negative to the total period time in Meter mode.
3-8 92B/96B/99B/105B Users Manual Page 7 of 7: RPM 1 METER (revolutions per minute) Measure one count per revolution in Meter mode. RPM 2 METER (revolutions per minute) Measure one count per two revolutions in Meter mode. dt (delta time) SCOPE Measure the time difference between the (vertical) cursors in Scope mode. 1/dt (frequency) SCOPE Measure the relative frequency of the waveform in Scope mode. It is shown as the reciprocal value of the time difference (dt) between the vertical cursors.
Making Measurements 3-9 USING A SHORTCUT TO MOST COMMONLY MEASUREMENTS • From the Measure menu, you can also find many most commonly used measurements directly under one of the function keys , , , or . Press one of the four function keys to choose the type of measurement: V, Hz, dB, or TIME. This opens a single window with a list of measurements within the chosen type.
3 - 10 ORDERING MEASUREMENT READINGS At default, three measurement readings are displayed at the same time, although you can display up to four readings. See Chapters 4 and 6 for more information. When you exceed the number of selected readings, all readings shift down one and your latest chosen measurement is placed on top. Notice that the previous bottom reading is then removed.
Making Measurements dBm AC (decibel milliwatt) Measure the power ratio of the AC component of a signal with respect to 1 mW in Meter mode. This is done with DC-coupled input. dBm AC (no DC) (decibel milliwatt) Measure the power ratio of the AC and DC components of a signal with respect to 1 mW in Meter mode. This is done with AC-coupled input so that the DC signal component is blocked and the range is optimized for the AC sinal component.
3 - 12 92B/96B/99B/105B Users Manual MEASUREMENTS MAP The measurements can be selected in various menus. The following Measurements map shows where you can find all measurements.
Making Measurements 3 - 13 MAIN MENU MEASURE MENU Power Measurements dBV DC dBV AC dBV AC+DC dBV AC (no DC) dBm DC dBm AC dBm AC+DC dBm AC (no DC) dBW DC dBW AC dBW AC+DC dBW AC (no DC) WATT DC WATT AC WATT AC+DC WATT AC (no DC) Time Measurements pulse width dt 1/dt rise time t1 from TRIG t2 from TRIG phase • • • • • • • • • • • • • • • • • • • • • • • • • • • • • • • • • • • • • • • • • • • • • • • •
3 - 14 92B/96B/99B/105B Users Manual MAIN MENU MEASURE MENU Ampere Measurements A DC A AC A AC+DC A AC (no DC) Temperature Measurements °C °F Resistance Measurements Ohm Continuity Diode Measurements Diode • • • • • • • • • • • • • • • • • •
Chapter 4 Using the Dual Display Mode Functions MAKING CONNECTIONS . . . . . . . . . . . . . . . . . . . . . . 4-2 SELECTING A MAIN MODE . . . . . . . . . . . . . . . . . . . . 4-3 SELECTING RANGES (MANUAL/AUTO RANGE) . . . . . . . . . . . . . . . . . . . . . 4-7 HOLDING A STABLE MEASUREMENT (TOUCH HOLD) . . . . . . . . . . . . . . . . . . . . . . . . . . . . 4-8 DISPLAYING MINIMUM MAXIMUM READINGS WITH RELATED TRENDPLOT . . . . . . . . 4-9 Generating a Min Max TrendPlot with the Fluke 92B . . . . . . .
4-2 92B/96B/99B/105B Users Manual MAKING CONNECTIONS ScopeMeter test tool measurement connections are illustrated in Figure 4-1. Scope only Use the red INPUT A BNC jack for Scope and Meter modes. Use the grey INPUT B BNC jack as a second input for Scope measurements. The red and black 4-mm banana jacks are used for , , and modes. For low frequency measurements (up to about 2 MHz), ground can be connected to the black 4-mm banana jack.
Using the Dual Display Mode Functions 4-3 SELECTING A MAIN MODE At power-on, the main menu at the bottom of the display is always shown. To get the main menu from another menu or screen, press . Main menu Choose a main mode with any of the function keys: , , , , or . The measuring result is then displayed. INPUT A and INPUT B are used to measure the signal waveforms. You can set the amplitude of both waveforms, time base speed, and triggering for an optimum trace display.
4-4 92B/96B/99B/105B If necessary, you can select the range of both the scope trace and meter display, and the time base speed. • Press to select the desired attenuation. Ranges are from 1V to 3 kV (Vrms: 2.5 kV) with 10:1 probe, or from 100 mV to 300V (Vrms: 250V) with direct 1:1 input. • Press to select the desired time base; ranges are from 1 µs to 100 ms/div. Resistance mode. A resistor connected to the red and black 4-mm banana jack inputs is measured.
Using the Dual Display Mode Functions The measurement result is displayed as a 3 2/3-digit display. The ranges are 30Ω (manual only), 300Ω, 3 kΩ, 30 kΩ, 300 kΩ, 3 MΩ, and 30 MΩ. A beeper alert is generated at <5% of a selected range in Manual Range mode. The beeper alert is turned on with ALERT ))). Diode test mode. A diode connected to the red and black 4-mm banana jack inputs is tested. The measurement current through the diode is 0.5 mA.
4-6 EXTernal milliVolt function. Signals supplied to the red and black 4-mm banana jack inputs are measured. The red banana jack is the high input, and the black banana jack (COM) is the low. The ranges are 300 mV, and 3V. Time base ranges are from 1 µs to 100 ms/div. Use this mode for low voltages and for the accessories available for the ScopeMeter test tool.
Using the Dual Display Mode Functions SELECTING RANGES (MANUAL/AUTO RANGE) In manual range, the input attenuator range can be changed by pressing the INPUT A key or , when these are assigned to . If in auto range, this switches automatically to manual range, and MANUAL appears in the top right of the display. The selected attenuator and time base ranges are shown on the display. The desired time base range can be selected by pressing .
4-8 92B/96B/99B/105B Users Manual HOLDING A STABLE MEASUREMENT (TOUCH HOLD) The Touch Hold function captures the next stable measurement and a beep indicates that a stable measurement has been made. When the Touch Hold function is turned on, the numeric display is frozen (held) until a stable measurement is detected. Stable measurements are defined as: • • • • Within +/-100 display counts for 1s. Above 200 display counts for dc signals. Above 300 display counts for ac signals.
Using the Dual Display Mode Functions 4-9 DISPLAYING MINIMUM MAXIMUM READINGS WITH RELATED TRENDPLOT The MIN MAX recording function is used to display several characteristics of the present main reading over time in the form of readings and a graphical plot (Min Max TrendPlot™). Five readings appear on the display (see the display example in Figure 4-3). The top reading (in large characters) indicates the actual main reading. This is the same main reading as before MIN/MAX recording was started.
4 - 10 92B/96B/99B/105B Generating a Min Max TrendPlot with the Fluke 92B With the Fluke 92B, you can generate a Min Max TrendPlot of the present main reading, as follows: 1. Press • • Recording is now in progress. 3. Press to stop recording. The display freezes to allow you to examine the results. Notice that you can use and to change the time stamp preference selected under step 2. to exit TrendPlot. 5.
Using the Dual Display Mode Functions Using 'Time from start' or 'Time of day' stamps with the Fluke 96B, 99B, or 105B You can select the recording time stamps to indicate the time relative to the start of recording ('Time from start') or to indicate the internal clock time and date ('Time of day'). To make this selection, do the following: 1. Press to open the Min Max TrendPlot menu. 2. Press menu. (MORE) to open the MORE TRENDPLOT 3. Use press to highlight TIME REFERENCE; then to select. 4.
4 - 12 92B/96B/99B/105B Stopping Recording, Freezing the Display, and Examining the Results While recording is in progress, you can press at any time to stop recording. HOLD appears in the top right of the display and the display is frozen. This allows you to examine the results. If you press TrendPlot. Users Manual Examining a Record from Memory with the Fluke 96B, 99B, or 105B When you generate a Min Max TrendPlot, then exit this function, the record is automatically stored in memory.
Using the Dual Display Mode Functions 4 - 13 SELECTING THE SCOPEMETER KEY SUBMENU From any main mode, you can access the main mode submenu by pressing for more control over the selected mode. Figure 4-4 shows the METER mode submenu. Figure 4-5. More Meter Mode Figure 4-4. METER Mode Submenus In , , , and modes you can choose the functions ALERT ))), Zero ∆, FAST/SMOOTH, and RESET READING directly with one of the function keys. Or you can find these functions in the Submenu MORE window.
4 - 14 MAKING MEASUREMENTS IN METER AND EXT.mV MODE In Meter and EXT.mV mode you can make the same measurements as found in the Measure Menu. To find these measurements, select ADD MAIN READING in the Submenu MORE window. This opens a list of all possible measurements. For more details of the measurements, see Chapter 3. 92B/96B/99B/105B Users Manual TAKING RELATIVE READINGS (SCALING) Scale Main Reading displays the present measurement result with respect to a defined range.
Using the Dual Display Mode Functions Readings as a Percent Change from Reference Point (Zero %∆) Select "ZERO %∆" to set the present upper reading as the relative reference. Subsequent readings are displayed as a percentage of variation (delta) from this point. The figure below shows percentage change (tolerance) when measuring a resistor: 4 - 15 Readings Displayed as a Percent of Scale (0%-100%) Scaling starts automatically when both 0% and 100% values have been entered as the scaled reference values.
4 - 16 A typical scaling display is shown in the figure below: 92B/96B/99B/105B Users Manual Scaling in Combination with Min Max Trendplot™ Recording To generate a Min Max Trendplot of a scaled reading, proceed as follows: • • Select a reading you want to scale. • Start the Trendplot function, as described in the previous section. Select an appropriate reference for the reading, as described in "Taking Relative Readings (Scaling)" in this chapter.
Chapter 5 Using in Scope Mode MAKING CONNECTIONS . . . . . . . . . . . . . . . . . . . . . . MAKING AN EASY SETUP . . . . . . . . . . . . . . . . . . . . CONTROLLING INPUTS A AND B . . . . . . . . . . . . . . Selecting the Input . . . . . . . . . . . . . . . . . . . . . . . . . Selecting the Input Coupling . . . . . . . . . . . . . . . . . Capturing Glitches . . . . . . . . . . . . . . . . . . . . . . . . . Reversing the Polarity of the Displayed Waveform . . . . . . . . . . . . . . . . . . . .
USING THE MIN MAX ENVELOPE FUNCTION OF THE FLUKE 92B . . . . . . . . . . . . . . . Using the Min Max Envelope Function . . . . . . . . USING THE SCOPE RECORD AND MIN MAX ENVELOPE FUNCTIONS OF THE FLUKE 96B, 99B, or 105B . . . . . . . . . . . . . . . . Using the ScopeRecord™ function . . . . . . . . . . . Examining the ScopeRecord™ . . . . . . . . . . . . . . Using the Min Max Envelope Function . . . . . . . . 5-21 5-21 5-22 5-23 5-24 5-25 MAKING COMBINATIONS WITH INPUT A AND INPUT B . . . . . . . . . . .
Using in Scope Mode 5-3 MAKING CONNECTIONS Scope connections are illustrated in Figure 5-1. Maximum scope inputs on either BNC are as follows: • • Maximum input signal voltage: 300V rms direct • Voltage to ground: Maximum input signal voltage: 600V rms when using 10:1 probe 600V rms Input impedance is 10 MΩ/15 pF with the 10:1 probe. • Press and to select the Scope mode.
92B/96B/99B/105B 5-4 MAKING AN EASY SETUP CONTROLLING INPUTS A AND B Continuous Auto Set automatically selects the optimum settings for connected input signals and keeps track of any variation of the signal. Start Continuous Auto Set by pressing . For most signals, the ScopeMeter test tool will automatically set inputs, amplitudes, time base setting, and triggering for an optimum display. Press or Users Manual to open the input settings menu. Figure 5-2.
Using in Scope Mode Capturing Glitches Press on INPUT A to turn GLITCH DETECTion on. This function displays the events that occur between two samples on INPUT A. INPUT B is turned off. The events can be glitches or other asynchronous waveforms that are 40 ns (nanoseconds) or wider. Reversing the Polarity of the Displayed Waveform Press to open the MORE INPUT window. Highlight INPUT A (or INPUT B) and press to open the list box. You can turn on and off an input and invert the INPUT A and INPUT B display.
92B/96B/99B/105B 5-6 Users Manual ADJUSTING THE TIME BASE Press to increase or decrease the number of periods. The time base readout is on the second row of the top display. Refer to Figure 5-3. Available settings depend on the acquisition mode in effect, and are as follows: • • • Recurrent 5ns (10ns)/DIV - 1s/DIV Single 100ns/DIV - 1s/DIV Roll 2s/DIV - 60s/DIV * Fluke 92B and 96B : Fluke 99B and 105B : * 10ns/DIV 5ns/DIV The time base can be changed in increments of 1, 2, and 5 (e.g.
Using in Scope Mode 5-7 POSITIONING THE WAVEFORM ON THE DISPLAY Considerable flexibility is offered in moving the trace(s) around the display. and reposition the trace up or down maximum four divisions. This operation can be done separately for each input. The key simultaneously repositions all traces left or right from -4 to +16.5 divisions. Waveform positioning is demonstrated in Figure 5-4. Figure 5-4.
92B/96B/99B/105B 5-8 ACQUIRING WAVEFORMS Choosing Recurrent or Single Acquisition You can instruct the ScopeMeter test tool to continuously update its display, giving you a dynamic look at waveform activity as it occurs (RECURRENT). You can also tell the test tool to update its display only once, yielding a snapshot record of waveform activity (SINGLE), termed "SingleShot" elsewhere in this manual. From the Scope Submenu, press to highlight RECURRENT for continuous display updates.
Using in Scope Mode 5-9 Using "Zoom" to Increase or Decrease Time Resolution Zoom displays a waveform with increased time resolution, giving up to 1000x magnification. Use the following procedure to Zoom in a waveform: 1. Press 2. Use the zoom". and 3. Press to select. bottom of the display. keys to highlight "scope appears in the right 4. Press to enlarge the waveform (speed up the time base) or press to shrink the waveform (slow down the time base).
92B/96B/99B/105B 5 - 10 SELECTING THE SCOPE SUBMENU From the Scope mode, press to open the Scope mode submenu. This gives you more control over the Scope mode. Figure 5-6 shows the Scope Submenu. Figure 5-6. Scope Submenu Refer to Chapter 6 for descriptions of the and (CURSOR READING) function key. (ZERO Capturing 10 or 20 Divisions This enables you to capture either 10 or 20 divisions of waveform detail. Selecting 10 divisions, or one full screen, is sufficient for most applications.
Using in Scope Mode 5 - 11 Smoothing the Waveform (Average) The test tool can average multiple samples of a waveform, allowing for noise suppression without loss of bandwidth. To select average in the Scope mode, do the following: Additional information about smoothing appears in Chapter 6. Waveform samples with and without averaging are shown in Figure 5-9. 1. From the More Scope window, highlight AVERAGE WAVEFORMS. 2. Press to open the list box. 3.
92B/96B/99B/105B 5 - 12 Users Manual TRIGGERING Trigger Basics Triggering tells the ScopeMeter test tool when to begin displaying the waveform. You can select which input signal should be used as the source, on which edge this should occur, and at what waveform level it should occur. Finally, you can tell the test tool to delay the waveform to be displayed with a specified time delay, number of cycles, or number of events. The second top row on the display identifies the trigger parameters being used.
Using in Scope Mode • Press 5 - 13 to open the Trigger menu. • GENERATOR 92B 96B . See Chapter 6 for more information. NOTE EXTERN and GENERATOR are mutually exclusive; selecting one deactivates the other. Figure 5-11. Trigger Menu Selecting a Trigger Source Press to enter the MORE TRIGGER window, then highlight TRIGGER SOURCE and press to open the list box. Select one of the following trigger sources: INPUT A, INPUT B, EXTERN 2V (via external trigger input), EXTERN 0.
92B/96B/99B/105B 5 - 14 Users Manual Adjusting the Trigger Level To adjust the test tool’s trigger level, do the following: Types of trigger delays are discussed below. In many instances, you can select more than one type of delay. 1. Select INPUT A or INPUT B as trigger source. (The trigger levels of the other sources are fixed.) Press 2. Press to open the ADJUST LEVEL box. Use and to adjust the trigger level. Observe the trigger icon (e.g. a ) as you adjust the trigger level. 3.
Using in Scope Mode The TV Triggering Function The TV trigger function allows you to examine frames, fields, and lines of TV signals for various TV systems. 5 - 15 Overview of the TV Trigger functions To use the TV trigger function, press ; then press to open the TV trigger menu shown in Figure 5-12. You can select one of the following three TV trigger functions: 1. LINES is used to trigger on the synchronization pulse of all lines (horizontal synchronization). Figure 5-12. TV Trigger Menu 2.
92B/96B/99B/105B 5 - 16 Users Manual Selecting TV System and Scan Rate To verify or change TV trigger settings, do the following: Before using TV triggering, make sure that the test tool is set for the correct TV system and scan rate. The TV system setting is shown at the top of the display, as shown in Figure 5-13. 1. From the TV Trigger Menu (see Figure 5-12): Press to display the TV trigger settings in the MORE TRIGGER menu. This menu lists all of the present TV trigger settings. 2.
Using in Scope Mode 5 - 17 Using the LINES Trigger Function With this function, all lines are displayed. The test tool triggers on the horizontal synchronization pulse (line sync). Using the FRAME Trigger Function With this function, the test tool triggers on vertical synchronization pulses (frame sync). To activate the LINES trigger function, open the TV trigger menu (see Figure 5-12); then press to highlight LINES. The top of the display now indicates the Lines function (see Figure 5-13).
92B/96B/99B/105B 5 - 18 Users Manual Using the SELECT LINE Trigger Function With this function, the test tool can trigger on any specific line in a frame. To select a line, refer to Figure 5-12 and do the following: 1. From the TV Trigger Menu, press (SELECT LINE) to display the select line menu (see Figure 5-14). 1) 1) 2) 1) 1) These menu options are disabled (blank) for noninterlaced setting. 2) This menu option is disabled (blank) if 4-FIELD SEQUENCE is off (not highlighted). Figure 5-14.
Using in Scope Mode 5 - 19 NOTE When viewing signals from an interlaced video system, you may need to use the 4-field sequence function to get a stable display, as described in the next section, "Using the 4-Field Sequence Function". 4. To begin the waveform display at some time before or after the trigger point, press (TIME DELAY) on the TV trigger menu; then use to increase or decrease the time delay. Note that the waveform shifts to the right or the left while doing so.
92B/96B/99B/105B 5 - 20 Users Manual To use the 4-field sequence function, do the following: 1. From the TV trigger menu, press SEQUENCE). (4-FIELD OFF NOTE 4-FIELD SEQUENCE When you have set 'TV system: VIDEO Non-interlaced' in the MORE TRIGGER menu, the 4-FIELD SEQUENCE menu option is disabled (not visible on the display shown in Figure 5-14). ON 2. To look at the other phase or amplitude, press (NEXT FRAME). The 4-field sequencer then triggers on the other frames and discards the previous frames.
Using in Scope Mode 5 - 21 USING THE MIN MAX ENVELOPE FUNCTION OF THE FLUKE 92B This function displays changes in the shape of a waveform as a grey area around the actual trace. It keeps track of minimum and maximum values that occur over time. Using the Min Max Envelope Function To use this function, do the following: 1. Press . NOTE Any change in attenuation or time base will start a new Min Max envelope recording. 2.
B/96B/99B/105B 5 - 22 USING THE SCOPE RECORD AND MIN MAX ENVELOPE FUNCTIONS OF THE FLUKE 96B, 99B, or 105B In SCOPE mode, press to access the waveform recording functions (see Figure 5.16). You can use these functions to examine waveform changes over time. Figure 5-16. Recording Menu Users Manual The recording functions are as follows: SCOPE RECORD This is a fast electronic 'chart recorder' kind of function with 30k of memory. The large memory allows you to record startup events.
Using in Scope Mode Using the ScopeRecord™ function Before you start the ScopeRecord, make the following preparations: 1. Determine whether you need a single ScopeRecord that stops when the record memory is full (SINGLE SWEEP), or a continuous ScopeRecord that stops only by pressing . To make this selection, do the following: (a) From the Min Max Record menu, press (MORE) to open the menu. (b) Use to highlight TRACE REPEAT; then press to select. (c) Highlight the desired option; then press to select. 2.
92B/96B/99B/105B 5 - 24 Examining the ScopeRecord™ To examine a ScopeRecord, do the following: 1. From the Min Max Record menu press (EXAMINE). See Figure 5-16. The following menu appears: Figure 5-17. Examine menu 2. Use to scroll horizontally through the ScopeRecord. The box above the and keys (zoom box) moves in the corresponding direction to indicate the ScopeRecord location currently displayed. Users Manual 3. Use (ZOOM in) and (ZOOM out) to increase and decrease the time resolution.
Using in Scope Mode 5 - 25 Using the Min Max Envelope Function To start this function, do the following: 1. From the Min Max Record menu press ENVELOPE). (MIN MAX NOTE Any change in attenuation or time base will start a new Min Max envelope recording. 2. To turn off Min Max envelope recording, do one of the following: • • Press , Press . .
92B/96B/99B/105B 5 - 26 MAKING COMBINATIONS WITH INPUT A AND INPUT B Press on INPUT B to select A+B to show INPUTS A and B added together or to select A-B to show INPUT B subtracted from INPUT A. You can also choose A+B and A-B from the MORE INPUT A or MORE INPUT B window. Highlight COMBINE A & B, and press to open the list box. You can also select A versus B to provide a plot with INPUT A on the vertical axis and INPUT B on the horizontal axis. Press to activate your selection.
Using in Scope Mode ADAPTING THE DISPLAY 5 - 27 FULL adds a crosshatch pattern based on the horizontal time and vertical amplitude divisions on the display. You can adapt the display to your preference as follows: 1. Press 2. Press . to open the Display Menu window. Selecting a Dot Size 3. Use to highlight DOT SIZE and press to open the list box. Figure 5-18. Grid Selection 4. Choose a dotsize: SMALL, MEDIUM, or LARGE and press to select. This selects the trace to be single, double, or triple width.
5 - 28 92B/96B/99B/105B Users Manual In the DISPLAY window you can also choose the DOT JOIN function, which either shows the individual measurement samples or joins them together to give a continuous trace. DISPLAY MODE allows you to select normal or reverse video. 8. Press (CLOSE) to remove the window. The test tool displays the USER OPTIONS menu again.
Chapter 6 Using Additional Capabilities MAKING MEASUREMENTS USING THE CURSORS . . . . . . . . . . . . . . . . . . . . . . . . . . . . . . 6-2 Using the Markers . . . . . . . . . . . . . . . . . . . . . . . . . 6-3 Adding a Cursor Main Reading . . . . . . . . . . . . . . . 6-4 DELETING MEMORIES . . . . . . . . . . . . . . . . . . . . . . . 6-6 SAVING TO MEMORY . . . . . . . . . . . . . . . . . . . . . . . . 6-7 Saving a Screen . . . . . . . . . . . . . . . . . . . . . . . . . . .
6-2 92B/96B/99B/105B MAKING MEASUREMENTS USING THE CURSORS 92B The Cursors allow you to make precise digital measurements of waveform activity between measurement areas. This can be done on live waveforms and on saved waveforms. • From Scope mode, press off) the cursor readings. to turn on (and Active cursors appear on the display as two vertical and two horizontal lines. The intersection of vertical and horizontal lines of the left cursor marks a point on the waveform.
Using Additional Capabilities 6-3 When the cursor readings are turned on, you can choose one or more measurements as follows: 1. From Scope mode, press More Scope window. to open to the 2. From the second screen page of the More Scope window, highlight ADD MAIN READING. Press to open the list box. The ADD MAIN READING list box allows you to choose which cursor measurement reading to display. A list of possible measurements is shown in Figure 6-1. 4. Choose the waveform source with Measure on Waveform.
6-4 92B/96B/99B/105B Users Manual Adding a Cursor Main Reading From the ADD MAIN READING list box, use or to highlight the reading to display, then press select. Repeat this for more readings. to In making cursor measurement calculations, the ScopeMeter test tool uses waveform activity between the cursors. Figure 6-3. Cursor Main Readings List Box The measurement results are displayed in the bottom display area. A maximum of five measuring functions can be turned on at the same time.
Using Additional Capabilities • t2 from TRIG Measures the time difference between the trigger occurrence and the right cursor. • V1 Measures the voltage amplitude where the left cursor crosses the waveform. • V2 Measures the voltage amplitude where the right cursor crosses the waveform. • Vrms Measures the Root Mean Square (rms) voltage between the cursors. • V DC (mean) Measures the MEAN (average of readings) value of waveform between the cursors.
6-6 92B/96B/99B/105B DELETING MEMORIES 92B Open the Delete Menu at any time by pressing . Users Manual CAUTION and Figure 6-4. Delete Memory List Box You can now delete all memories or selected memories (Screen memories, Waveform memories, or Setup memories). A message appears prompting you to confirm that you want to delete all memory. A Master Reset destroys all memory contents and leaves initial setup with its default settings.
Using Additional Capabilities 6-7 SAVING TO MEMORY 92B You can save screens, waveforms, and setups to memory, copy them between memories, and recall them from memory. Ten nonvolatile Screen memories, 20 nonvolatile Waveform memories, and 40 nonvolatile Setup memories are available. (For FLUKE 96B you can save five nonvolatile Screen memories, 10 nonvolatile Waveform memories, and 20 nonvolatile Setup memories). • Press to open the Save to Memory menu.
6-8 92B/96B/99B/105B Copying Waveforms or Settings To copy a waveform or setting from one memory to another, press to open the More Save window. RECALLING FROM MEMORY 92B You can review screens and recall waveforms and setups from memory at any time. • Figure 6-5. More Save Window First choose what you want to copy, a waveform or a setting. Then determine from which memory you want to copy. On pressing (SELECT ITEM), you must choose the memory to which you want to copy.
Using Additional Capabilities 2. Use (PREVIOUS SCREEN) or SCREEN) to step through the saved screens. 6-9 (NEXT 3. Press to replace the actual setup with the recalled setup that belongs to the saved screen. Recall Screen Menu Recalling a Waveform 1. Press (RECALL WAVEFORM) to recall a saved waveform from waveform memory. A list of all used waveform memories now appears. 2. Use and to highlight the required waveform. The View Area displays the saved waveform in compressed form. 3.
6 - 10 92B/96B/99B/105B To reposition any of the recalled waveforms on the display, first select the appropriate waveform separately by pressing , highlight "move #" in the list box with and , and press to select. appears in the right bottom of the display. Now use and to reposition the waveform. Press (CLEAR WAVEFORM) to remove all recalled waveforms from the display. The live waveforms (A, B, and A±B) remain displayed, and the present setup configuration will not change.
Using Additional Capabilities 6 - 11 USING WAVEFORM MATH FUNCTIONS 92B 96B You can perform several math functions on the various waveforms or memories. • • ADD, SUBTRACT, and MULTIPLY require two operands (SOURCE 1 and SOURCE 2). The operands can be selected from acquisition memories or waveform memories. INVERT, INTEGRATE, and FILTER require one operand (SOURCE 1) from acquisition memories or waveform memories. • All operations require a DESTINATION waveform memory selection.
6 - 12 Multiply Multiplies two waveforms (each sourced from an active input or a memory location) and stores the result in the next free waveform memory. For example, power can be calculated with MULTIPLY if SOURCE1 represents the voltage drop across a device and SOURCE 2 represents current through that device. In the following Figure, waveforms from Waveform 4 memory (upper) and INPUT A (middle) are multiplied, resulting in the waveform stored in Waveform 5 memory (lower).
Using Additional Capabilities Filter Any waveform (active input or memory) can be filtered, with the resulting waveform stored in a new memory location. Noise suppression or simply waveform smoothing is thereby possible. Filtering is especially useful with single-shot waveforms, where averaging of multiple waveform samples is not otherwise available.
6 - 14 92B/96B/99B/105B USING A PRINTER 92B Connecting to a Printer Use the Optically Isolated RS-232 Adapter/Cable (PM9080/001) to connect a printer to the OPTICAL INTERFACE connection of the ScopeMeter test tool. See Figure 6-7. Users Manual NOTE The following instructions relate to actions you must take at the test tool end of this operation. Setting Print Parameters Press and then to open the Printer window. You can now choose the printer settings and type of information to print.
Using Additional Capabilities SCREEN (default setting) Print a graphic copy of the actual display (Scope, Meter, or in any other mode). 6 - 15 READINGS Print a numerical representation of the measured values in table form. Printing can be done once (single) or repetitively with a selected interval time.
6 - 16 WAVEFORMS Print the selected waveform. The waveform is printed in a numerical format that represents sample data points (Scope mode only). You can calculate the real voltage of each data point by subtracting the Y-pos from the data point value (3-0=3, etc), then multiplying this with the 200 mV/dot parameter (3 * 200 mV = 600 mV). The time distance between two dots is 20.0 µs here. Printing Grey in White or Black Print the grey persistence of the display as white or as black on paper.
Using Additional Capabilities 6 - 17 USING THE WAVEFORM GENERATOR TESTING COMPONENTS 92B 96B 92B 96B Press and then to open the GENERATE menu. You can now select a waveform output at the red (GENERATOR OUT) and black (COMmon) 4-mm banana jacks. Figure 6-9. Generator Menu 1. Select GENERATOR OUTPUT and turn the generator on and off. 2. Choose one of the six waveforms: Square wave: 1.
6 - 18 2. Choose the type of TEST WAVEFORM: the test tool outputs a slow voltage sweep (-2V to +2V) or current sweep (0 to +3mA). 3. Choose the TEST PROBE COUPLING: AC or DC coupling. Connect the component to be tested between the red (GENERATOR OUT) and black (COMmon) 4-mm banana jacks. Measure the component on INPUT A. It's characteristics are shown on the special measure display. Auto Set cannot be used with the Component measurement mode.
Using Additional Capabilities 6 - 19 SETTING THE DATE AND TIME The ScopeMeter test tool has a real time clock that keeps track of date and time. The clock function is useful in combination with Min Max Trendplot™ if you want to know when a particular event occurred. Setting the Time You can set the time as follows: 1. From the User Options menu, press TIME) to open the Date and Time menu. (DATE AND 2. Press (SET TIME) to open the time setting menu. Figure 6-11 shows an example of this menu. 3.
6 - 20 92B/96B/99B/105B Users Manual Setting the Date CHANGING THE RESET CONFIGURATIONS You can set the date as follows: When you turn the test tool on, it begins operation in the last-known configuration, and the main SCOPEMETER function menu appears. Subsequent power-ons maintain configuration changes made with keystrokes or through recall of a setup memory during the previous session. Default settings are used at the first power-on or after a reset. You can reset the test tool at any time.
Using Additional Capabilities 6 - 21 To perform a selective reset, do the following: 1. From the User Options menu, press MORE OPTIONS menu. 2. Press to open the to open the RESET menu (see Figure 6-12). 3. Choose the reset options which include: the default settings for Master Reset, or selectively resetting any of the main modes, e.g., Scope, Meter, Ohm, Diode, or EXT.mV. Figure 6-12. Reset Menu Window 4. Press to reset.
6 - 22 ALTERING THE CONTINUOUS AUTO SET CONFIGURATION When is pressed, the instrument assumes the Continuous Auto Set configuration. There are ways to alter the Continuous Auto Set configuration. These two methods are discussed below. 92B/96B/99B/105B Users Manual Changing Continuous Auto Set Options Change the Continuous Auto set configuration as follows: 1. From the User Options menu, press (MORE OPTIONS) and use to highlight AUTO SET. Press to open the window (see Figure 6-14).
Using Additional Capabilities The items shown in this window are divided into three pages. Select a page with (PREVIOUS PAGE) or (NEXT PAGE). 2. The first page in the window defines some basic actions taken during Auto Set. Specify whether the Continuous Auto Set will optimize trigger source and trigger slope during measurement. The factory default is "auto". Also specify whether Auto Set will reset trigger delay (default is that any delay set will be turned off). 3.
Chapter 7 Measuring Examples MEASURING TEMPERATURE . . . . . . . . . . . . . . . . . MEASURING CURRENT . . . . . . . . . . . . . . . . . . . . . . MEASURING POWER WITH MATH FUNCTION . . . . MEASURING THREE-PHASE ON A DUAL INPUT . . 7-2 7-4 7-7 7-9 MEASURING PHASE USING THE CURSORS . . . . 7-12 MEASURING PULSE RESPONSE OF AN AMPLIFIER . . . . . . . . . . . . . . . . . . . . . . . . .
7-2 92B/96B/99B/105B Users Manual This chapter examines some typical measurements that can be made with your ScopeMeter test tool. The examples given can be used as an aid in many applications. RED DOT MEASURING TEMPERATURE Temperature is an often measured characteristic. The 80T-150U optional Temperature Probe can be used in conjunction with the test tool to measure the surface temperature, air temperature, and non-corrosive liquid temperature.
Measuring Examples Move the slide switch on the probe to the °C position. The actual air temperature appears on the display. 7-3 The test tool starts continuously recording the air temperature and graphs the minimum, maximum, and average temperatures on the display. After about 24 hours the display appears as shown in Figure 7-2. Figure 7-2.
7-4 92B/96B/99B/105B Users Manual MEASURING CURRENT The 80i-1000s Current Probe is an optional accessory designed for use with the ScopeMeter test tool to measure current flow in electrical circuits. The reading in the Measure menu can be assigned to current (amps) sensed by the Current Probe. Refer to the instruction sheet provided with the 80i-1000s for complete information about Current Probe operation.
Measuring Examples 7-5 Set current probe range switch to 10 mV/A. + Do a Reset; probe scaling factor is 10:1. Select page 4 of the More Measure window. : A AC+DC METER : 10 mV/A Select Current Probe range. Clamp the Current Probe jaws around the conductor to be measured. The actual current appears on the display: 17.43 Arms. Figure 7-4.
7-6 92B/96B/99B/105B Users Manual To see the current as a waveform, set the test tool as follows: Set Current Probe range switch to 10 mV/A. + Do a Reset; probe scaling factor is 10:1. Select Scope mode. Select Continuous Auto Set. Select the Probe A menu. Open the Probe on INPUT A box. :10 mV/A Select current range. Close the window. The test tool displays the current as a waveform, which can be analyzed using all other functions.
Measuring Examples 7-7 MEASURING POWER WITH MATH FUNCTION 92B 96B When used with the optional 80i-1000s Current Probe, the ScopeMeter test tool is able to measure voltage and current at the same time. This may be used to measure average power consumption of an electrical load on a single-phase circuit. This measurement is reliable over a wide range of frequencies, irrespective of the wave shapes of voltage or current.
7-8 92B/96B/99B/105B Users Manual Select Continuous Auto Set. Open the Math menu. Select each item. Store the resulting waveform in Destination memory 1. Close the window. In Figure 7-7, INPUT A represents the current measurement, INPUT B the voltage measurement, and Destination memory 1 the product (equals power). In this example the following scales are used: INPUT A: 20 A/DIV INPUT B: 200 V/DIV Memory 1: 4 kW/DIV Figure 7-7.
Measuring Examples MEASURING THREE-PHASE ON A DUAL INPUT Dual input measurements can be used for many applications. This example shows how to use these measurements to determine phase rotation of a "Y" connected three-phase system at a load center. Use alligator clips to connect the ScopeMeter test tool to the three-phase system connections. 7-9 WARNING THE SETUP REQUIRES CONNECTING TEST LEADS TO LIVE COMPONENTS OF A HIGH ENERGY CIRCUIT.
7 - 10 92B/96B/99B/105B Make sure the circuit breaker is turned off. Connect the test tool to two circuit breakers of two different phases and the neutral bus bar as shown in Figure 7-9. Use the alligator clips for the red and grey 10:1 probes and black multimeter test lead. Figure 7-9. Connecting the Wires Users Manual + Do a Reset; probe scaling factor is 10:1. Set the test tool to Scope mode. Select Continuous Auto Set. Turn circuit breaker on.
Measuring Examples The upper display in Figure 7-10 shows that phase 2 (INPUT B) follows phase 1 (INPUT A). The lower display shows that phase 3 follows phase 1. 7 - 11 : Vrms AC (METER) The Volt RMS readout (about 230 Vrms) appears on the display. (see Figure 7-11.) Figure 7-10. Phase Measurements Figure 7-11.
7 - 12 92B/96B/99B/105B MEASURING PHASE USING THE CURSORS 92B In this example you will use the cursors to measure the phase difference between the waveforms on INPUT A and B. Use the two waveforms from the dual input three-phase measurement in the previous exercise. Cursors allow you to make accurate digital measurements. It is advised that you first press to freeze the waveforms to be measured. Measure the two sine wave waveforms as explained in the previous example.
Measuring Examples 7 - 13 The display shows the phase between the waveforms on INPUT A and INPUT B: "phase A>B -120°" (see Figure 7-12). To identify the point on the waveforms where the measurement has occurred, you can use the markers on page 3 within the More Scope window. Figure 7-12.
7 - 14 MEASURING PULSE RESPONSE OF AN AMPLIFIER 92B In this example you will use cursors to measure the rise time of a pulse. Rise time is an indication of the bandwidth limitation of an analog amplifier. First you determine the 0% and 100% reference points of the waveform to be measured. These are the intersections of the waveform and the cursors. This manual determination of the reference points enables you to ignore unwanted overshoot, undershoot, or ringing.
Measuring Examples 7 - 15 Set the left cursor to the low level of the waveform: see Figure 7-14. This is the 0% reference point. Set the right cursor to the high level of the waveform: see Figure 7-14. This is the 100% reference point. The test tool instantly displays the rise time: "156 ns". (See Figure 7-14.) To identify the points on the slope where the measurement has occurred, you can use the markers on page 3 within the More Scope window. Figure 7-14.
Chapter 8 User Maintenance CLEANING . . . . . . . . . . . . . . . . . . . . . . . . . . . . . . . . . KEEPING BATTERIES IN OPTIMAL CONDITION . . REPLACING AND DISPOSING OF BATTERIES . . . REPLACING FUSES . . . . . . . . . . . . . . . . . . . . . . . . . . 8-2 8-2 8-3 8-5 CALIBRATING THE PROBES . . . . . . . . . . . . . . . . . . 8-5 INPUT A Probe Calibration . . . . . . . . . . . . . . . . . . . 8-5 INPUT B Probe Calibration . . . . . . . . . . . . . . . . . . .
8-2 92B/96B/99B/105B WARNING RISK OF ELECTRIC SHOCK OR FIRE: USE ONLY INSULATED PROBES, TEST LEADS, AND CONNECTORS SPECIFIED IN THIS MANUAL WHEN MAKING MEASUREMENTS >42V PEAK (30V RMS) ABOVE EARTH GROUND OR ON CIRCUITS >4800 VA. USE PROBES AND TEST LEADS WITHIN RATINGS AND INSPECT BEFORE USE. REMOVE UNUSED PROBES AND TEST LEADS. REMOVE PROBES AND TEST LEADS BEFORE OPENING CASE OR BATTERY COVER.
User Maintenance 8-3 You can revitalize a battery pack with too low capacity as follows: 1. Reset the ScopeMeter test tool ( + ensure that the test tool is battery operated. 2. Press 3. 92B Press REPLACING AND DISPOSING OF BATTERIES ), and . This disables the battery save feature when no key entry is made for 5 minutes. Wait until the test tool is automatically turned off. When it is turned off, the batteries are completely discharged.
8-4 6. 92B/96B/99B/105B Users Manual Install a new NiCad battery pack (PM9086) or new alkaline (C Cell) batteries (type KR27/50 or R14) as shown in Figure 8.1. NOTE Ensure that the NiCad battery pack charging contact is aligned in the battery compartment as shown in Figure 8.1. Use only the PM9086 NiCad battery pack. 7. Reinstall the battery cover and secure the two screws. Figure 8-1.
User Maintenance 8-5 REPLACING FUSES Since the test tool uses electronically protected inputs, no fuses are required. CALIBRATING THE PROBES The following procedures describe dc calibration and ac adjustment for the 10:1 probe used on INPUT A (red scope probe) and INPUT B (grey scope probe). NOTE To meet full user specifications, use the 10:1 probes only with the inputs on which they have been calibrated. INPUT A Probe Calibration 1. Connect the INPUT A BNC input to the GENERATOR OUT red banana jack.
8-6 92B/96B/99B/105B 6. Use select. 7. Use press to highlight 10:1, and press to Users Manual INPUT B Probe Calibration 1. to select CALIBRATE PROBE on A, and to calibrate. Connect the INPUT B BNC input to the GENERATOR OUT red banana jack. See Figure 8-4. Use the grey scope probe and the grey 4-mm banana adapter. The test tool outputs a voltage on the GENERATOR OUT banana jack to the connected probe. 8.
Chapter 9 Appendixes 9A 9B 9C Specifications . . . . . . . . . . . . . . . . . . . . . . . . . . 9-3 Parts and Accessories . . . . . . . . . . . . . . . . . . 9-15 PM8907 Information . . . . . . . . . . . . . . . . . . . . 9-19 9D 9E Warranty and Service Centers . . . . . . . . . . . 9-21 Terminology . . . . . . . . . . . . . . . . . . . . . . . . . .
Appendixes 9-3 Appendix 9A Specifications INTRODUCTION Performance Characteristics FLUKE guarantees the properties expressed in numerical values with the stated tolerance. Specified non-tolerance numerical values indicate those that could be nominally expected from the mean of a range of identical ScopeMeter test tools. For definitions of terms, refer to IEC Publication 351-1.
9-4 MEASURE MENU The Measure menu gives direct access to over 30 measurements; the best operating mode is automatically selected. SCOPE MODE Continuous Auto Set Hands-free signal probing. Continuously follows input signals from 15 Hz to 50 MHz and automatically selects the proper time base, input range, and trigger level. Min Max Envelope Records the waveform excursions with a grey scale envelope on both inputs. 40 ns Glitch detect Sweep speeds 1 µs per division or slower on INPUT A.
Appendixes Single Shot ..............................................100 ns to 1 s/div Dual input alternating .........................100 ns to 20 µs/div Dual input chopped ..................................50 µs to 1 s/div Roll ................................................................2 s to 60 s/div Dual input chopped ....................................2 s to 60 s/div Accuracy ...................................................+(0.1% + 1 pixel) Record Length .......
9-6 METER MODE Displays up to four readings and a full screen scope waveform of INPUT A. DC Voltage Ranges direct input .................100 mV, 300 mV, 1V, 3V, 10V, 30V, 100V, 300V with 10:1 probe .........1V, 3V, 10V, 30V, 100V, 300V, 1 kV, 3 kV (limit 600V) Accuracy ...................................................... ±(0.5% +5 counts) Full Scale Reading ............................. 1000 or 3000 counts Normal Mode Rejection ................... >50 dB at 50 or 60 Hz Common Mode Rejection .............
Appendixes 9-7 Ω MODE Full Scale Reading........................................... 3000 counts Normal Mode Rejection ...................>50 dB at 50 or 60 Hz Common Mode Rejection .............. >100 dB at DC, 50, 60, or 400 Hz (external 4-mm banana jack inputs) Ranges ..... 30Ω, 300Ω, 3 kΩ, 30 kΩ, 300 kΩ, 3 MΩ, 30 MΩ Accuracy (300Ω to 30 MΩ)....................... ±(0.5% +5 counts) Accuracy (30Ω)......................................... ±(2.5% +25 counts) Full Scale Reading............................
9-8 METER, Ω, DIODE, and EXTERNAL mV MODE FUNCTIONS Smooth .... Moving average of readings for about last 8 sec. Normal ........<3.5 seconds response time for inputs >50 Hz Fast .................<1 second response time for inputs >50 Hz Change Alert™ ......... Audible beep when reading changes Touch Hold .......Audible beep & hold of last stable reading Relative .......... Zeros present reading as a reference value % Change...............% change relative to a reference value % Scale .................
Appendixes 9-9 GENERAL SPECIFICATIONS The accuracy of all measurements is within +(% of reading + number of counts) from 18 °C to 28 °C. Add 0.1 x (specific accuracy) for each °C <18 °C or >28 °C. Display Foil Compensated Super Twisted Liquid Crystal Size...........................................84 x 84 mm (4.7" diagonal) Resolution.................................................240 x 240 pixels, 25 pixels/div. in SCOPE mode Contrast .....................................................
9 - 10 92B/96B/99B/105B Users Manual Environmental (continued) Electromagnetic Interference ..................................................................................................meets the following specifications (see also "DECLARATION OF CONFORMITY" on page XI) The Fluke 92B, 96B, 99B, and 105B, including standard accessories, conforms with the EEC Directive 89/336 for EMI immunity, as defined by IEC 801-3, with the addition of the following tables.
Appendixes 9 - 11 Table 3 Susceptibility: disturbance less than 10% of full scale Frequency range: 10 kHz to 25 MHz E = < 0.1V/m E = 1 V/m E = 3 V/m Stand alone - - - With PM8918 - - 1 mV/div to 2 mV/div Table 4 Susceptibility: disturbance less than 10% of full scale Frequency range: 25 MHz to 1 GHz E = < 0.
9 - 12 92B/96B/99B/105B Users Manual Multimeter mode (V dc, excluding probe factor): Table 5 Susceptibility: no visible disturbance Frequency range: 10 kHz to 25 MHz E = < 0.1V/m E = 1 V/m E = 3 V/m Stand alone 100 mV to 300V 100 mV to 300V 100 mV to 300V With PM8918 100 mV to 300V 100 mV to 300V 100 mV to 300V Table 6 Susceptibility: no visible disturbance E = < 0.
Appendixes 9 - 13 ACCESSORY INFORMATION Safety Designed to Installation Category III per IEC 1010, CSA C22.2 (including approval), and UL1244 (including approval) for 600V measurements on industrial power distributions systems. MAX. Input voltage on ................300V rms, 600V rms with INPUT A or INPUT B 10:1 probe MAX. Input voltage on EXTernal input ................ 300 V rms Surge Protection ....................... 4 kV, 6 kV with 10:1 probe per IEC 664 and ANSI/IEEE C62.
Appendixes 9 - 15 Appendix 9B Parts and Accessories SERVICE MANUAL Part Number: 4822 872 05368 STANDARD KIT CONTENTS DESCRIPTION MODEL PART NUMBER Yellow Holster PM9083/001 --- NiCad Battery Pack (installed) PM9086/011 --- Power Adapter/Battery Charger models available: Universal Europe 230V, 50 Hz North America 120V, 60 Hz United Kingdom 240V, 50 Hz Japan 100V, 60 Hz Australia 240V, 50 Hz Universal 115V/230V PM8907/801 PM8907/803 PM8907/804 PM8907/806 PM8907/807 PM8907/808 ------------- Ac
9 - 16 92B/96B/99B/105B DESCRIPTION MODEL PART NUMBER REMARK Probe Set 10:1 10:1 Probe (Red) 10:1 Probe (Grey) HF Adapter (2 x Black) Adapter Probe Tip to Banana (Red) Adapter Probe Tip to Banana (Grey) High Voltage Test Pin (Red) High Voltage Test Pin (Grey) Mini Test Hook (Red) Mini Test Hook (Grey) Trim Screwdriver (Red) Trim Screwdriver (Grey) PM8918/002 --5322 210 70139 5322 210 70138 5322 263 50193 5322 264 20096 5322 264 20097 5322 264 20087 5322 264 20088 5322 210 70131 5322 210 70129 5322 3
Appendixes 9 - 17 DESCRIPTION MODEL PART NUMBER Probe Accessory Set HF Adapter (2 x Black) Adapter Probe Tip to Banana (Red) Adapter Probe Tip to Banana (Grey) High Voltage Test Pin (Red) High Voltage Test Pin (Grey) Mini Test Hook (Red) Mini Test Hook (Grey) Trim Screwdriver (Red) Trim Screwdriver (Grey) PM9094/002 --5322 263 50193 5322 264 20096 5322 264 20097 5322 264 20087 5322 264 20088 5322 210 70131 5322 210 70129 5322 395 50417 5322 395 50416 Demo Board *) 5322 216 51279 Self Training Manu
9 - 18 DESCRIPTION Users Manual (English) Users Manual (German) Users Manual (French) Users Manual (Dutch) Users Manual (Spanish) Users Manual (Italian) Users Manual (Danish) Users Manual (Norwegian) Users Manual (Swedish) Users Manual (Finnish) Users Manual (Chinese) Users Manual (Japanese) Users Manual (Korean) 92B/96B/99B/105B MODEL PART NUMBER 4822 872 00724 4822 872 00725 4822 872 00726 4822 872 00727 4822 872 00728 4822 872 00729 4822 872 00734 4822 872 00732 4822 872 00733 4822 872 00731 4822 872 0
Appendixes 9 - 19 Appendix 9C PM8907 Information Your ScopeMeter test tool is powered by a PM8907 Power Adapter /Battery Charger. The version you use depends on the configuration ordered. WARNING TO AVOID ELECTRICAL SHOCK, CONNECT THE PM8907 POWER ADAPTER TO THE AC OUTLET BEFORE CONNECTION TO THE SCOPEMETER TEST TOOL.
9 - 20 92B/96B/99B/105B PM8907/801 PM8907/803 PM8907/806 Users Manual PM8907/807 PM8907/808 PM8907/804 Figure 9C-1. PM8907 Versions CAUTION At delivery, the PM8907/808 is set to 230V and is provided with a Power Supply Cord and Attachment Plug that is for use at the 115V setting only. When operating the unit at the 230V setting, you need a North American-to-European line plug adapter. Before you connect the PM8907/808 to the local line, first check the preselected voltage setting on this unit.
Appendixes 9 - 21 Appendix 9D Warranty and Service Centers LIMITED WARRANTY & LIMITATION OF LIABILITY Each Fluke product is warranted to be free from defects in material and workmanship under normal use and service. The warranty period is three years and begins on the date of shipment. Parts, product repairs and services are warranted for 90 days.
9 - 22 92B/96B/99B/105B Users Manual To obtain warranty service, contact your nearest Fluke authorized service center or send the product, with a description of the difficulty, postage and insurance prepaid (FOB Destination), to the nearest Fluke authorized service center. Fluke assumes no risk for damage in transit. Following warranty repair, the product will be returned to Buyer, transportation prepaid (FOB Destination).
Appendixes 9 - 23 Appendix 9E Terminology The following list defines special terms used in this manual. The terms are listed in alphabetical order. Words shown in italics can be found elsewhere in the list. AC See "Alternating Current." AC Coupling A mode of signal transmission that passes the dynamic AC signal component to INPUT A and INPUT B but blocks the DC component. Useful to observe an AC signal that is normally riding on a DC signal.
9 - 24 92B/96B/99B/105B Users Manual BNC Coaxial-type input connector used for INPUT A and INPUT B. Decibel Measurements that indicate voltage or power comparison in a logaritmic scale. Bottom Display The lower part of the display, where the function key menu is listed. Delta % Percentage change (delta) uses the present numerical reading as a relative reference. The display then shows a percentage that represents the difference between each new reading and the relative reference.
Appendixes 9 - 25 Dual Trace A feature that allows the ScopeMeter test tool to display two separate live waveforms at the same time. Frequency The number of times a waveform repeats in 1 second, measured in Hertz (Hz) where one Hz is one cycle per second. Duty Cycle Ratio of a waveform with respect to the total waveform period, as measured in percent. Function keys The five blue keys along the top of the keypad. They change function based on the present mode or settings.
9 - 26 92B/96B/99B/105B Users Manual Input Coupling Modes of signal transmission for INPUT A and INPUT B: AC coupling, DC coupling, and GND (Scope only). Meter Mode In this setting, the ScopeMeter test tool works like a digital multimeter, presenting information in numerical readings, and with a reduced Scope display. Input selection Select if and how the INPUTS A and B are displayed in Scope mode. This can be normal display, inverted display, or neither.
Appendixes 9 - 27 Probe Calibration A procedure that adjusts the ScopeMeter test tool internally to compensate for resistance variations between probes. Probes Measuring conductor that connects the ScopeMeter test tool to a circuit; specifically for use in the BNC jacks. Pulse A waveform that increases from a constant value, then decreases to its original value. Pulse Trains A repetitive series of pulses. Pulse Width The duration from the beginning to the end of a signal's on-time or off-time.
9 - 28 92B/96B/99B/105B Smooth (Scope) Averages multiple samples of a waveform. Useful to suppress noise without loss of bandwidth. Square Wave A common waveform that consists of repeating square pulses. Sweep Speed see "Time Base" Users Manual Trigger Slope The voltage direction necessary for the ScopeMeter test tool to begin its trace. A positive slope requires the voltage to rise as it crosses the trigger level. A negative slope requires the voltage to fall.
Index Symbol °C Probe, 3-4 °F Probe, 3-4 Ω Mode, 3-4, 4-4, 9-7 Mode, 3-4, 4-5, 9-7 , 1-13 Numerics 0%-100%, 4-15 1/dt, 3-8, 3-13, 6-4 10:1 Probes, 2-4 15-Minute Demonstration, 2-2 20 Divisions, 5-10 4-Field Sequence, 5-18, 5-19 4-mm Banana Jack, 1-7 A A AC, 3-6 A AC+DC, 3-6 A DC, 3-6 Ampere Measurements, 3-6 A versus B, 5-26 A+B, 5-26 A-B, 5-26 AC-Coupling, 5-4 Accesory Information, 9-9 Accessories, 9-13 I-1 Accessory, 3-4 Adapter/Cable, 1-8, 6-14 Adapting the Display, 5-27 Add, 5-26, 6-11 Add Main Read
I-2 Battery Replacement, 8-4 Battery Save Feature, 8-3 Beeper Alert, 4-5, 4-13 BNC Jack, 1-7 Bottom Display, 1-9 C Calibrating the Probes, 8-5 CANCEL Key, 1-12 Capabilities, 1-2 Capturing 10 or 20 Divisions, 5-10 Capturing Glitches, 5-5 Caution Statements, VIII CE, XI, 9-10 Change Alert, 4-13, 9-7 Characteristics, 9-3 Charger, 1-4 Charging the Battery, 1-6, 8-2 Cleaning, 8-2 Clear at Run, 6-21 Close key, 1-12 COM (Common), VIII Combinations with INPUT A and INPUT B, 5-26 Common Ground, 1-7 Common Measureme
Index Default Settings, 6-20 Default Startup, 2-4 Delay, 5-14 Delay Time, 9-5 Delete Menu, 6-6 Deleting Memories, 6-6 Delta Time, 3-8 Diode, 3-4 Diode Test, 3-2, 4-5, 9-7 Display, 1-8, 2-3, 9-9 Disposing of Batteries, 8-3 Dot Size, 5-27 dt, 3-8, 3-12, 6-4 Dual Display, 1-9 Duty Cycle, 3-7, 9-6 dV, 3-5, 6-4 E Earth Ground, VIII Easy Setup, 2-5 Electrical Shock, IX Electrically Floating, VIII Electro-Magnetic Interference, 9-9 Environmental, 9-9 Environmental Data, 9-3 Error messages, 1-13 Events, 5-14, 9-5
I-4 H Heavy Duty Industrial Measurements, XIII Help Function, 1-13 Help Level, 6-21 HF Adapter, 1-7, 4-2 High Frequency Electronic Measurement, XII Hold, 4-10 Holster, 1-3, 9-15 Humidity, 9-9 Hz, 3-7, 6-5, 9-6 I Industrial Alligator Clips, 9-16 Information Level, 6-21 Information Mode, 1-13 INPUT A, 1-7, 5-4 INPUT A BNC jack, 4-2 INPUT B, 1-7, 5-4 INPUT B BNC jack, 4-2 Input Connectors, VIII Input Coupling, 5-4 Input Impedance, 9-4 Integrate, 6-12 Invert, 5-5, 6-12 Isolated, VIII Isolated Measurement, X
Index Meter Operations, 2-10, 2-11, 2-12 Min Max, 4-9, 9-7 Min Max Envelope, 5-21, 5-22, 9-4 MIN MAX Recording, 4-9 Min Max Scaling, 4-16 Min Max Zero ∆, 4-16 Mini Testhook, 1-7, 4-2 MORE Function Key, 1-11 More INPUT A, 5-26 More INPUT B, 5-26 More Measure, 3-3 More Save, 6-6 More Scope, 6-3 More Scope Window, 5-10 More Submenu, 4-13 More Trigger, 5-13 Multimeter Test Lead Set, 9-16 Multiple Waveforms, 5-26 Multiply, 6-12 N N-Cycle, 5-14, 9-5 NiCad Batteries, 1-4, 8-2, 9-8 Noise, 1-5 Noise Suppression, 6-
I-6 Probe Set 10:1, 9-16 Probe Type, 2-4 Protection, X Pulse Response, 7-14 Pulse Width, 3-7, 9-6 Q Quick Measurement Demonstration, 2-7, 2-8, 2-9 Quick Operating Guide, 1-3, 9-18 R Recall, 9-8 Recalling a Screen, 6-8 Recalling a Setup Configuration, 6-10 Record, 4-9 Record Length, 9-5 Recurrent, 5-6, 9-4 Recycling, 8-3 Replacing the Batteries, 8-3 Reset Configurations, 6-20 Resistance Mode, 4-4 Reversing the Polarity, 5-5 Rise Time, 3-8, 6-5, 7-15, 9-4 Roll, 5-6, 9-4 RPM, 9-6 RPM 1, 3-8 RPM 2, 3-8 RS-232
Index Smooth, 4-13, 9-7 Smoothing, 6-13 Special Functions Menu, 6-11, 6-17 Specifications, 9-3 Speed Up the Refresh Rate, 4-13 Stable Measurement, 4-8 Stand, 1-3 Start Printing, 6-16 Submenu, 4-13 Subtract, 5-26, 6-11 Supply, 9-8 Surge Protection, 9-9 Symbols, VIII T Temperature, 9-9 Temperature Measurement, 7-2 Temperature Probe, 3-4, 7-2 Temperature Scaling, 9-7 Testing Components, 6-17, 9-8 Three Lead Connection, IX Three-Phase, X Three-Phase Measurement, 7-9 Tilt Stand, 1-3 Time Base, 5-6 Time Delay, 5
I-8 V V1 left, 3-11, 6-5 V2 right, 3-11, 6-5 V DC, 3-5 V DC (mean), 3-5, 6-5 V Max Peak, 3-5, 6-5 V Min Peak, 3-5, 6-5 V peak/peak, 3-5, 6-5 Vertical Resolution, 9-4 Vibration, 9-9 Video, 5-16 Voltage Measurements, 3-9 Vrms, 3-5, 6-5 Vrms AC, 3-5 Vrms AC (no DC), 3-10 Vrms AC+DC, 3-5 W Wait for Trigger, 5-13 Warning And Caution Statements, VIII Warranty, 9-21 Watt, 3-11, 9-6 WATT AC (no DC), 3-11 WATT AC+DC, 3-11 Waveform Area, 1-9 Waveform Generator, 1-7 Waveform Math Functions, 6-11 92B/96B/99B/105B Wa