
User's Manual


Fredenstein F610 Universal Entzerrer UE-1
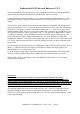
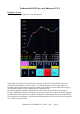
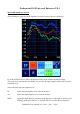
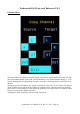
Spectrum Analyzer Screen
After touching the graph area in the Equalizer Screen the Analyzer Screen is displayed:
Up to three different curves will be displayed according to the channel and MAX settings.
The green curve represents the left channel, the red curve the right channel, and the blue curve the
maximum levels.
The touch fields below the graph area are:
IP: Selects the input signal(s) to be fed to the analyzer
OP: Selects the output signal(s) to be fed to the analyzer
MAX: toggles the MAX function, which shows the blue curve of the highest value for each
frequency band and, if MAX is on, the RST and DCY touch fields are displayed
Fredenstein F610 Manual V1.0 Nov 17, 2017 Page 7