
DSP Core Reference Manual


4-14 SC140 DSP Core Reference Manual
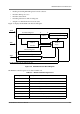
Main Capabilities of the EOnCE Module
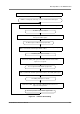
4.3.7 EOnCE Events
An emulator event is an occurrence that the emulator can count or trace, or that can cause the emulator to
perform an action.
Examples: A core clock cycle is an example of an event because the emulator can count core clock cycles.
The execution of a DEBUGEV instruction is another example of an event because the emulator can
perform an action—such as placing the core in debug state—whenever the core executes a DEBUGEV
instruction.
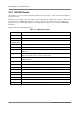
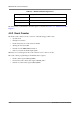
Table 4-4 below lists EOnCE event types.
Table 4-4. EOnCE Event Types
Event type Occurs when
DEBUG The core executes a DEBUG instruction
DEBUGEV The core executes a DEBUGEV instruction
JTAG
DEBUG_REQ
execution of the DEBUG_REQUEST command from the host through the JTAG port
EE An EE signal (EE0–EE5 or EED) is asserted (when programmed as an input)
Counter The 31-bit event counter reaches zero
EDCD The data event-detection channel (EDCD) detects specified values on the data-memory
data buses
EDCA An address event-detection channel (EDCA0–EDCA5) detects specified values on the
data-memory address buses or in the program counter
External EDCA Data address detection events detected by two optional external EDCA channels
(EDCA6, EDCA7)
Trace Buffer Full The trace buffer is full
ERCV The host writes the most-significant half of the ERCV register
ETRSMT The host reads the most-significant half of the ETRSMT register
VLES The core executes a VLES
Clock A new core clock cycle begins
Trace Transaction The emulator writes a record to the trace buffer
EC An EC signal (EC0 or EC1) is asserted
MARK The core executes a MARK instruction
COF A change of flow occurs during program execution